4 Statistics and probability
An overview of statistics and probability: how data is collected, summarised and correlated, how probability models chance, and how hypothesis tests reach conclusions, with HL's estimation, Poisson and Markov chains.
- IB Mathematics: Applications and Interpretation
- SL and HL
19 subtopics in Statistics and probability
Each one has its own page once something is published for it.
- 4.1Collecting data and sampling32 questions · notes
- 4.2Presenting data27 questions · notes
- 4.3Measures of central tendency and dispersion56 questions · notes
- 4.4Correlation and regression65 questions · notes
- 4.5Concepts of probability41 questions · notes
- 4.6Combined events70 questions · notes
- 4.7Discrete random variables45 questions · notes
- 4.8The binomial distribution79 questions · notes
- 4.9The normal distribution63 questions · notes
- 4.10Spearman’s rank correlation23 questions · notes
- 4.11Hypothesis testing57 questions · notes
- 4.12Data collection and reliabilityHL only18 questions · notes
- 4.13Non-linear regressionHL only53 questions · notes
- 4.14Linear transformations of random variablesHL only50 questions · notes
- 4.15The central limit theoremHL only30 questions · notes
- 4.16Confidence intervalsHL only28 questions · notes
- 4.17The Poisson distributionHL only44 questions · notes
- 4.18Further hypothesis testingHL only42 questions · notes
- 4.19Transition matrices and Markov chainsHL only48 questions · notes
An overview of 4 Statistics and probability
Introduction
Statistics is the study of data: how it is collected, summarised, displayed and used to draw conclusions about a whole population from a sample. Probability measures how likely an event is, and supplies the models, such as the binomial and normal distributions, that describe how data varies by chance. Together they are used to test a new medicine, set an insurance premium or decide whether a pattern in data is real.
The topic is the largest at SL, and most of its calculations are done with technology. The skill that matters most is choosing the right technique and interpreting the result in context: what a correlation of 0.8 says about two variables, what a probability of 0.03 means for a decision. At HL the topic adds estimation from samples, further tests and models of systems that move between states.
 YouTube
How the subtopics fit together
The subtopics form five strands. The map of the topic shows each strand as a row, with the SL subtopics shaded and the HL-only subtopics dashed; an arrow means the first subtopic is used in the second.
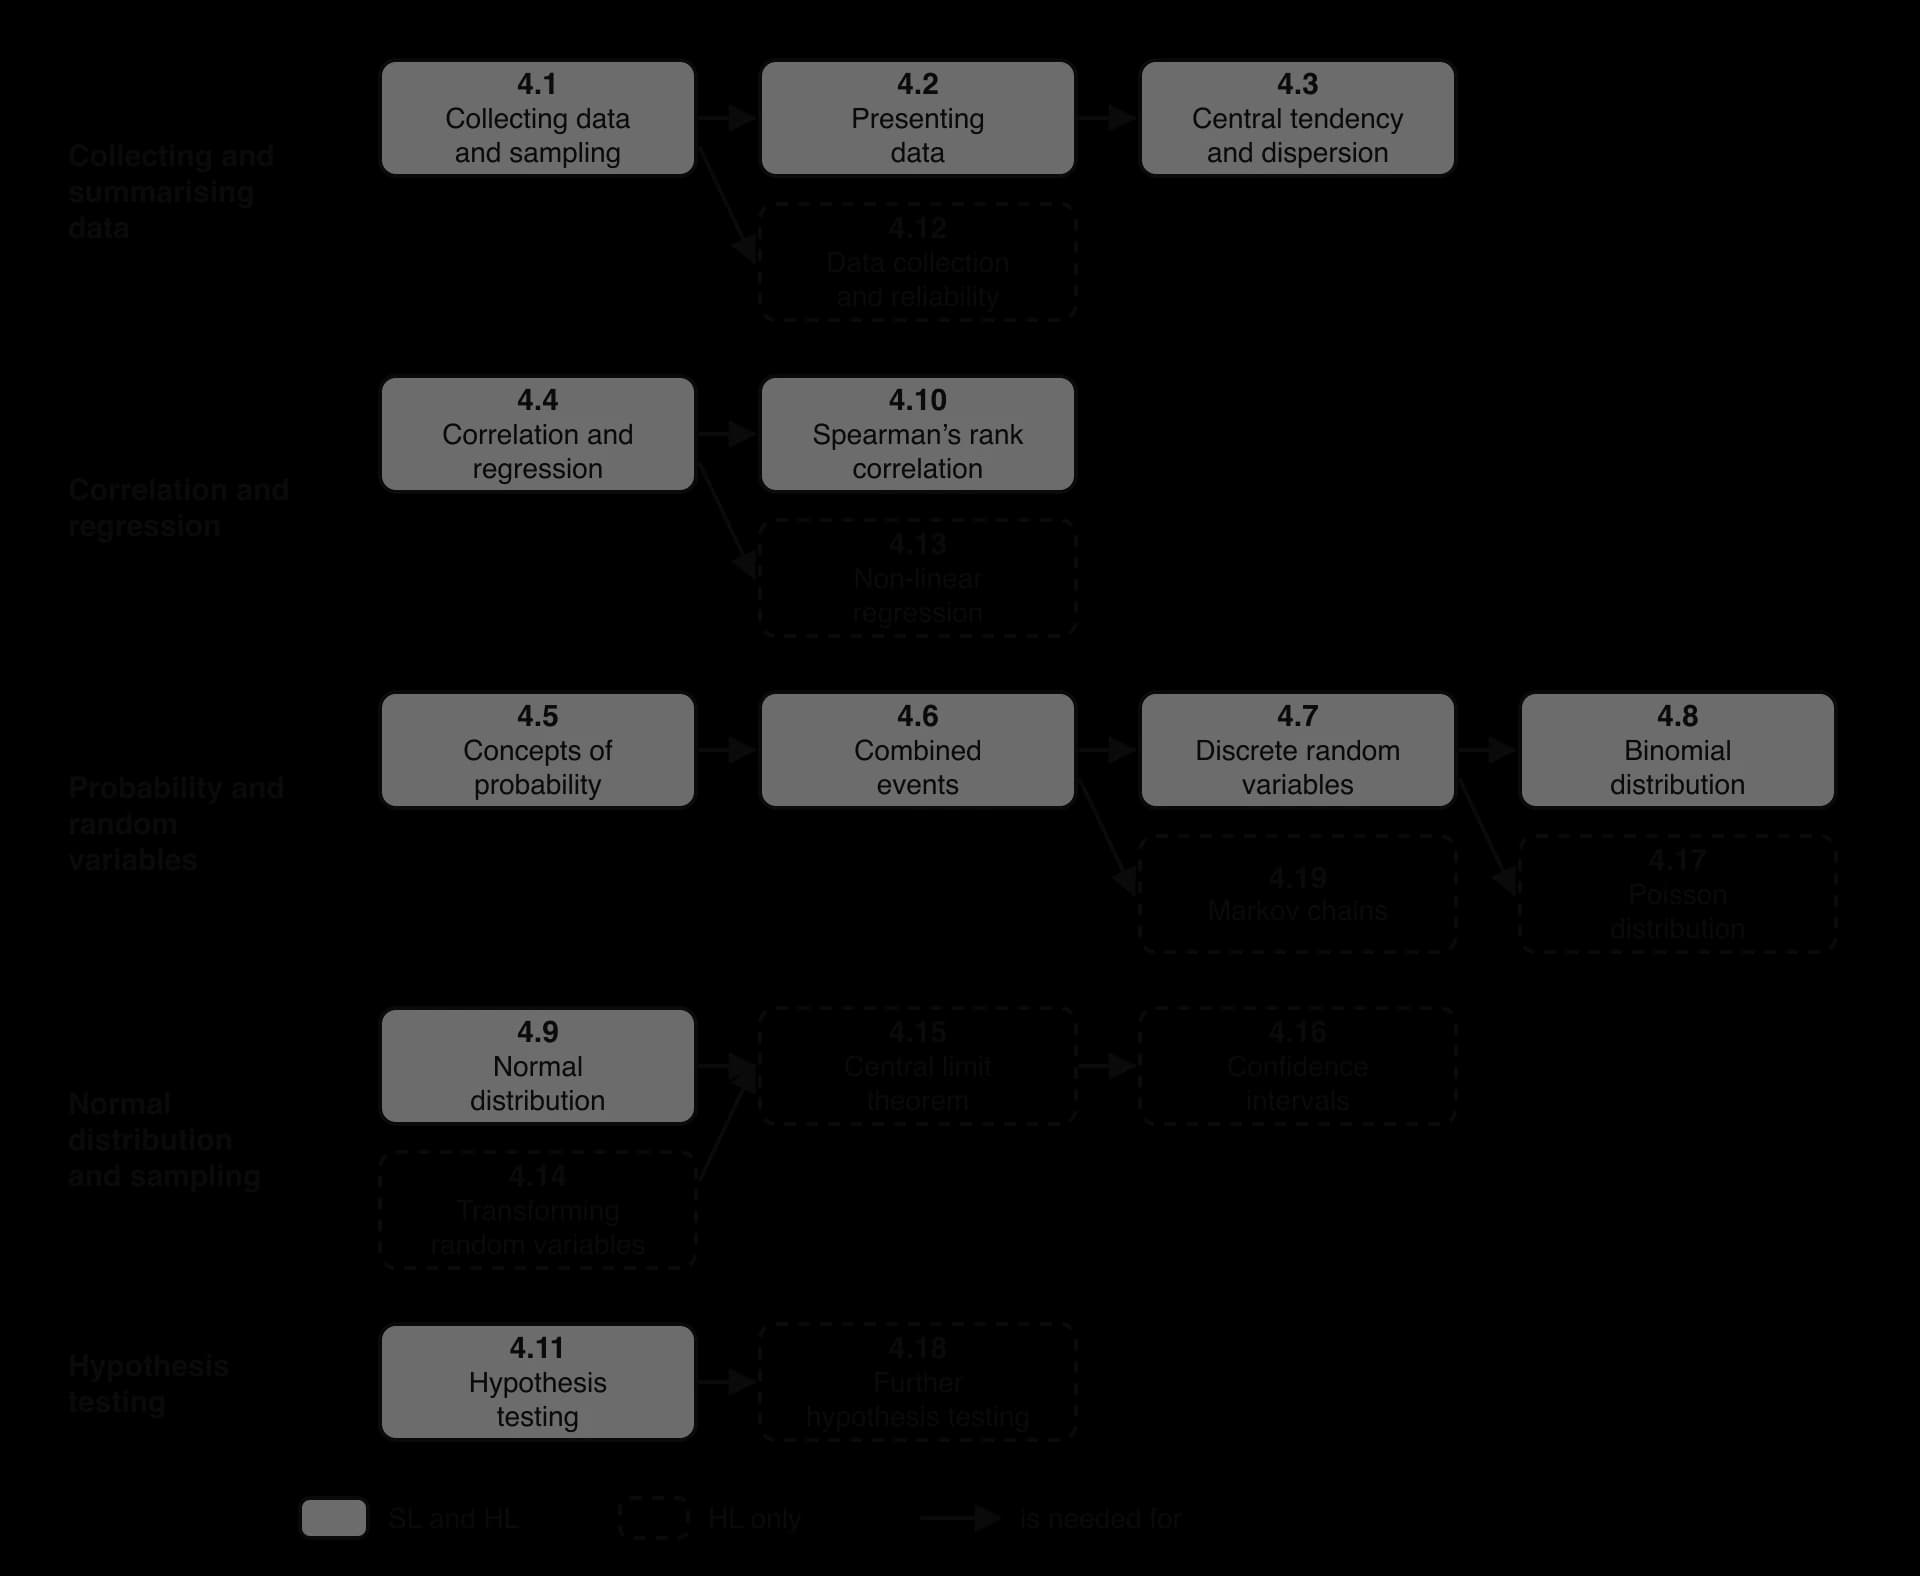
The data strands come first. A sample is chosen to avoid bias, displayed in histograms, cumulative frequency graphs and box-and-whisker diagrams, and summarised by measures such as the median and the standard deviation. Bivariate data adds a second variable: Pearson's r measures the strength of a linear relationship, the regression line of y on x makes predictions, and Spearman's rank correlation measures any increasing or decreasing relationship.
The probability strand builds from single events to random variables. Combined events, conditional probability and independence lead to the expected value of a game or decision, and then to the binomial distribution for counts of successes and the normal distribution for continuous measurements. The hypothesis testing strand uses these models to decide whether data supports a claim: a null hypothesis is rejected when the p-value is below the significance level.
The subtopics
Subtopic | Level | What it covers |
|---|---|---|
4.1 Collecting data and sampling | SL | Populations and samples, types of data, reliability and bias, sampling methods, and the 1.5 × IQR test for outliers |
4.2 Presenting data | SL | Frequency tables, histograms, cumulative frequency graphs with medians, quartiles and percentiles, and box-and-whisker diagrams |
4.3 Measures of central tendency and dispersion | SL | Mean, median and mode of raw and grouped data, quartiles, standard deviation and variance, and the effect of constant changes |
4.4 Correlation and regression | SL | Scatter diagrams, Pearson's r, lines of best fit and the regression line of y on x, and correlation versus causation |
4.5 Concepts of probability | SL | Sample spaces, equally likely outcomes, relative frequency, simulation, complementary events and expected numbers |
4.6 Combined events | SL | Venn and tree diagrams, two-way tables, conditional probability, and mutually exclusive and independent events |
4.7 Discrete random variables | SL | Probability distributions, the expected value , and fair games and decisions |
4.8 The binomial distribution | SL | When a count of successes is binomial, binomial probabilities with the GDC, and the mean and variance |
4.9 The normal distribution | SL | Properties of the normal curve, normal probabilities and expected numbers, and inverse normal calculations |
4.10 Spearman's rank correlation | SL | Ranking with ties, Spearman's coefficient, and choosing between it and Pearson's r |
4.11 Hypothesis testing | SL | Hypotheses, p-values and significance levels; chi-squared tests for independence and goodness of fit; the two-sample t-test |
4.12 Data collection and reliability | HL | Questionnaire design, reliability and validity tests, and choosing categories and degrees of freedom in goodness of fit tests |
4.13 Non-linear regression | HL | Quadratic, cubic, exponential, power and sine regression, residuals, the sum of square residuals and |
4.14 Linear transformations of random variables | HL | Mean and variance of and of sums of independent variables, and unbiased estimates of the mean and variance |
4.15 The central limit theorem | HL | Sums and means of normal variables, the distribution of a sample mean and the central limit theorem |
4.16 Confidence intervals | HL | Confidence intervals for a mean, using the normal distribution or the t-distribution, and their interpretation |
4.17 The Poisson distribution | HL | Counts of random events in time or space, the conditions, sums of Poisson variables, and choosing a distribution |
4.18 Further hypothesis testing | HL | Critical regions, z- and t-tests including matched pairs, tests for a proportion and a Poisson mean, tests of , and Type I and Type II errors |
4.19 Transition matrices and Markov chains | HL | Transition diagrams and matrices, state vectors after n steps, and the steady state |
Links to other topics
Regression connects statistics to the models of topic 2: a regression line is a linear model fitted to data, and the curved regression of subtopic 4.13 fits the exponential, power and sinusoidal models of subtopics 2.5 and 2.9. Fitting a straight line to logarithms of the data, in subtopic 2.10, gives a second route to the exponential and power models.
At HL, Markov chains use the matrices of subtopic 1.14 and the eigenvectors of subtopic 1.15: the steady state is an eigenvector with eigenvalue 1. The transition matrices built from graphs in subtopic 3.15 are Markov chains of the same kind, and the probabilities under a normal curve are areas, the same idea as the integrals of topic 5.
From the formula booklet
The entries of the mathematics: applications and interpretation formula booklet that 4 uses. Each opens in the explained booklet.
- Power formula for a matrixHL onlyTopic 1: Number and algebra › HL only › AHL 1.15 Power formula for a matrix
- Interquartile rangeTopic 4: Statistics and probability › SL and HL › SL 4.2 Interquartile range
- Mean, , of a set of dataTopic 4: Statistics and probability › SL and HL › SL 4.3 Mean, , of a set of data
- Probability of an event Topic 4: Statistics and probability › SL and HL › SL 4.5 Probability of an event
- Complementary eventsTopic 4: Statistics and probability › SL and HL › SL 4.5 Complementary events
- Combined eventsTopic 4: Statistics and probability › SL and HL › SL 4.6 Combined events
- Mutually exclusive eventsTopic 4: Statistics and probability › SL and HL › SL 4.6 Mutually exclusive events
- Conditional probabilityTopic 4: Statistics and probability › SL and HL › SL 4.6 Conditional probability
- Independent eventsTopic 4: Statistics and probability › SL and HL › SL 4.6 Independent events
- Expected value of a discrete random variable Topic 4: Statistics and probability › SL and HL › SL 4.7 Expected value of a discrete random variable
And 13 more in the formula booklet.
Carry on with 4 in Augment
With a free account, Augment remembers where you stopped and what you have practiced.