4.6 Combined events · IB Maths AI | Augment Education
4.6 Combined events
Combine events with set notation, Venn diagrams, tree diagrams and two-way tables; use the addition rule, conditional probability and the tests for mutually exclusive and independent events, with and without replacement.
IB Mathematics: Applications and Interpretation
Part of 4 Statistics and probability
SL and HL
Key terms introduced here
Each is in the Maths AI glossary, with every other term in the subject.
The probability that an event A occurs given that an event B has occurred, written P(A∣B); it is found by treating B
Notes on 4.6 Combined events
42 min readLast reviewed
Learning objectives
Use set notation (A∪B, A∩B, A′
Questions on 4.6
70 exam-style questions on this subtopic, written in the style of the IB papers. The first has its markscheme open. Counted on
Question 1 · AI-0070614 marks
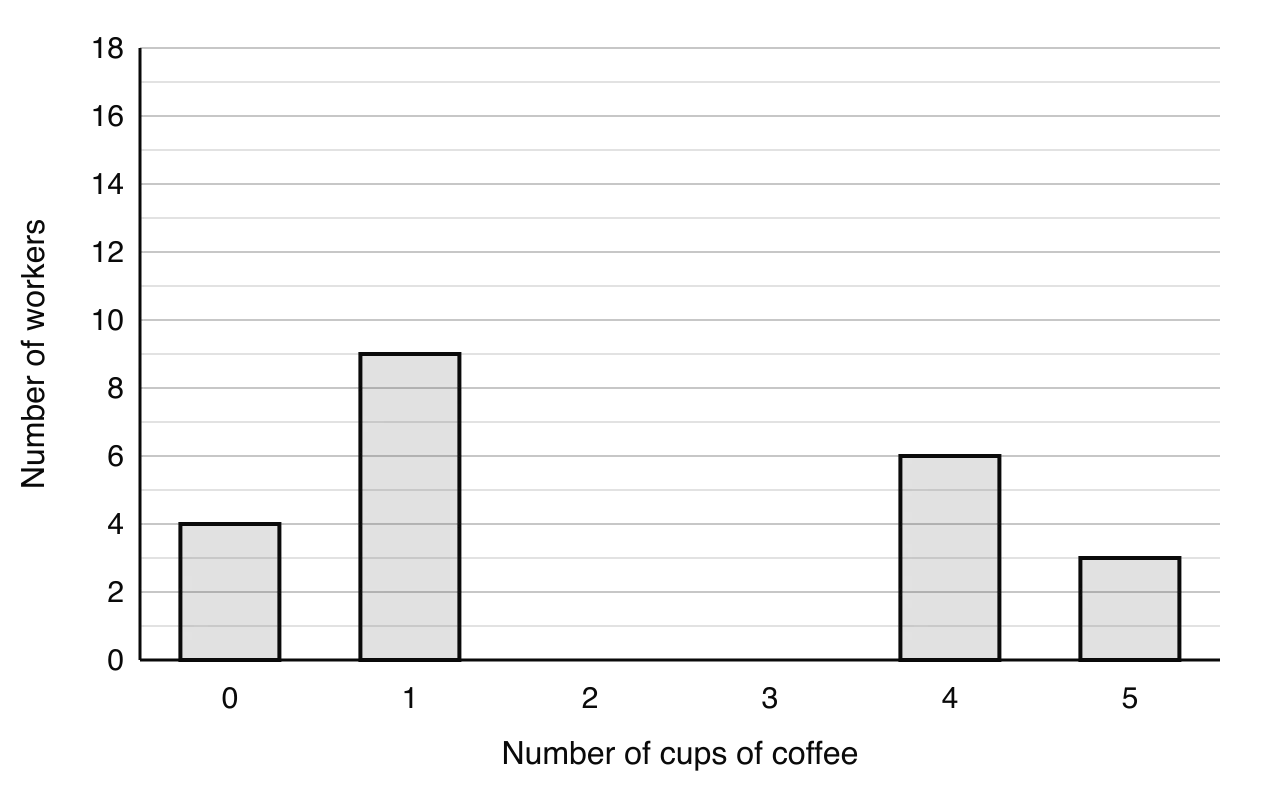
Haruto asks the 50 workers in an office how many cups of coffee they drink on a typical working day. His results are shown in the following bar chart, from which the bars for 2 cups and 3 cups are missing.
Let p be the number of workers who drink 2 cups and q the number who drink 3 cups.
(a)
Show that p+q=28
From the formula booklet
The entries of the mathematics: applications and interpretation formula booklet that 4.6 uses. Each opens in the explained booklet.
A branching diagram for a sequence of events, in which each branch represents an outcome at one stage and is labelled with its probability given the outcomes on the branches before it.
A table that classifies a set of people or items by two features, with one feature in the rows, the other in the columns, a count in each cell and totals in the margins.
A diagram in which a rectangle represents the universal set and closed curves (usually circles) inside it represent events or sets, with overlapping regions showing outcomes that belong to more than one event.
A method of repeated selection in which items are not returned once chosen, so the number of items, and usually the probabilities, change after each draw.
) to describe combined events, and shade or interpret regions of a Venn diagram.
Complete Venn diagrams with two or three sets from counts or probabilities, and use them to calculate probabilities.
Calculate the probability of "A or B" with P(A∪B)=P(A)+P(B)−P(A∩B), recognising that "or" includes both.
Identify mutually exclusive events and use P(A∩B)=0.
Calculate conditional probabilities from two-way tables, Venn diagrams and tree diagrams, and with P(A∣B)=P(B)P(A∩B).
Draw and complete tree diagrams for successive events, with and without replacement, and use them to find probabilities.
Determine whether two events are independent, using P(A∩B)=P(A)P(B).
Interpret conditional probabilities in context, including false positives and false negatives in testing.
Introduction
Real questions about chance rarely involve a single event. A doctor wants the probability that a patient has a disease given a positive test; an engineer wants the probability that a system with several parts keeps working; a pollster wants the probability that a voter is young or undecided. Each combines two or more events, and the answer depends on how the events are related: whether they can happen together, and whether one changes the chance of the other.
Combining events leads to two of the most important ideas in probability, conditional probability and independence, which are treated in full alongside the rules for "and" and "or". Four representations carry most of the work: Venn diagrams, tree diagrams, sample space diagrams and two-way tables. Many problems can be solved from a well-drawn diagram without any formula at all. Each formula can also be derived from a diagram, which makes it easier to see when it applies.
Set notation and Venn diagrams
Events are sets of outcomes, so the language of sets describes how events combine. A Venn diagram turns that language into a picture in which each region is a set of outcomes and its probability can be read off directly.
The universal set
In a Venn diagram the universal set is the rectangle. Every person, item or outcome in the problem sits somewhere inside it, including those that belong to none of the events drawn.
Union, intersection and complement
Three operations build combined events from simpler ones. The complement A′, "not A", was introduced in subtopic 4.5. The other two describe "or" and "and".
The everyday word "or" sometimes means "one or the other but not both", as in "tea or coffee?". In probability "or" always includes both. If A is "the student studies French" and B is "the student studies Spanish", then A∪B includes the students who study both languages.
Unions, intersections and complements can be combined further. A∩B′ is "A but not B"; (A∪B)′ is "neither A nor B"; and "exactly one of A and B" is (A∩B′)∪(A′∩B).
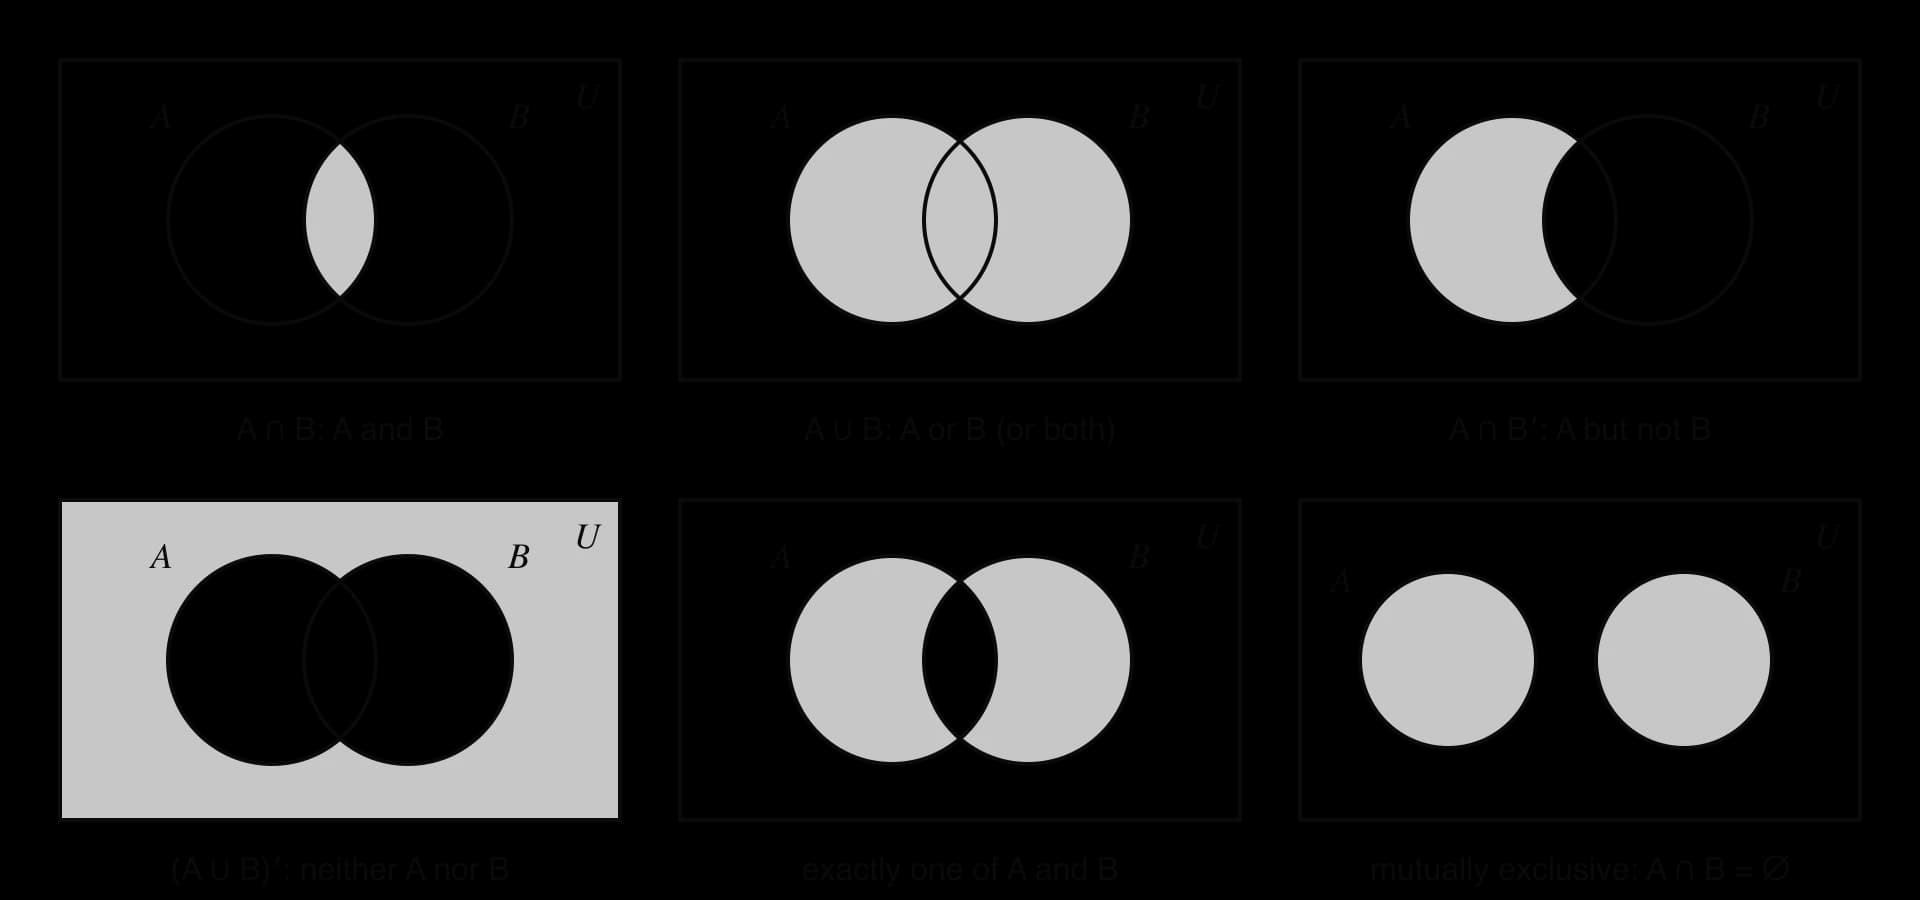
The set of six Venn diagrams shows the regions most often needed. Reading each shaded region in words is the key skill: "and" is the overlap, "or" is everything inside either circle, and a dash means "outside".
Shaded regions for the most common combined events. The overlap is A ∩ B; everything inside either circle is A ∪ B; when the circles do not overlap, the events are mutually exclusive.
Words
Set notation
A and B (both)
A∩B
A or B (or both)
A∪B
not A
A′
A but not B (only A)
A∩B′
neither A nor B
(A∪B)′ or A′∩B′
at least one of A and B
A∪B
exactly one of A and B
(A∩B′)∪(A′∩B)
not both
(A∩B)′
The last row and the neither row are easy to confuse. "Neither" excludes everyone in either circle, while "not both" excludes only the overlap, so it is a much larger region.
Venn diagrams with counts
When the data are numbers of people or items, each region of the Venn diagram holds the count for that region only. The reliable method is to start from the innermost region (the overlap of all the sets) and work outwards, subtracting what is already placed. The last number goes outside the circles, so that the grand total is the sum of every region.
Three sets
Three overlapping circles create eight regions: one inside all three circles, three inside exactly two, three inside exactly one, and one outside all of them. The same inside-out method works. Information such as "15 used the pool and the gym" usually means all who used both, including those who also used the third facility, so the number in all three must be subtracted to find "pool and gym only".
When the overlap is not given, it can be found from the total. The unknown count goes in the overlap as x, each "only" region is written in terms of x, and the regions are set equal to the grand total.
The addition rule
Probability of A or B
Adding P(A) and P(B) counts the overlap twice: once as part of A and once as part of B. Subtracting it once corrects the double count. In terms of counts from a Venn diagram, n(A∪B)=n(A)+n(B)−n(A∩B), and dividing by n(U) gives the rule for probabilities.
P(A∪B)=P(A)+P(B)−P(A∩B)
The rule links four probabilities, so any three of them give the fourth. Questions often give P(A), P(B) and P(A∪B) and ask for the overlap, or give the overlap and ask for the union.
Mutually exclusive events
Some events cannot happen together: a single die cannot show both a 2 and a 5, and a person cannot be both under 18 and over 65. In a Venn diagram their circles do not overlap.
For mutually exclusive events there is no overlap to subtract, so the addition rule simplifies.
P(A∩B)=0⇒P(A∪B)=P(A)+P(B)
The outcomes of a single trial are always mutually exclusive, which is why their probabilities can be added. An event and its complement are mutually exclusive too, and together they cover the sample space, which gives P(A)+P(A′)=1 again.
Two-way tables
Survey results and records are often summarised by two categorical features at once. A two-way table shows the count for every combination, with totals for each row and column.
Each cell is an intersection, each row or column total is a single event, and the grand total is n(U). The hypothetical table records whether 400 adults exercise regularly and whether they report good sleep.
Good sleep
Poor sleep
Total
Exercises regularly
150
70
220
Does not exercise regularly
90
90
180
Total
240
160
400
For an adult chosen at random, P(exercises∩good sleep)=400150=0.375. For "exercises or good sleep", add the row and column totals and subtract the cell counted in both: 400220+240−150=400310=0.775. The same answer comes from adding the three cells 150, 70 and 90. In subtopic 4.11, a table like this, called a contingency table, is used to test whether two variables are independent.
Conditional probability
Restricting the sample space
New information can change a probability. The probability that a randomly chosen adult from the table sleeps well is 400240=0.6. If it is known that the adult exercises regularly, only the 220 adults in that row are possible, and 150 of them sleep well, so the probability becomes 220150≈0.682. Knowing the condition shrinks the sample space to the condition's row.
The vertical bar is read "given". In P(good sleep∣exercises), the event after the bar is the condition: it is known to have happened and it supplies the denominator.
The conditional probability formula
Dividing the count n(A∩B) by the restricted total n(B) gives the conditional probability. Dividing the top and bottom by n(U) turns counts into probabilities, which gives the formula in terms of probabilities.
The formula gives the fraction of the probability of B that also lies in A. Multiplying both sides by P(B) gives an equally useful form for "and" probabilities, which is exactly the "multiply along the branches" rule of a tree diagram.
P(A∩B)=P(B)P(A∣B)
Conditional probabilities can also be read from a Venn diagram. In the class of 32 students, the probability that a French student also studies Spanish is P(S∣F)=185: the condition restricts attention to the 18 students inside the French circle, and 5 of them are in the overlap. With probabilities instead of counts the same idea gives P(S∣F)=P(F)P(S∩F).
YouTube
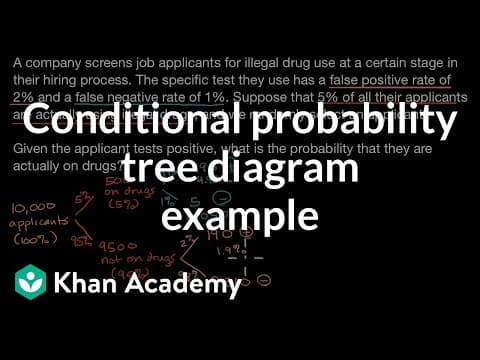
Khan Academy, “Conditional probability tree diagram example”: watch how a conditional probability is built from the products along the branches of a tree diagram.
Tree diagrams
Building a tree diagram
When events happen in stages, a tree diagram shows every route through them. Each stage is a set of branches; each branch carries the probability of that outcome, given everything earlier on the route.
Three rules make tree diagrams work.
The branches from any one point add up to 1, because they cover all the possible outcomes at that stage.
Multiply along a route to find the probability of that sequence of outcomes. This is P(A∩B)=P(A)P(B∣A): a fraction P(B∣A) of the routes that start with A continue with B.
Add the probabilities of different routes that give the same event. Different routes cannot happen together, so they are mutually exclusive and their probabilities add.
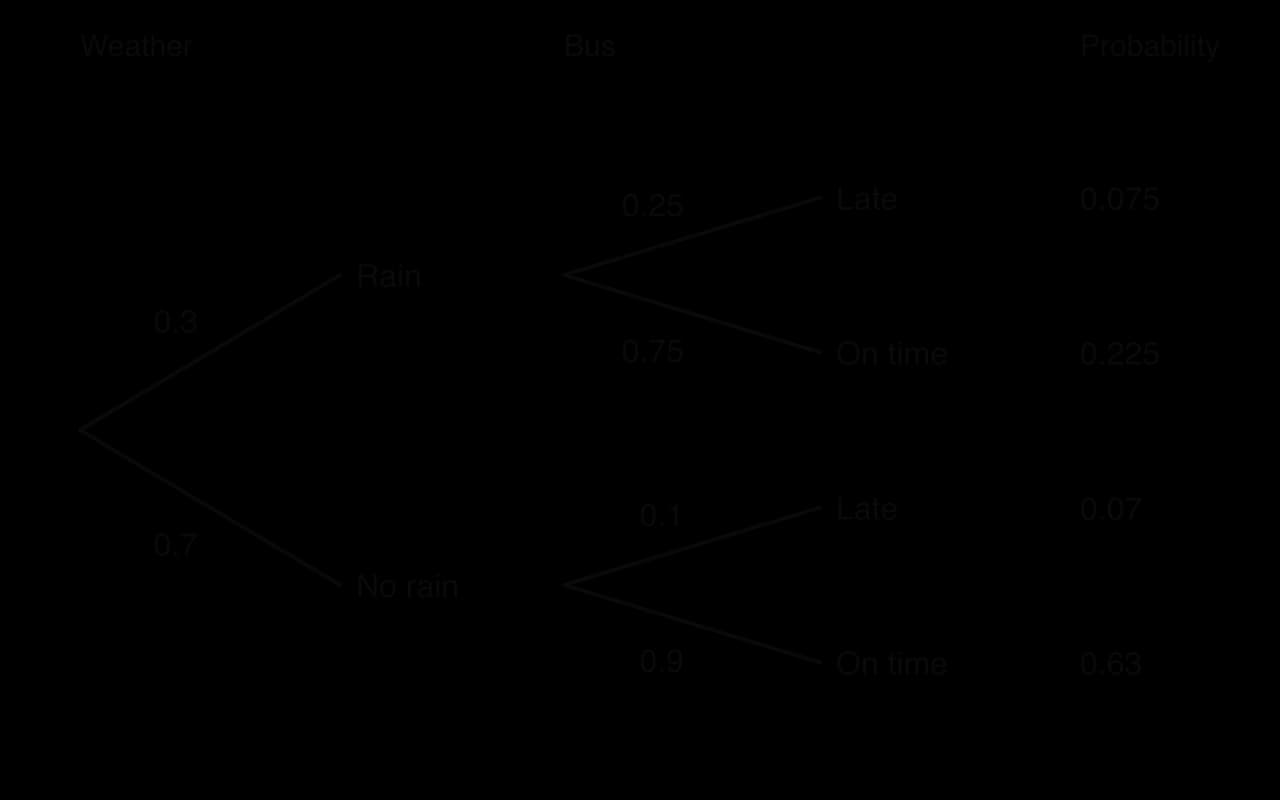
A commuter takes the bus to work. The probability of rain on a given morning is 0.3. On a rainy morning the bus is late with probability 0.25; on a dry morning it is late with probability 0.1. The tree diagram shows the two stages, with the probability of each route at the end.
Multiply along each route to get its probability; the four route probabilities add up to 1. The second-stage probabilities depend on the weather, so they are conditional probabilities.
The bus is late on two routes, after rain or after no rain, so the probability that it is late adds those two products.
P(late)=0.3×0.25+0.7×0.1=0.075+0.07=0.145
Given that the bus is late, the probability that it rained uses the conditional probability formula, with the late routes as the new sample space.
The tree is drawn in time order (weather, then bus), while the second calculation works backwards in time, using the result (late) to update the probability of the cause (rain). The conditional probability formula applies in either direction, and every number it needs can be read from the tree. Knowing that the bus is late raises the probability of rain from 0.3 to about 0.517.
With and without replacement
When items are drawn one after another from a collection, it matters whether each item is put back before the next draw.
Without replacement, the second draw depends on the first: after a red counter is removed there is one fewer red and one fewer counter in total. The tree's second-stage branches are then conditional probabilities that differ from route to route.
Finding unknown branch probabilities
Some questions give an overall probability and ask for a missing branch. The method is to write the overall probability as the sum of the route products, with the unknown as a letter, and solve the resulting equation.
Independent events
When one event does not affect another
Two events are independent when knowing that one has happened does not change the probability of the other. A coin toss and a die roll are independent; so are two draws with replacement. In symbols, P(A∣B)=P(A).
Substituting P(A∣B)=P(A) into P(A∩B)=P(B)P(A∣B) gives the multiplication rule for independent events, which is also the standard test for independence.
A and B independent⟺P(A∩B)=P(A)P(B)
For independent events, a tree diagram has the same probabilities on every branch of the second stage, whatever happened at the first. The rule also extends to more than two events: for independent events A, B and C, P(A∩B∩C)=P(A)P(B)P(C).
Testing for independence
To decide whether two events are independent, calculate P(A)P(B) and compare it with P(A∩B), or compare P(A∣B) with P(A). Equal values mean independent; different values mean not independent. The comparison must be written out with numbers.
Independent is not the same as mutually exclusive
The two ideas sound similar but are close to opposites. Mutually exclusive events cannot happen together, so if one happens the other certainly does not: knowing A changes P(B) to 0. That is the strongest possible dependence. Two mutually exclusive events with non-zero probabilities are therefore never independent, because P(A∩B)=0 while P(A)P(B)>0.
Mutually exclusive
Independent
Meaning
cannot happen together
one does not affect the probability of the other
Test
P(A∩B)=0
P(A∩B)=P(A)P(B)
Venn diagram
circles do not overlap
circles overlap, with the overlap in the right proportion
"Or" rule
P(A∪B)=P(A)+P(B)
P(A∪B)=P(A)+P(B)−P(A)P(B)
Example
one die shows 2; the same die shows 5
one die shows 2; a second die shows 5
YouTube
Khan Academy, “Conditional probability and independence”: watch how comparing a conditional probability with the unconditional one decides whether two events are independent.
Using independence: "at least one"
Independence is often a modelling assumption that makes a long calculation possible. Combined with the complement rule from subtopic 4.5, it gives the probability of "at least one" in a single step: the complement of "at least one" is "none", and the probability of "none" is a product.
Case study: the Sally Clark case
The cost of assuming independence without justification is shown by a real criminal case in England. In November 1999 Sally Clark, a solicitor, was convicted of murdering her two baby sons, who had died in 1996 and 1998. Her defence argued that both had died of sudden infant death syndrome (SIDS, "cot death"). An expert witness for the prosecution told the court that, for an affluent non-smoking family like hers, the probability of one SIDS death was about 1 in 8,543, and that the probability of two was therefore about 1 in 73 million.
The figure came from multiplying the two probabilities, which is the rule for independent events.
85431×85431=729828491≈73 million1
The multiplication assumes that a second SIDS death in a family is no more likely after a first one than in any other family. Genetic and environmental factors shared by children in the same family make that assumption very doubtful: a family that has suffered one SIDS death is likely to be at higher risk of another. If the conditional probability P(second∣first) were, purely for illustration, 1 in 100, the probability of two deaths would be 85431×1001, about 1 in 854,000. That is still small, but about 85 times larger than the figure the jury heard.
A second error was to treat the small probability as the probability that Clark was innocent. The figure, even if it had been correct, was P(two SIDS deaths∣innocent), not P(innocent∣two deaths). Two infant murders in one family are also extremely rare, and a fair comparison has to weigh the two explanations against each other; reversing a conditional probability in this way is known as the prosecutor's fallacy. In October 2001 the Royal Statistical Society issued a statement that there was "no statistical basis" for the 1 in 73 million figure. Clark's convictions were overturned at a second appeal in January 2003, after medical evidence that had not been disclosed at her trial came to light.
Sources: Royal Statistical Society statement on the Sally Clark case (October 2001); Court of Appeal judgment (January 2003), as summarised in Wikipedia, "Sally Clark".
Conditional probability in testing
Medical tests, security scanners, spam filters and quality checks all classify things as "positive" or "negative", and none is perfect. Two kinds of mistake are possible.
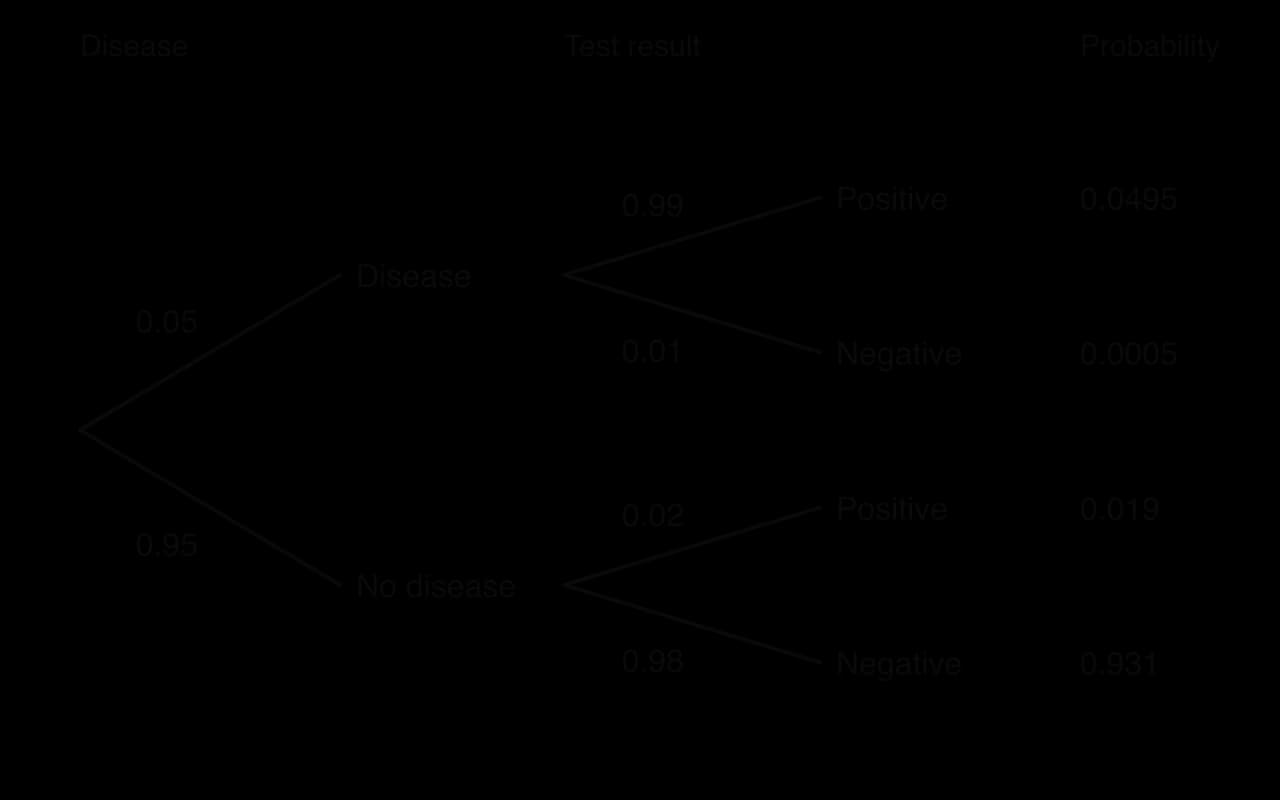
A screening test for a disease is set up as a tree. In a hypothetical population, 5% have the disease. The test is positive for 99% of people with the disease and for 2% of people without it.
A screening tree. The two positive routes, 0.0495 (true positives) and 0.019 (false positives), together make up all positive results.
A positive result can come from either route, so P(positive)=0.0495+0.019=0.0685. A patient with a positive result needs a different probability, the probability of having the disease given the positive result.
P(disease∣positive)=0.06850.0495≈0.723
Although the test detects 99% of cases, about 28% of the people who test positive do not have the disease. The reason is the base rate: healthy people are so much more numerous (95% of the population) that even a 2% false-positive rate among them produces many positive results. A table of expected numbers for 10,000 people makes this concrete.
Positive
Negative
Total
Disease
495
5
500
No disease
190
9,310
9,500
Total
685
9,315
10,000
Of the 685 positive results, 495 are true positives, and 685495≈0.723, as before. If the disease were rarer, say 0.5% of the population, the same test would give P(disease∣positive)=0.005×0.99+0.995×0.020.005×0.99≈0.199: four in five positive results would be false. For this reason, screening programmes for rare conditions usually follow a positive result with a second, more specific test.
Further applications
The birthday problem
In a group of 23 people, the probability that at least two share a birthday is just over 0.5, much higher than most people guess. The complement rule makes it a short calculation, assuming 365 equally likely birthdays (ignoring 29 February) and no twins. The complement of "at least two share" is "all different". The first person can have any birthday; the second must avoid one day, with probability 365364; the third must avoid two, 365363; and so on, like drawing without replacement from 365 days.
So P(at least two share)≈1−0.4927=0.507. The probability is high because of the number of pairs. 23 people form 223×22=253 pairs, each a chance for a match. The graph of this probability against the size of the group shows how quickly it rises.
The probability that at least two people in a group share a birthday passes 0.5 at 23 people and exceeds 0.99 by 60. Values from 1 − P(all different), assuming 365 equally likely birthdays.
The Monty Hall problem
A game show contestant chooses one of three doors; a car is behind one and goats are behind the other two. The host, who knows where the car is, always opens one of the other doors to show a goat, and offers the contestant the chance to switch. In 1990 a magazine column answered that switching is better, and thousands of readers wrote in to disagree. A tree diagram shows that the column was right.
Exam focus
Combined events are among the most frequently examined probability ideas, in Paper 1 questions of 4–7 marks and in the early parts of Paper 2 questions, where they often lead into a binomial or normal distribution. The recurring shapes are: completing a tree diagram (with or without replacement) and using it for an "and", an "or" and a "given that" probability; completing a two- or three-set Venn diagram from words, sometimes with an unknown x found from the total; probabilities read from a two-way table, including conditional ones; determine whether two events are independent; and medical or quality-control tests with false positives. Command terms are complete, draw, find, calculate, write down, determine, show that and justify. Markschemes give method marks for multiplying along branches and for adding the correct routes, and for conditional probability one mark for recognising it (dividing by the probability of the condition), one for the numerator and one for the denominator. The GDC is used only for arithmetic, but its fraction mode helps keep answers exact.
Examiners' reports list the same few errors year after year: forgetting to subtract the intersection in an "or" probability, ignoring the condition in a "given that" question (dividing by the grand total), treating draws without replacement as independent, and finding the right branch products but not adding them. "Three darts all land in the target" and "at least two land in the target" are different events, and misreading such wording costs marks.
Answers carried forward from a tree or Venn diagram earn follow-through marks only if they are valid probabilities. A final probability above 1, or a negative count in a Venn region, signals an earlier slip and should be checked before moving on.
Practice questions
For two events, P(A)=0.3, P(B)=0.5 and P(A∪B)=0.65. (a) FindP(A∩B). (b) Determine whether A and B are independent. [4]
A and B are mutually exclusive, with P(A)=0.25 and P(B)=0.4. Write downP(A∩B)
Describe in words, for A = "the person owns a car" and B = "the person owns a bicycle", the events (a) A∩B′, (b) (A∪B)′
A museum records its 250 visitors on one day: 150 adults, of whom 64 hired an audio guide, and 100 children, of whom 30 hired one. A visitor is chosen at random. Find the probability that the visitor (a) hired an audio guide, (b) is a child or hired an audio guide, (c) hired an audio guide, given that they are an adult. (d) Determine whether "adult" and "hired an audio guide" are independent. [8]
A box contains 4 working bulbs and 2 faulty bulbs. Two bulbs are taken at random without replacement. Find the probability that (a) both are faulty, (b) exactly one is faulty, (c) at least one is faulty. [6]
A learner driver passes the theory test at the first attempt with probability p. If they fail, the probability of passing at the second attempt is 0.8. The probability of passing within two attempts is 0.92. (a) Findp. (b) Given that the learner passed within two attempts, find the probability that they passed at the first attempt. [5]
A system works only if all three of its components work. The components work independently with probabilities 0.95, 0.9 and 0.98. Find the probability that (a) the system works, (b) at least one component fails. [4]
Find the probability that, in a group of 8 people, at least two share a birthday. State one assumption you make. [4]
A disease affects 1% of a population. A test is positive for 95% of people with the disease and for 5% of people without it. Find the probability that a person who tests positive has the disease, and comment on your answer. [5]
Explain why two mutually exclusive events, each with a non-zero probability, cannot be independent. [2]
Answers
(a) 0.3+0.5−0.65=0.15. (b) P(A)P(B)=0.3×0.5=0.15=P(A∩B), so independent.
P(A∩B)=0; P(A∪B)=0.65; P((A∪B)′)=0.35
(a) owns a car but not a bicycle; (b) owns neither a car nor a bicycle; (c) does not own both (owns at most one of them).
Guide total 64+30=94. (a) 25094=0.376. (b) 250100+94−30=250164=0.656
With independence, P(at least one)=1−P(none), with P(none) a product.
In testing, P(condition∣positive) depends on how common the condition is; rare conditions give many false positives.
Self-check
To do:
I can translate between words ("and", "or", "not", "neither", "exactly one", "not both") and set notation.
To do:
I can shade or identify regions of a two-set Venn diagram for any combined event.
To do:
I can complete a two- or three-set Venn diagram from counts, working from the centre outwards, and find an unknown from the total.
To do:
I can use the addition rule to find any one of P(A), P(B), P(A∩B) and P(A∪B) from the other three.
To do:
I can recognise mutually exclusive events and use P(A∩B)=0.
To do:
I can read single-cell, row, column, "or" and conditional probabilities from a two-way table.
To do:
I can find a conditional probability by restricting the sample space or with the formula.
To do:
I can draw and complete a tree diagram, with every set of branches adding to 1.
To do:
I can multiply along branches and add the correct routes.
To do:
I can adjust the second-stage probabilities for selection without replacement.
To do:
I can find an unknown branch probability by setting up and solving an equation.
To do:
I can find a "reverse" conditional probability, such as P(rain∣late), from a tree.
To do:
I can test two events for independence with a written numerical comparison.
To do:
I can explain the difference between independent and mutually exclusive events.
To do:
I can use independence and the complement rule to find "at least one" probabilities, and comment on whether independence is reasonable.
.
[1]1 mark
Markscheme (a)
50−(4+9+6+3)=28A1
p+q=28AG
[1 mark]
(b)
The mean number of cups drunk is 2.4. Show that 2p+3q=72.
[2]2 marks
Markscheme (b)
500×4+1×9+2p+3q+4×6+5×3=2.4M1
48+2p+3q=120A1
2p+3q=72AG
[2 marks]
(c)
Find the value of p and the value of q.
[2]2 marks
Markscheme (c)
p=12, q=16A1A1
[2 marks]
(d)
Find
(i) the median number of cups;
(ii) the interquartile range.
[3]3 marks
Markscheme (d)
(i) 25th and 26th values are 2 and 3, so the median is 2.5A1
(ii) Q1=1, Q3=3(A1)
IQR=2A1
[3 marks]
(e)
Draw a box-and-whisker diagram to represent the data.
[2]2 marks
Markscheme (e)
box from 1 to 3 with the median at 2.5 A1
whiskers from 0 to 5 (no outliers, since 3+1.5×2=6>5) A1
Note: FT from their part (d).
[2 marks]
(f)
Find the standard deviation of the number of cups.
[1]1 mark
Markscheme (f)
1.29614… ⇒ 1.30A1
[1 mark]
(g)
Two different workers are chosen at random. Find the probability that
(i) both drink no coffee;
(ii) exactly one of them drinks more than 3 cups.
[3]3 marks
Markscheme (g)
(i) 504×493=245012(0.00489795…) ⇒ 0.00490A1
(ii) 2×509×4941(M1)
2450738(0.301224…) ⇒ 0.301A1
Note: Award (M1) for a product of two probabilities with a denominator of 49 in the second. Award (M1)A0 for 0.295 (with replacement).
[3 marks]
Question 2 · AI-0070714 marks
Two factories, X and Y, make LED light bulbs. A sample of 200 bulbs from each factory is tested to find its lifetime, in hours. The results are shown on the following cumulative frequency curves.
(a)
Write down the median lifetime of the bulbs from
(i) factory X;
(ii) factory Y.
[2]2 marks
(b)
Find the interquartile range of the lifetimes of the bulbs from
(i) factory X;
(ii) factory Y.
[4]4 marks
(c)
Compare the lifetimes of the bulbs from the two factories.
[2]2 marks
(d)
Find the percentage of the bulbs from factory Y that lasted more than 1200 hours.
[2]2 marks
(e)
Factory X offers a refund for any bulb that fails before k hours. It wants to refund no more than 5% of its bulbs. Use the curve to estimate the greatest value of k it should choose.
[2]2 marks
(f)
A café buys three bulbs from factory Y. Assume that the lifetimes of the bulbs are independent and that the sample is representative. Find the probability that all three bulbs last more than 1200 hours.
A Venn diagram with probabilities confirms it: A only 0.35, overlap 0.2, B only 0.2, outside 0.25, and 0.35+0.2+0.2+0.25=1.
: playing an instrument does not change the chance of singing in the choir.
and
P(E∩G)=400150=0.375
.
R1
and
find
P(A∪B)
and
P((A∪B)′)
. [3]
, (c)
(A∩B)′
. [3]
.
. (c)
15064≈0.427
. (d)
P(adult)P(guide)=0.6×0.376=0.2256=25064=0.256
, so not independent.
. (b)
64×52+62×54=3016=158≈0.533
. (c)
1−64×53=53
.
. (b)
0.920.6≈0.652
.
. Assumption: 365 equally likely birthdays, ignoring 29 February (or: no twins in the group).
. Only about 16% of positive results are true positives, because the disease is rare and most positives come from the large healthy group; a second test is needed.
, which is positive when both probabilities are non-zero. Equivalently, if
A
happens then
B
cannot, so knowing
A
changes
P(B)
to 0.
, so
P(A∪B)=P(A)+P(B)
.
.
; test by comparing the numbers. Mutually exclusive events with non-zero probabilities are never independent.