6.11 Infographic
What infographics are for and how they work: grouping and encoding, pictograms and Isotype, headline, path and takeaway, persuasion by selection and scale, chartjunk, and reading data critically.
- IB English A: Language and Literature
- Part of 6 Non-literary text types
- SL and HL
Notes on 6.11 Infographic
An infographic is a single designed panel that presents information or data through pictures, icons, charts and short text, so that a viewer can take in its point in seconds. Infographics appear in newspapers and on news sites, in health campaigns, and in company and government reports. Above all they appear on social media, where they are shared by people who will never read the report behind them. Their promise is speed, and every convention of the type serves it. The leaflet from Kelverton Health, a community health service in Melbourne, “Keeping cool in a heat wave”, prints this infographic of who is most at risk beside its section of the same name.

In words, the panel is white, with a bold teal question across the top and a smaller gray sentence beneath it. Two full-width colored bars divide the rest. An orange bar heads a row of five pale orange circles, each holding a black icon above a short label. The icons are a stooped figure with a walking stick, a pram, a pregnant woman in profile, a heart crossed by a pulse line, and two pills. A teal bar heads a row of three wider, pale teal circles: a hard hat under a sun, a single figure inside a house, and a house with orange heat waves rising inside it. A rounded orange box runs across the foot with a request in bold, and the service’s name sits small in the bottom corner. Its words, from the top, are these:
Who is most at risk in the heat?
Heat can make anyone sick. Some people get sick more easily.
Heat is harder on their bodies
Older people, most of all if living alone · Babies and young children · Pregnant women · People with a long-term illness · People taking certain medicines
They are more exposed to heat, or have less help
People who work or exercise outdoors · People who live alone or are cut off from others · People with no way to keep cool at home, or no home
Know someone on this list? Call them on every very hot day.
Kelverton HealthKelverton Health, “Who is most at risk in the heat?”: headline, standfirst, the two bars and their labels, the call to action and the signature
Information at a glance
The infographic repeats information the leaflet has already given in words. The leaflet’s own version is a list:
Heat can affect anyone, but some people get sick more easily:
people over 65, especially if they live alone
babies and young children
…
people with no way to keep cool at home, including people who are homeless.“Keeping cool in a heat wave”, paragraphs 23–25 and 30
A list of seven dot points is already short, so the graphic does not exist to save words: its 100 words are about as many as the list and the request after it. It exists for the reader who looks before reading, and for the person who opens the leaflet on the fridge door weeks later and needs the point again in a second. An infographic is built for a glance first and a reading second. That is why it puts its message into shapes and colors that work before the labels are read, and why its words come in the shortest units the content allows.
This infographic contains no data in the strict sense. It presents categories of people, not quantities: nothing on it says how many older people fall ill or how much riskier the heat is for a baby. Many infographics combine the two, setting a headline and icons around a chart. Kelverton’s panel shows no numbers at all. A figure such as a rate of illness would need its source and an explanation, and a panel meant for every resident has room for neither.
The difference matters for analysis. A data visualization is judged first by whether its marks represent the numbers fairly, while an infographic without data is judged by how it sorts and shows its information. Both are texts with purposes and audiences, and both make choices that could have been made otherwise. A diagram is different again: it explains how something works or is built, as a cross-section of a machine does, rather than presenting facts about a population.
Sorting as an argument
The most important choice in the panel is one the leaflet never makes. The leaflet’s list runs from age to homelessness in a single column. The infographic divides the same people under two headings:
Heat is harder on their bodies
They are more exposed to heat, or have less helpKelverton Health, “Who is most at risk in the heat?”, the orange bar and the teal bar
The two bars turn a list into a classification by cause. Older people, babies, pregnant women and people with an illness or on certain medicines share a reason: their bodies cope less well. Outdoor workers, people who are isolated and people with no cool home share a different reason: their lives expose them more or protect them less. The classification carries an argument. Heat risk, it says, is partly a matter of biology and partly a matter of work, housing and company, so it is a social problem as well as a medical one.
The grouping changes some of the content as it sorts it. The infographic gives isolation a circle of its own (“People who live alone or are cut off from others”), where the leaflet folds living alone into its point about people over 65. It drops the leaflet’s only number, “over 65”, for “Older people”. It splits illness from medicines. Each change makes the two groups cleaner, which is what a classification needs and what a list does not.
Color, position and size
The visual means of a graphic that carry its information are its encoding. Here color does the main work: orange for the first group, teal for the second, so every circle can be placed by its tint before its label is read. The colors are not neutral. Orange is the warmer, heavier color, used elsewhere in the leaflet’s design for warnings, so the bodies at risk are marked as the more urgent group; teal is the service’s own color. The one orange element in the teal row is the heat rising inside a house, which ties homelessness and unaffordable cooling back to danger.
Position ranks the groups. The orange row sits above the teal row and is read first, so the panel presents bodily risk before social risk. Size, by contrast, ranks nothing: all eight circles are the same size, and the teal ones are only spaced more widely. Equal circles make a claim of their own, since they say nothing about which group is largest or suffers most. In a graphic with numbers, equal shapes for unequal quantities would mislead. In a graphic with no numbers, they are an honest way of saying that each group deserves the same attention.
Pictograms and the Isotype tradition
Each circle in the panel holds a pictogram that names a group of people:
Babies and young children
People taking certain medicines
People who work or exercise outdoorsKelverton Health, “Who is most at risk in the heat?”, labels under the pram, the pills and the hard hat
A pictogram works because its viewers share a convention. A pram means infancy to anyone who has seen one pushed along a street, and two capsule shapes mean medicine almost everywhere. The convention lets the panel speak to residents with little English, which suits a leaflet printed in six community languages besides English. The same conventions decide what each pictogram includes and what it leaves out, and here the choices are worth reading closely.
Most of the eight pictograms show an object instead of a person. Illness is a heart with a pulse line, medicines are pills, outdoor work is a hard hat, and poverty or homelessness is a house with heat rising inside it. Only three circles hold a human figure. Each object stands for a whole group through one thing associated with it, a kind of synecdoche, and each choice narrows the group. The hard hat pictures a construction worker, so the cyclist, the farm laborer and the delivery rider who also “work or exercise outdoors” disappear from the image while staying in the label. The house with heat inside it shows people with no way to cool their home, but the label adds “or no home”, a group the picture cannot show.
The most discussed pictogram is the stooped figure with a stick, which turns everyone over 65 into one frail body. The chapter on representation reads it as a stereotype carried by a convenient icon. For the infographic as a type, it marks the cost of speed. A pictogram must be recognized in an instant, so it reaches for the most familiar version of a group, and the most familiar version is often a cliché.
Picture statistics
Modern pictograms descend largely from a method developed in Vienna from the 1920s by the philosopher and social scientist Otto Neurath, with the designer Gerd Arntz and Marie Reidemeister, later Marie Neurath. They called it Isotype, the International System of Typographic Picture Education. Its charts showed facts about work, housing, health and population as rows of identical, flat symbols, one symbol for a fixed number of people or things. A larger quantity was shown by more symbols, never by a bigger one, because viewers misjudge the size of a figure drawn twice as tall. A phrase often attributed to Neurath sums up the aim: words divide, pictures unite.
Isotype was designed for workers’ education, so that a person with little schooling could read the statistics that governed their life. The Kelverton panel inherits its flat, black, simplified figures from this tradition but not its counting, because it has no quantities to count. Placed beside an Isotype chart, the panel looks like the vocabulary without the grammar: the same kind of symbol, used to name groups rather than to measure them.
Headline, path and takeaway
An infographic is read in an order its designer proposes, and this one begins with a question:
Who is most at risk in the heat?
Heat can make anyone sick. Some people get sick more easily.Kelverton Health, “Who is most at risk in the heat?”, headline and standfirst
The headline is the largest type on the panel, teal and bold. As a question it sets up the panel as the answer, so the eye goes looking for it in the rows below. The gray sentence beneath, a standfirst, makes the same two moves as the leaflet’s opening: everyone first, then some people more. The graphic does not let a healthy viewer decide that the subject is somebody else. The headline names a topic; it does not yet state the point.
The point arrives at the end of the reading path, which runs from the question through the orange row and the teal row to the box at the foot. The toolkit chapter on images traces that path. What matters for the type is its last stop. Most infographics end on a takeaway line, the one sentence the designer wants remembered, and here it is an instruction:
Know someone on this list? Call them on every very hot day.
Kelverton Health, “Who is most at risk in the heat?”, the call to action
Everything above the box speaks about other people, as “their bodies” and “They”. The box speaks to the viewer directly and turns the whole panel into a list of people to call. The infographic has quietly changed its viewer’s role: a person who began by wondering whether the heat put them at risk ends with a task for someone else. The orange of the box repeats the orange of the first row, closing the path on the color of danger.
The source line
Infographics that use data usually end with a source line, giving where the numbers came from and when, often in the smallest type on the panel. It is the convention that most separates a responsible graphic from a misleading one, because it lets a viewer check. The Kelverton panel has only a signature, “Kelverton Health”. With no numbers to source, its authority rests on the institution named at its foot and on the leaflet around it.
Read once more as a whole, the panel’s words show how much of its argument sits in its smallest choices.
Who is most at risk in the heat?note 1
Heat can make anyonenote 2 sick. Some people get sick more easily.
Heat is harder on their bodiesnote 3
Older people, most of all if living alonenote 4 · Babies and young children · Pregnant women · People with a long-term illness · People taking certain medicines
They are more exposed to heat, or have less helpnote 5
People who work or exercise outdoors · People who live alone or are cut off from othersnote 6 · People with no way to keep cool at home, or no homenote 7
Know someone on this list? Call them on every very hot day.note 8
Kelverton Healthnote 9
Headline as question. The largest type sets the panel up as an answer and sends the eye down to find it.
Standfirst. Everyone first, then some people more: a healthy viewer cannot dismiss the panel as about others.
Classification by cause. The orange bar groups people by what their bodies cannot do; the color marks this group as the more urgent.
A number dropped. The leaflet’s “over 65” becomes “Older people”, and the pictogram of a stooped figure fills the gap the number left.
Social risk. The teal bar groups people by work, housing and isolation, arguing that heat risk is partly made by how people live.
A group added. Isolation gets a circle of its own, which the leaflet’s list folds into its first point.
What the picture cannot show. The label includes people with no home; the house pictogram can show only a home that is too hot.
Takeaway as call to action. The only line in the second person changes the viewer from a person at risk into a helper.
Signature instead of source. With no data to cite, the panel’s authority comes from the service that signs it.
Try it
Suppose the infographic replaced its two bars with a single heading, “People most at risk”, and set all eight circles in one orange row. What would the panel lose?
It would lose its argument. The two bars and two colors say that risk has two causes, the body and the conditions of a life, and that outdoor work, isolation and housing belong beside age and illness. One row would turn the panel back into the leaflet’s list with pictures, and its viewers would be more likely to see heat as a medical problem only. It would also lose the contrast that lets orange mark the more urgent group.
How infographics persuade
An infographic with numbers persuades through choices that look like simple facts. The first is selection: which figures appear at all, from which years, compared with what. The second is scale, the range of an axis and the size of the marks. The third is framing, the headline and colors that tell the viewer what the numbers mean before the numbers are read. The diagram applies these choices to one invented pair of values, with no real data, so that only the drawing changes.


The first drawing shows the difference as it is. The third keeps the same values but starts its axis just below A, so the bar for B appears far taller than the bar for A. Nothing in it is false, since every value could be read correctly off a labeled axis, yet the picture says something the numbers do not. The middle drawing, in the Isotype manner, removes the problem by making the viewer count: B has one more figure than A, and no trick of scale can make one figure look like twenty.
Older graphics show that persuasion by data is not new. Florence Nightingale’s “Diagram of the Causes of Mortality in the Army in the East” (1858) draws each month of the Crimean War as a wedge of a circle, its area standing for that month’s deaths. Its legend, in flowing engraved script, explains the colors:
The blue wedges measured from the centre of the circle represent area for area the deaths from Preventible or Mitigable Zymotic diseases; the red wedges measured from the centre the deaths from wounds; & the black wedges measured from the centre the deaths from all other causes.
Florence Nightingale, “Diagram of the Causes of Mortality in the Army in the East”, 1858, legend
Across the diagram’s two circles, one for each year of the war, the blue wedges for deaths from preventable disease dwarf the red wedges for deaths from wounds. Nightingale used it to argue for sanitary reform in the army’s hospitals, and she chose a form that made the argument impossible to miss. Its weakness as a chart is the same as its strength as a text. Areas are hard to compare by eye, so exact differences between months are hard to read, while the dominance of the blue wedges is clear at once.
 YouTube
Decoration or distraction?
Critics of information design disagree about what a graphic should contain besides its data. Edward Tufte, in The Visual Display of Quantitative Information (1983), coined the term chartjunk for decoration that carries no information: pictures behind the bars, heavy grids, shading, three-dimensional effects. He argued that every mark of ink should present data, and that decoration distracts from the numbers or distorts them. In a study presented in 2010, Scott Bateman and colleagues at the University of Saskatchewan tested heavily illustrated charts by the designer Nigel Holmes against plain versions of the same data. Viewers read both kinds equally accurately, and they remembered the illustrated charts better two to three weeks later.
The two positions measure different things. Tufte judges a chart by how exactly it lets a careful viewer read the data; the 2010 study measured what an ordinary viewer remembers. An infographic made for social media is closer to the second case, since its makers want it remembered and shared. The Kelverton panel sits between them. Its pictograms and colored bars are decoration in Tufte’s sense, since they carry no numbers, but they carry the classification that is the panel’s whole point.
Reading data critically
Charles Joseph Minard, a retired French civil engineer, drew this graphic of Napoleon’s invasion of Russia in 1869, more than half a century after the campaign it records.

In words, a broad tan band enters from the left at the river Niemen, labeled 422,000 men, and runs east across a sketch map to Moscow, growing thinner as soldiers die or are left behind. It reaches Moscow at 100,000. A black band then runs back west, beside and below the tan one, and shrinks to a thread; it ends at the Niemen with about 10,000. A line chart along the foot records the freezing temperatures of the retreat in degrees below zero on the Réaumur scale. Thin lines join each temperature to the place on the route where it was recorded.
The legend, in French, explains that the width of each band shows the number of men, one millimeter for every ten thousand. It also names the histories and the army pharmacist’s journal from which the figures come.
Tufte wrote in 1983 that Minard’s map “may well be the best statistical graphic ever drawn”. It is also a lesson in reading data critically. A viewer can check its encoding, since the legend states it, and its sources, since they are named. The legend even explains its two colors:
Le rouge désigne les hommes qui entrent en Russie, le noir ceux qui en sortent.
Charles Joseph Minard, Carte figurative, 1869, legend
The advance, in what the legend calls red, is the band printed here in tan; the retreat is black. The viewer can also ask what it counts and what it leaves out. It counts the soldiers of one army; the Russian soldiers and civilians who died do not appear in it. Its source line is a list of French histories written by participants and historians of the campaign. Every infographic invites the same questions: who counted, what counts as one, which years and places, and what has no column at all.
A graphic can persuade without any numbers on it at all. In 2018 the climate scientist Ed Hawkins, of the University of Reading, published his warming stripes. They are a row of vertical bands, one for each year, colored from deep blue for the coolest years to deep red for the warmest. The image has no axis, no labels and no figures, and a viewer reads its meaning in a second, from the blues on the left to the reds on the right. It spread far beyond science because it could be printed on almost anything. Its power comes from leaving out exactly what a scientist’s chart puts in, so a viewer who wants to know the scale has to go to the data behind it.
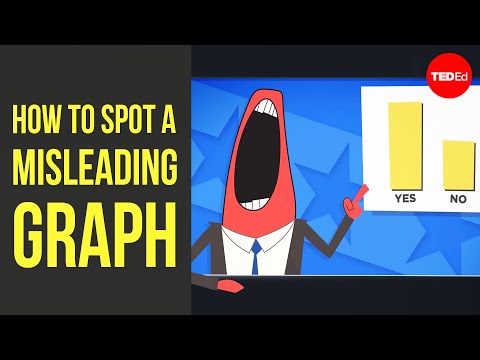 YouTube
Screens, dashboards and change
The infographic has moved from the printed page to the screen, and its forms have multiplied. A static infographic is a single image, like the Kelverton panel. An interactive one lets the viewer choose what to see, hovering over a country or dragging a slider across years. An animated one changes in front of the viewer, as bars race past each other or a map fills with color. A dashboard, a screen of charts updated as new data arrive, became familiar to millions during the COVID-19 pandemic in 2020, when governments and universities published daily counts of cases. Each form shifts power between maker and viewer: the static graphic chooses the comparison, while the interactive one lets the viewer choose, within limits set by its makers.
The history of the type is a history of people using pictures of data to argue. Nightingale drew her wedges to change army hospitals. W. E. B. Du Bois and his team at Atlanta University drew colored charts of Black American life for the Paris Exposition of 1900, answering caricature with self-presentation, as the chapter on representation explains. Neurath’s Isotype aimed to give workers the statistics of their own lives. Newspapers built graphics desks in the late twentieth century, and social media now carries infographics made by charities, companies and individuals in the same feed. The means have changed far more than the questions to ask of them.
Writing about an infographic
A paragraph about an infographic describes what its visual choices do with the information, then says what that suggests about its purpose and audience. The paragraph that follows, as a strong student might write it, is about the Kelverton panel’s two colored rows.
Kelverton Health’s infographic turns a list of people at risk into an argument about why they are at risk.note 1 Its two bars sort the same people by cause, “Heat is harder on their bodies” in orange and “They are more exposed to heat, or have less help” in teal, so outdoor work, isolation and housing stand beside age and illness as reasons for danger.note 2 Placing the orange row first and repeating its color in the closing box marks bodily risk as the more urgent, while the single orange heat waves inside the teal row’s house tie poverty back to that danger.note 3 For residents who may only glance at the panel, color makes the argument before a label is read: heat is a medical problem and a social one.note 4
A claim about the text’s work. The topic sentence says what the infographic does to its information, not what it shows.
Evidence quoted and described. Both bar labels are quoted and their colors named, so the claim rests on the panel itself.
Encoding analyzed. Position and the repetition of color are explained as choices with effects, including one small detail.
Audience. The paragraph ends on the viewers the panel is designed for and the reading they will make.
The same habit of linking a visual choice to an effect separates a weak and a strong sentence about the pictograms.
Weak: The infographic uses icons to make it more visually appealing and easier to understand.note 1
Strong: By drawing outdoor workers as a hard hat under the sun, the infographic makes the group instantly recognizable but narrows it to builders, leaving out the cyclists and delivery riders its label also includes.note 2
A formula. “Visually appealing” and “easier to understand” could describe any icon in any graphic; the sentence names none.
Choice, gain and cost. The sentence names one pictogram, says what it achieves and what it leaves out, which is evaluation as well as analysis.
The strong sentence weighs a choice instead of praising it. Infographics simplify by design, so the most useful sentence about one often says what a simplification gains and what it costs.
Applying it in Paper 1
An infographic in Paper 1 is often set beside or inside another text, a leaflet, a report or a web page, and its words are few. A guiding question on one is likely to direct attention to how its visual choices present information to a particular audience, how it persuades, or how its images and words work together. A model sentence of analysis follows. By splitting the people at risk into an orange row for bodies and a teal row for living conditions, the infographic argues without a single number that housing and work shape heat danger as much as age.
The commonest way to lose marks is to report the information instead of analyzing its presentation: listing who is at risk, or what a chart’s numbers are, says what the graphic shows rather than how. Another is to treat the visual elements as neutral. A response that describes the encoding precisely, reads two or three choices (grouping, color, pictograms, scale, the takeaway line) as decisions with effects, and notes what is left out, is analyzing the text.
Its conventions in brief
A headline, often a question or a claim, and a short standfirst.
Information grouped and ordered so that the grouping itself makes a point.
Visual encoding by color, position and size, with or without numbers.
Pictograms and icons that name groups or count quantities.
A reading path from headline to a takeaway line or call to action.
Few words, in the shortest units the content allows.
A source line for any data, and a signature or logo for its maker.
Charts within the panel when there are quantities to compare.
The infographic leads to the report, whose tables and charts it often condenses, and to the global issue of science, technology and the environment, where graphics such as the warming stripes carry public arguments. The diagram, which explains how something works rather than presenting facts about a population, is its closest neighbor among the text types.
Self-check
- To do:
I can explain what infographics are for and distinguish an infographic from a chart and from a diagram.
- To do:
I can analyze grouping, color, position and size as encoding, and judge whether the encoding is honest.
- To do:
I can explain how pictograms work, what they include and leave out, and how Isotype used them to count.
- To do:
I can analyze an infographic’s headline, reading path, takeaway line and source line.
- To do:
I can evaluate how infographics persuade through selection, scale and decoration, with reference to the debate over chartjunk.
- To do:
I can read data critically by asking who counted, what was counted and what was left out.
- To do:
I can write a paragraph that links an infographic’s visual choices to its purpose and audience.
Key terms
Each is also in the Non-literary text types glossary for IB English A Lang & Lit, beside the other terms of its topic.
- Chartjunk
Decoration in a chart or infographic that carries no data, such as pictures, heavy grids, shading or three-dimensional effects. The term is used to argue that such decoration distracts from or distorts the information.
- Data visualization
The display of quantities as visual marks, such as bars, lines, areas, positions or colors, so that sizes, changes and comparisons can be seen. Each choice of mark and scale decides which differences look large and which look small.
- Infographic
A single designed panel that presents information or data through images, icons, charts and short text, so that a viewer can grasp it quickly. It usually has a headline, a clear reading path and a main point it wants remembered.
- Isotype
A method of showing statistics with rows of identical simple pictograms, developed in Vienna from the 1920s, in which a larger quantity is shown by more symbols rather than by a bigger one. It aimed to make social facts readable by anyone, whatever their language.
- Pictogram
A simplified picture that stands for a thing, a group of people or an idea and can be recognized without words. In data graphics, rows of identical pictograms can also stand for quantities.
Practice questions on 6.11 Infographic
Augment’s own questions, written in the style of IB exam papers. Here is how a few of them start.


Practice all 8 questions on 6.11 Infographic
Free with an account. Write your answer, open the markscheme beside it and mark yourself. Augment keeps the ones you got wrong for another go.
More in 6 Non-literary text types
The whole topic is on its own page.
- 6.1Advertisement
- 6.2Appeal
- 6.3Blog
- 6.4Brochure or leaflet
- 6.5Cartoon
- 6.6Diagram
- 6.7Electronic text
- 6.8Encyclopaedia entry
- 6.9Film and television
- 6.10Guide book
- 6.11InfographicThis page
- 6.12Interview
- 6.13Music video
- 6.14Photograph
- 6.15Radio broadcast
- 6.16Report
- 6.17Screenplay for TV or film
- 6.18Set of instructions
- 6.19Textbook
- 6.20Work of art
- 6.21Autobiography or biography
- 6.22Diary entry
- 6.23Essay
- 6.24Letter
- 6.25Magazine article
- 6.26Manifesto
- 6.27Memoir
- 6.28Opinion column
- 6.29Parody
- 6.30Pastiche
- 6.31Speech
- 6.32Travelogue
Carry on with 6.11 Infographic in Augment
With a free account, Augment remembers where you stopped in the notes and which questions you have marked.