D4.3 Climate change questions for IB Biology
38 questions on Climate change, written by Augment in the style of IB exam papers. Six of them are below in full, to answer on paper.
- IB Biology
- Part of D Continuity and change
- SL and HL
Questions by paper and level
SL and HL questions are for students at either level. HL only questions cover what only HL students study.
| Paper | SL and HL | HL only | All |
|---|---|---|---|
| Paper 1A | 12 | 8 | 20 |
| Paper 1B | 4 | 1 | 5 |
| Paper 2 | 10 | 3 | 13 |
| Every paper | 26 | 12 | 38 |
Counted on
Questions to try
Written by Augment in the style of IB exams, not past papers. Answer them on paper, then check each one against its markscheme with a free account.
Which row identifies a human activity that increases the atmospheric concentration of each greenhouse gas?
Row | Carbon dioxide | Methane |
|---|---|---|
A | Planting forests on grassland | Burning coal in power stations |
B | Burning fossil fuels | Raising cattle and other ruminant livestock |
C | Growing rice in flooded paddy fields | Planting trees on cleared land |
D | Using fertilizers containing nitrates | Drying out and draining peat bogs |
Researchers investigated the effect of carbon dioxide concentration in seawater on the growth of a reef-building coral, Acropora sp. Eight fragments of similar mass, all cut from one colony, were placed in each of four aquaria. Air containing different concentrations of carbon dioxide was bubbled through the seawater, which was kept at 26 °C. The rate of calcification (deposition of calcium carbonate skeleton) was found by weighing each fragment at the start and after six weeks.
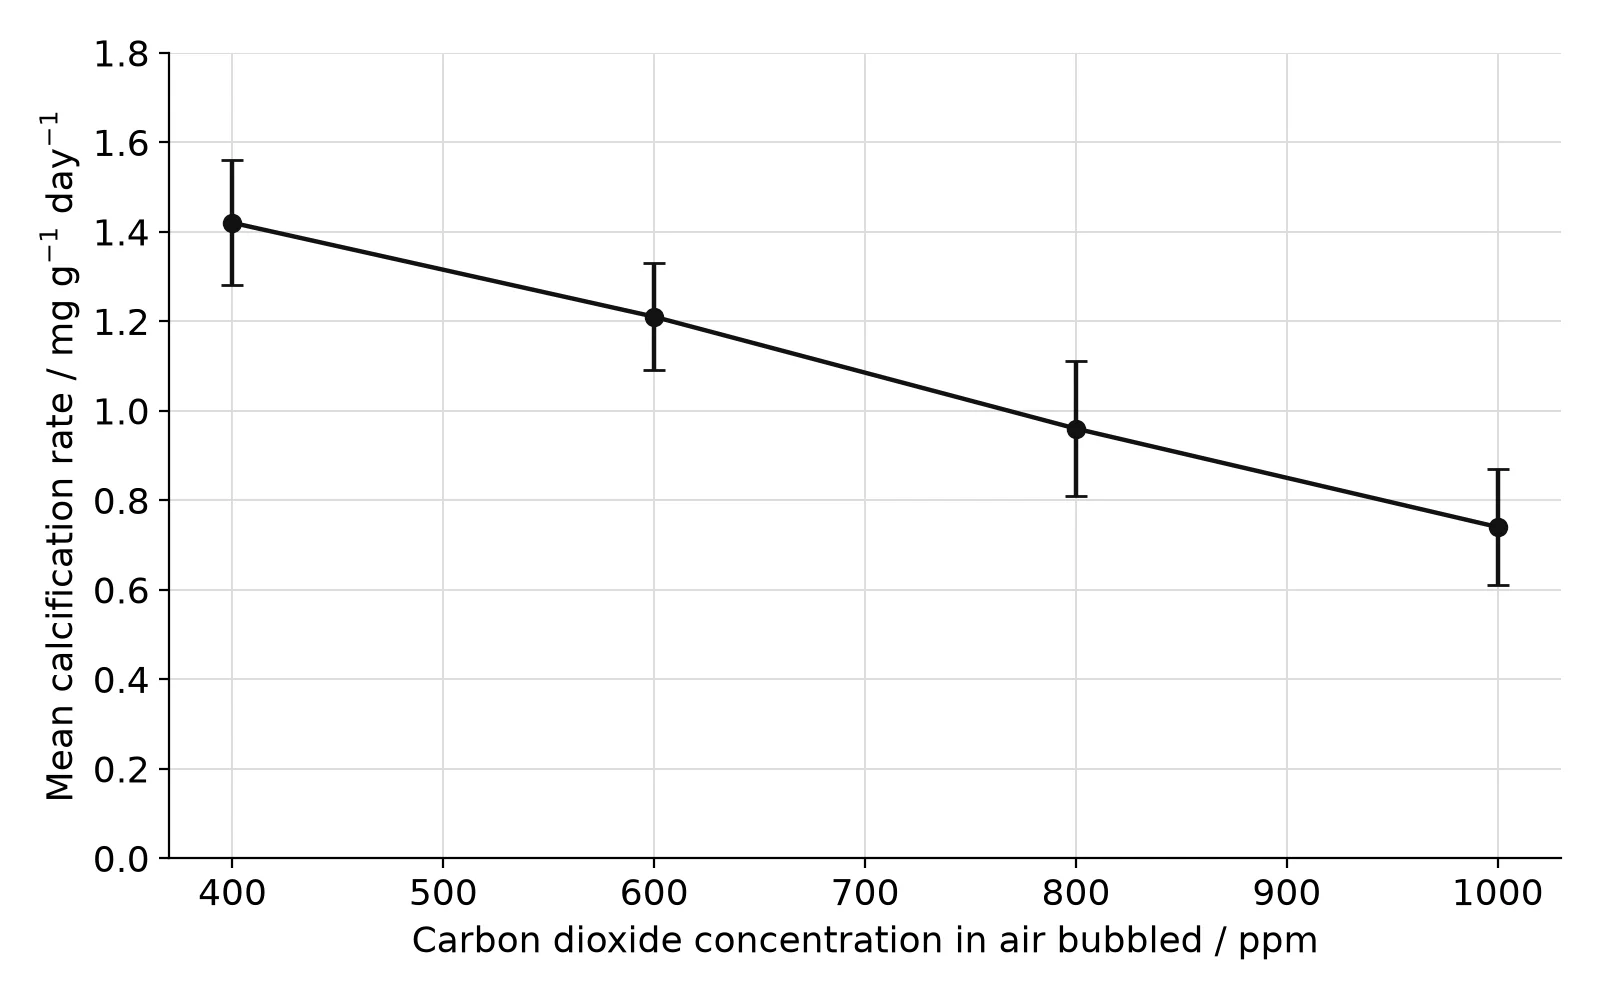
The mean pH of the seawater was 8.10, 7.95, 7.82 and 7.72 in the 400, 600, 800 and 1000 ppm treatments respectively.
- (a)
State the independent variable in this investigation.
1 mark
- (b)
Calculate the percentage change in mean calcification rate between 400 ppm and 1000 ppm carbon dioxide.
1 mark
- (c)
Explain why the seawater in all the aquaria was kept at the same temperature.
2 marks
- (d)
Using the error bars, discuss whether there is a significant difference between the calcification rates at 400 ppm and 600 ppm carbon dioxide.
2 marks
- (e)
Explain how rising concentrations of carbon dioxide in the atmosphere could lead to the effect shown by these results in coral reefs.
3 marks
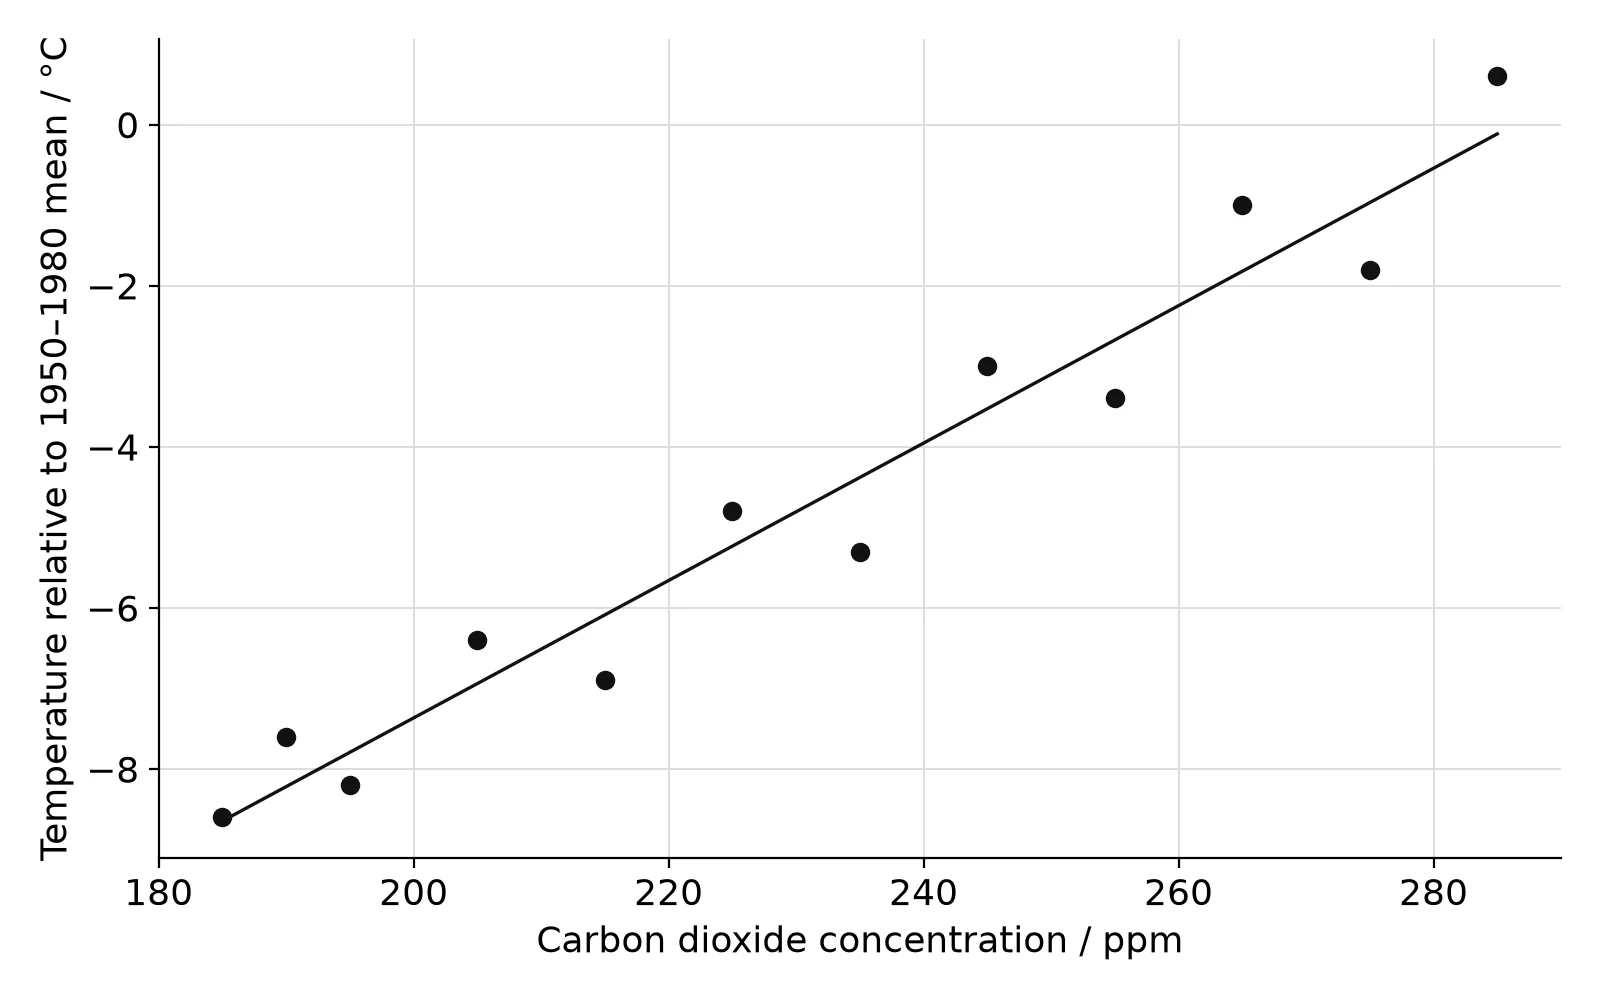
Bubbles of air trapped in Antarctic ice preserve samples of the atmosphere from the time the snow fell. The graph shows the carbon dioxide concentration in air bubbles from twelve samples of an ice core, plotted against the temperature in Antarctica at the time, estimated from the same ice, relative to the mean for 1950–1980.
- (a)
State the type of correlation shown by the data.
1 mark
- (b)
Distinguish between correlation and causation, using these data as an example.
2 marks
- (c)
Outline how human activities have increased the atmospheric concentrations of carbon dioxide and methane.
3 marks
- (d)
Explain how increases in the concentrations of these gases in the atmosphere cause global warming.
3 marks
Air bubbles trapped in Antarctic ice cores show that, over several hundred thousand years, periods with high atmospheric carbon dioxide concentration were also periods with high global temperature. What can be concluded from these ice core data alone?
Cores of peat were taken from a bog and incubated in sealed jars in the dark for 14 days. Half the jars were kept waterlogged, with water up to the surface of the peat; the other half were drained. Jars were kept at 5 °C, 15 °C or 25 °C, with five jars for each treatment. The rates of release of carbon as carbon dioxide and as methane were measured.
Temperature / °C | Drained: CO2 / µg C g-1 day-1 | Drained: CH4 / µg C g-1 day-1 | Waterlogged: CO2 / µg C g-1 day-1 | Waterlogged: CH4 / µg C g-1 day-1 |
|---|---|---|---|---|
5 | 18 | 0.0 | 6 | 0.4 |
15 | 41 | 0.1 | 12 | 1.1 |
25 | 87 | 0.1 | 21 | 2.9 |
- (a)
State one variable, other than temperature, that should have been kept the same for all the jars.
1 mark
- (b)
Calculate the percentage increase in the rate of release of carbon as carbon dioxide from drained peat between 5 °C and 25 °C.
1 mark
- (c)
Compare the release of carbon dioxide and methane from drained and waterlogged peat.
2 marks
- (d)
Explain why methane is released from waterlogged peat but not from drained peat.
2 marks
- (e)
Restoring drained peatlands by raising the water table has been proposed as a way of sequestering carbon. Discuss, using the data, whether rewetting peat would reduce the release of greenhouse gases.
3 marks
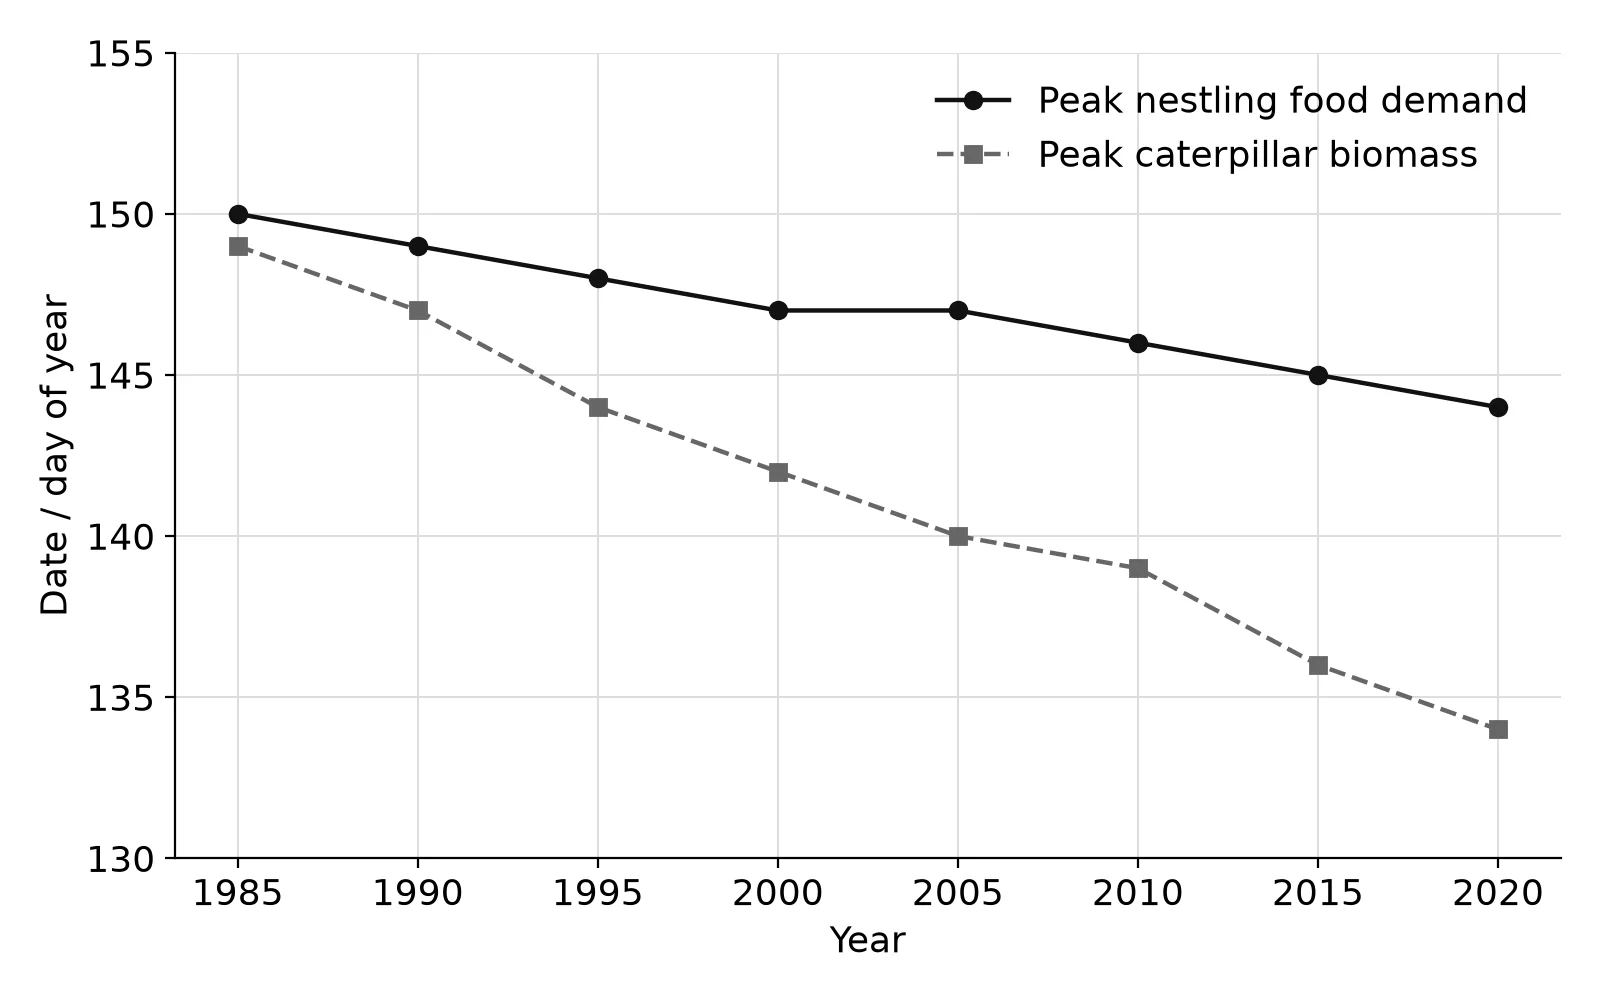
In a north European oak forest, the mean date on which great tits (Parus major) laid their first egg and the date of peak biomass of the caterpillars that their nestlings eat were recorded from 1985 to 2020. The nestlings' food demand peaks about 35 days after the first egg is laid. The graph shows the date of peak nestling food demand and the date of peak caterpillar biomass. Day 140 is 20 May.
- (a)
Calculate the number of days by which peak nestling food demand lagged behind peak caterpillar biomass in 2020.
1 mark
- (b)
Compare the changes in the two dates between 1985 and 2020.
2 marks
- (c)
Explain why the timing of these two events has changed by different amounts.
3 marks
- (d)
Predict the consequences of this change for the great tit population.
2 marks
- (e)
Suggest how natural selection could reduce the mismatch over many generations.
2 marks
Practice all 38 in Augment
Free with an account. Every question has its markscheme, and Augment keeps the ones you got wrong so you can come back to them.
More questions in Continuity and change
- D1.1DNA replication
- D1.2Protein synthesis
- D1.3Mutations and gene editing
- D2.1Cell and nuclear division
- D2.2Gene expressionHL only
- D2.3Water potential
- D3.1Reproduction
- D3.2Inheritance
- D3.3Homeostasis
- D4.1Natural selection
- D4.2Stability and change
- D4.3Climate changeThis page
Check your answers in Augment
A free account opens all 38 questions on Climate change with their markschemes, and keeps a record of what you have marked.