D2.3 Water potential questions for IB Biology
36 questions on Water potential, written by Augment in the style of IB exam papers. Six of them are below in full, to answer on paper.
- IB Biology
- Part of D Continuity and change
- SL and HL
Questions by paper and level
SL and HL questions are for students at either level. HL only questions cover what only HL students study.
| Paper | SL and HL | HL only | All |
|---|---|---|---|
| Paper 1A | 13 | 7 | 20 |
| Paper 1B | 3 | 2 | 5 |
| Paper 2 | 7 | 4 | 11 |
| Every paper | 23 | 13 | 36 |
Counted on
Questions to try
Written by Augment in the style of IB exams, not past papers. Answer them on paper, then check each one against its markscheme with a free account.
Which row describes the attractions that form between water molecules and the ions when solid sodium chloride dissolves in water?
Row | Na+ ions are attracted to | Cl− ions are attracted to |
|---|---|---|
A | hydrogen atoms (δ+) of water molecules | oxygen atoms (δ−) of water molecules |
B | hydrogen atoms (δ−) of water molecules | oxygen atoms (δ+) of water molecules |
C | oxygen atoms (δ−) of water molecules | hydrogen atoms (δ+) of water molecules |
D | oxygen atoms (δ−) of water molecules | oxygen atoms (δ−) of water molecules |
Students investigated osmosis in sweet potato (Ipomoea batatas) tissue. Cylinders 40 mm long and 8 mm in diameter were cut with a cork borer, blotted, weighed and measured, and then placed in sucrose solutions of six concentrations at 20 °C. After 24 hours each cylinder was blotted and weighed and its length measured again. Five cylinders were used for each concentration. The table shows the mean percentage changes in mass and in length, with standard deviations (SD).
Sucrose concentration / mol dm-3 | Mean change in mass / % | SD of mass change / % | Mean change in length / % | SD of length change / % |
|---|---|---|---|---|
0.0 | +14.6 | 1.2 | +4.8 | 1.5 |
0.2 | +7.9 | 0.9 | +2.6 | 1.3 |
0.4 | +1.2 | 0.8 | +0.4 | 1.2 |
0.6 | −5.8 | 1.0 | −1.9 | 1.4 |
0.8 | −11.3 | 1.1 | −3.7 | 1.3 |
1.0 | −15.0 | 1.3 | −4.9 | 1.5 |
- (a)
State the independent variable in this investigation.
1 mark
- (b)
Suggest why the results were expressed as percentage changes rather than as changes in mass and length.
1 mark
- (c)
Using the mass data, estimate the concentration of sucrose solution that is isotonic with the sweet potato tissue. Explain how you made your estimate.
2 marks
- (d)
Using the standard deviations, compare the reliability of the mass measurements and the length measurements.
2 marks
- (e)
Explain the change in mass of the cylinders in 0.0 mol dm-3 sucrose solution.
3 marks
Many of the substances needed by cells are transported and react in aqueous solution.
- (a)
Draw a labelled diagram to show how water molecules are arranged around a sodium ion (Na+) in solution.
2 marks
- (b)
Outline how glucose dissolves in water.
2 marks
- (c)
Outline how the solvent properties of water allow substances to be transported in blood plasma.
2 marks
A cell is placed in a solution that has a higher solute concentration than its cytoplasm. Which term describes the solution, and what is the net movement of water?
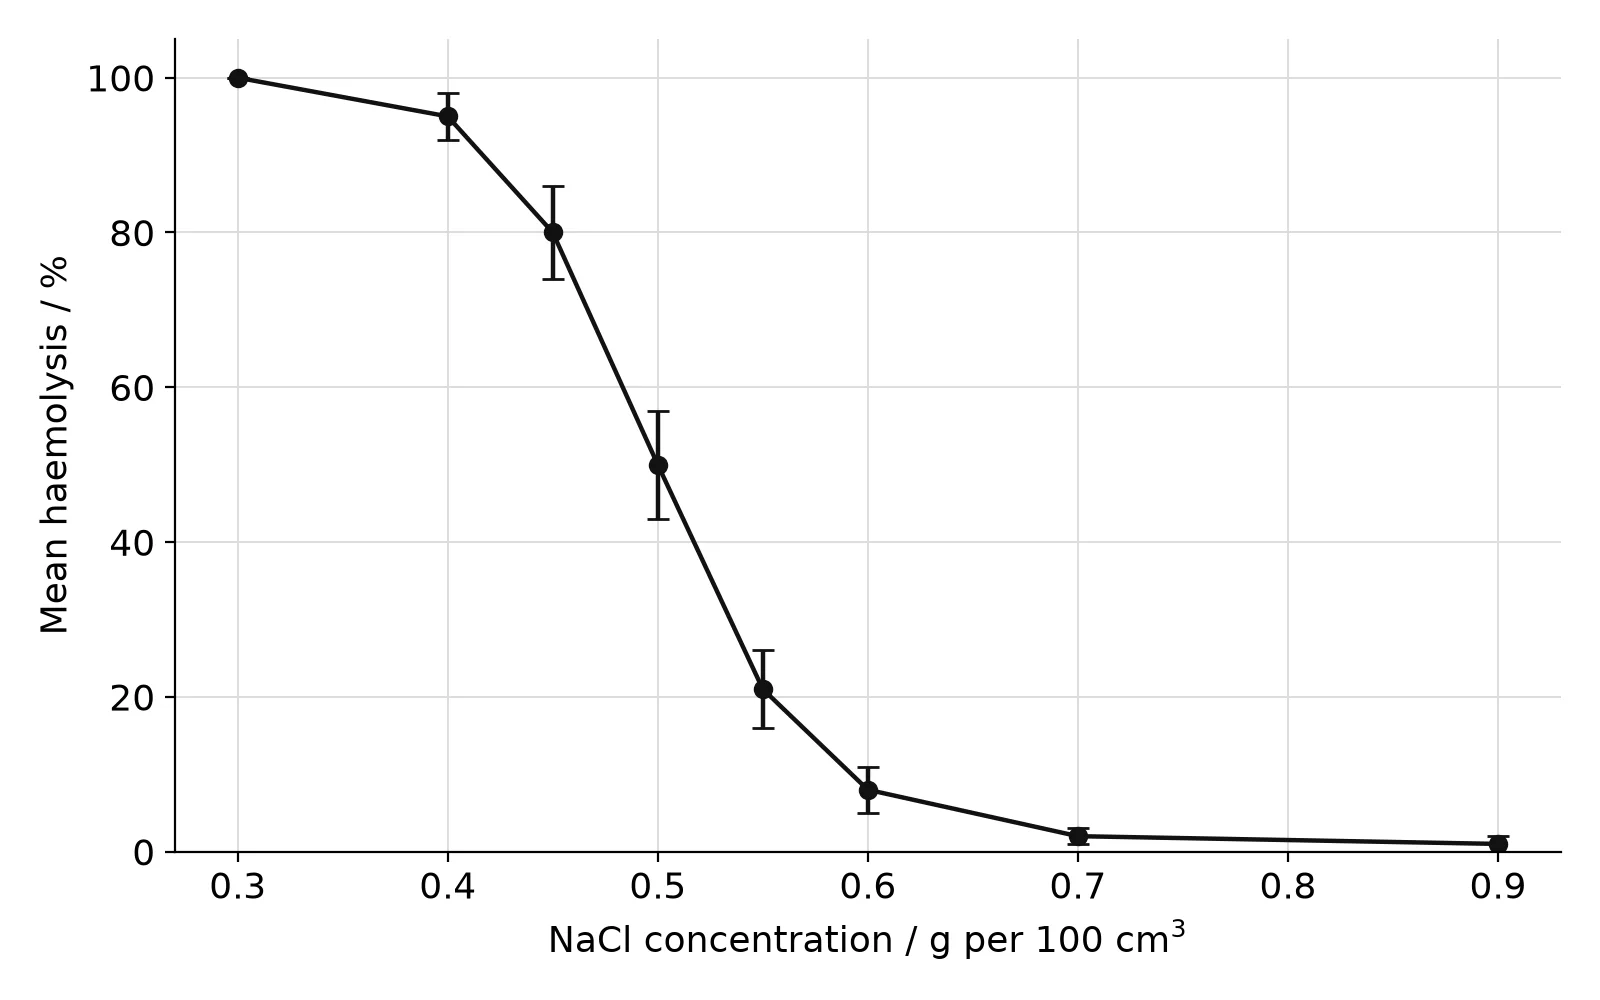
Sheep (Ovis aries) red blood cells were washed and suspended in sodium chloride (NaCl) solutions of different concentrations. After 30 minutes the tubes were centrifuged so that intact cells formed a pellet, and the absorbance of the liquid above the pellet, caused by haemoglobin released from burst cells, was measured with a colorimeter. A tube of red blood cells in distilled water was used to represent 100 % haemolysis (bursting of red blood cells). Each concentration was tested three times. The graph shows the mean percentage haemolysis; error bars show ±1 standard deviation.
- (a)
Identify the concentration of NaCl at which half of the red blood cells haemolysed.
1 mark
- (b)
Explain why a tube of red blood cells in distilled water was included.
2 marks
- (c)
Describe the effect of NaCl concentration on haemolysis.
2 marks
- (d)
Explain why red blood cells haemolyse in solutions with a low NaCl concentration.
3 marks
- (e)
A solution of 0.9 g per 100 cm3 NaCl is used as an intravenous fluid. Using the data, explain why this concentration is suitable.
2 marks
The direction in which water moves between solutions depends on their solute concentrations.
- (a)
Distinguish between a hypertonic solution and a hypotonic solution.
2 marks
- (b)
State the term used for two solutions that have the same solute concentration.
1 mark
- (c)
Predict the direction of net movement of water when an animal cell is placed in a hypertonic solution and when it is placed in a hypotonic solution.
2 marks
- (d)
Explain why the situation of a cell in an isotonic solution is described as a dynamic equilibrium.
2 marks
Practice all 36 in Augment
Free with an account. Every question has its markscheme, and Augment keeps the ones you got wrong so you can come back to them.
More questions in Continuity and change
- D1.1DNA replication
- D1.2Protein synthesis
- D1.3Mutations and gene editing
- D2.1Cell and nuclear division
- D2.2Gene expressionHL only
- D2.3Water potentialThis page
- D3.1Reproduction
- D3.2Inheritance
- D3.3Homeostasis
- D4.1Natural selection
- D4.2Stability and change
- D4.3Climate change
Check your answers in Augment
A free account opens all 36 questions on Water potential with their markschemes, and keeps a record of what you have marked.