D3.3 Homeostasis questions for IB Biology
46 questions on Homeostasis, written by Augment in the style of IB exam papers. Six of them are below in full, to answer on paper.
- IB Biology
- Part of D Continuity and change
- SL and HL
Questions by paper and level
SL and HL questions are for students at either level. HL only questions cover what only HL students study.
| Paper | SL and HL | HL only | All |
|---|---|---|---|
| Paper 1A | 10 | 10 | 20 |
| Paper 1B | 3 | 2 | 5 |
| Paper 2 | 8 | 13 | 21 |
| Every paper | 21 | 25 | 46 |
Counted on
Questions to try
Written by Augment in the style of IB exams, not past papers. Answer them on paper, then check each one against its markscheme with a free account.
Which list contains only variables that are kept within narrow limits by homeostasis in humans?
Eight students investigated thermoregulation during exercise. Each student cycled on an exercise bicycle at a constant power output for 30 minutes in a laboratory kept at 22 °C. Core body temperature was measured with an ear (tympanic) thermometer and skin temperature with a probe taped to the forehead, every 5 minutes. Each student was weighed, wearing the same dry clothing, immediately before and after the exercise, and drank nothing during the investigation. The graph shows the mean temperatures.
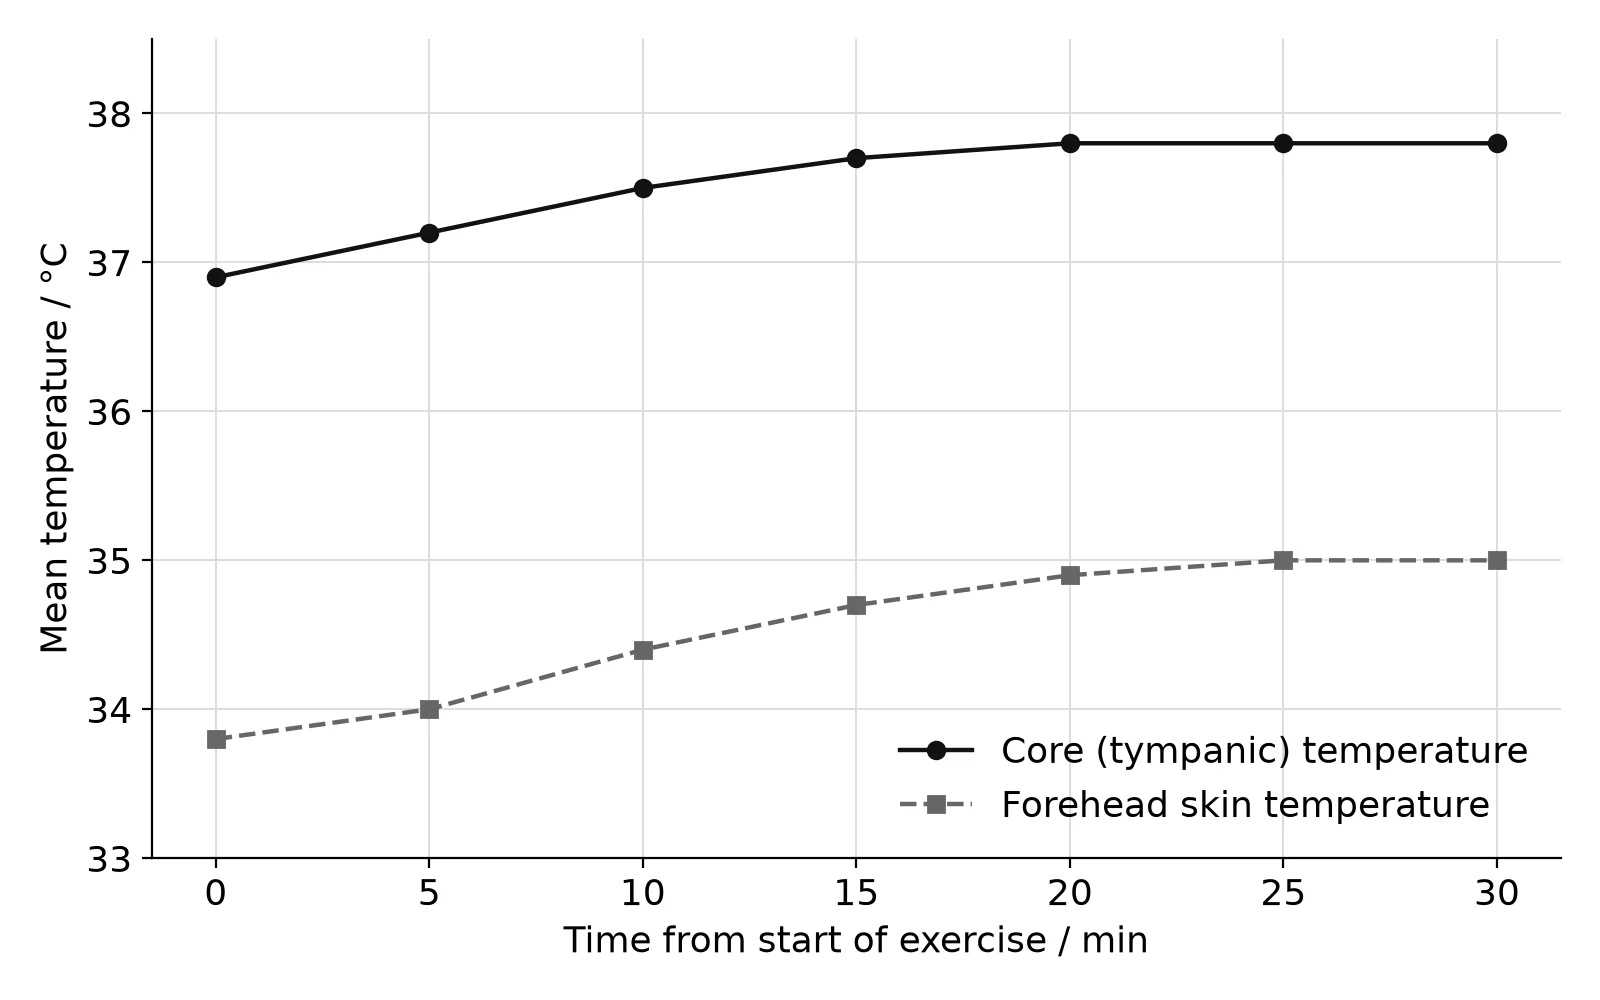
The mean body mass of the students was 64.20 kg before exercise and 63.62 kg after exercise.
- (a)
State one variable, other than air temperature, that was kept constant in this investigation.
1 mark
- (b)
Calculate the percentage decrease in mean body mass during the exercise.
1 mark
- (c)
Describe the changes in mean core temperature during the 30 minutes of exercise.
2 marks
- (d)
Explain how the changes in skin temperature and body mass are evidence of mechanisms that prevented core temperature from rising further.
3 marks
- (e)
Evaluate the use of the change in body mass as a measure of the volume of sweat produced.
2 marks
- (f)
Suggest one improvement to this investigation.
1 mark
Organisms must control the rates of the chemical reactions in their cells and bodies.
- (a)
Describe the control of blood glucose concentration by hormones.
4 marks
- (b)
Compare and contrast competitive and non-competitive inhibition of enzymes.
7 marks
- (c)
Explain why a large number of different enzymes is needed to carry out and control metabolism.
4 marks
Which row identifies the pancreatic cells that secrete glucagon and the effect of glucagon on liver cells?
Row | Cells secreting glucagon | Effect on liver cells |
|---|---|---|
A | α cells | stimulates conversion of glucose to glycogen |
B | β cells | stimulates conversion of glycogen to glucose |
C | α cells | stimulates conversion of glycogen to glucose |
D | β cells | stimulates conversion of glucose to glycogen |
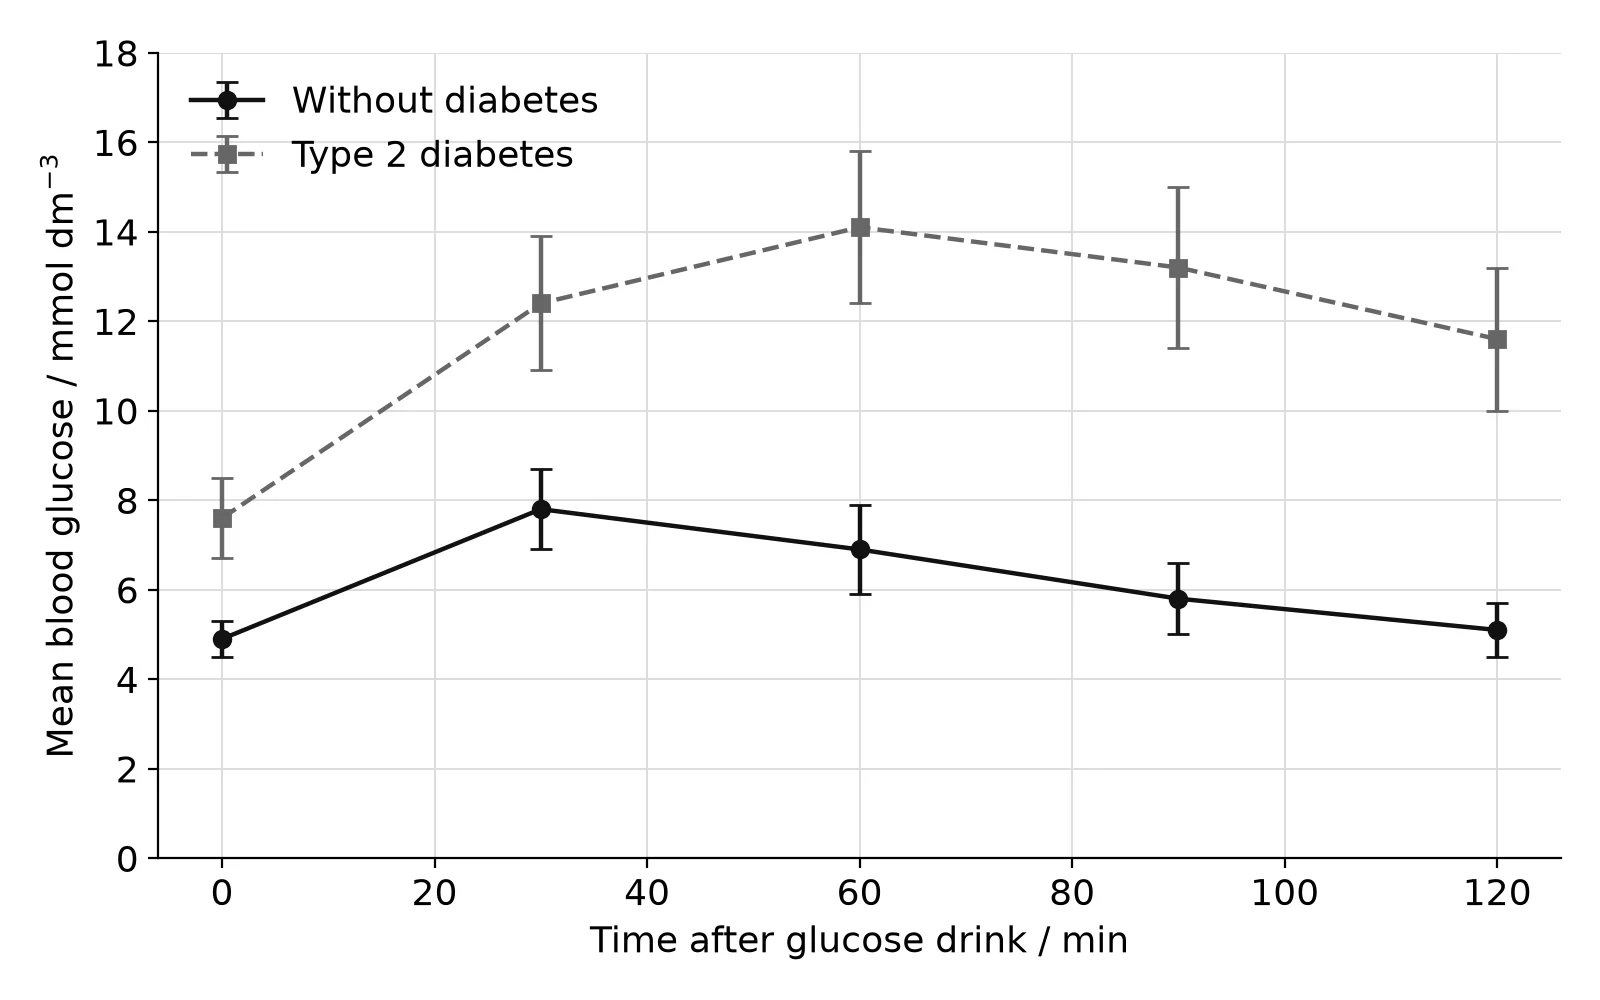
In a glucose tolerance test, 12 adults without diabetes and 12 adults with type 2 diabetes fasted for 10 hours. Each then drank a solution containing 75 g of glucose. Blood glucose concentration was measured immediately before the drink (0 min) and every 30 minutes for 2 hours. The graph shows the mean values; error bars show ± one standard deviation.
- (a)
Suggest why the participants fasted before the test.
1 mark
- (b)
Calculate the percentage increase in mean blood glucose concentration between 0 and 30 minutes for the adults without diabetes.
2 marks
- (c)
Compare and contrast the changes in blood glucose concentration in the two groups after the glucose drink.
2 marks
- (d)
Using the error bars, discuss whether the difference between the two groups at 0 minutes is likely to be significant.
2 marks
- (e)
Explain the differences between the two groups from 60 to 120 minutes.
3 marks
Living organisms release energy from food and use it in many ways.
- (a)
Outline the role of ATP in cells.
4 marks
- (b)
Explain how heat is produced by metabolism and how it is used to maintain a constant body temperature in humans.
7 marks
- (c)
Distinguish between linear and cyclical pathways in metabolism, using named examples.
4 marks
Practice all 46 in Augment
Free with an account. Every question has its markscheme, and Augment keeps the ones you got wrong so you can come back to them.
More questions in Continuity and change
- D1.1DNA replication
- D1.2Protein synthesis
- D1.3Mutations and gene editing
- D2.1Cell and nuclear division
- D2.2Gene expressionHL only
- D2.3Water potential
- D3.1Reproduction
- D3.2Inheritance
- D3.3HomeostasisThis page
- D4.1Natural selection
- D4.2Stability and change
- D4.3Climate change
Check your answers in Augment
A free account opens all 46 questions on Homeostasis with their markschemes, and keeps a record of what you have marked.