Explain the causes of climate change and its positive feedbacks, and how it affects polar habitats, oceans, species ranges, coral reefs and the timing of life cycles.
Each is in the Biology glossary, with every other term in the subject.
Establishing a forest, usually by planting trees, on land that has not been forested in recent times.
The proportion of incoming solar radiation reflected by a surface; snow and ice have a high albedo, while open ocean, forest and bare soil have a low albedo.
The capture of carbon dioxide from the atmosphere and its long-term storage, for example in the biomass and soil of forests or in peat.
A long-term change in the average weather patterns of a region or of the whole Earth, including temperature, rainfall and extreme events; current climate change is caused mainly by human greenhouse gas emissions.
The loss of colour in corals caused by expulsion of their symbiotic zooxanthellae, usually in response to high water temperature; prolonged bleaching leads to starvation and death of the coral.
The increase in the greenhouse effect caused by human activities that raise atmospheric concentrations of greenhouse gases such as carbon dioxide and methane, resulting in global warming.
The warming of the Earth's surface and lower atmosphere because greenhouse gases absorb long-wave infrared radiation emitted by the surface and re-emit some of it back towards the surface.
Climate change is the long-term change in the Earth's climate caused mainly by human emissions of carbon dioxide and methane. It affects living things at every level of organisation, from the timing of an individual bird's breeding to the survival of whole ecosystems such as coral reefs and boreal forests.
Its causes are explained by the carbon cycle and the physics of radiation. Its effects depend on the ranges of tolerance of organisms, the interactions between species and the capacity of populations to move and to evolve.
38 exam-style questions on this subtopic, written in the style of the IB papers. The first has its markscheme open. Counted on
Which row identifies a human activity that increases the atmospheric concentration of each greenhouse gas?
Row | Carbon dioxide | Methane |
|---|---|---|
A | Planting forests on grassland | Burning coal in power stations |
B | Burning fossil fuels | Raising cattle and other ruminant livestock |
C | Growing rice in flooded paddy fields | Planting trees on cleared land |
D | Using fertilizers containing nitrates | Drying out and draining peat bogs |
The official deck for this part of the syllabus.
What is climate change?
Global warming is one part of climate change. State the five other changes that climate change includes.
With a free account, Augment remembers where you stopped and what you have practiced.
A cylinder of ice drilled from an ice sheet or glacier, containing trapped bubbles of ancient air and other evidence from which past atmospheric gas concentrations and temperatures are measured.
Sea ice that is attached to the coast, the sea floor in shallow water or an ice shelf, so that it does not drift with winds and currents.
Carbon that has accumulated in the soil and biomass of an ecosystem over many years, decades or centuries, which can be released rapidly by fire or decomposition.
A greenhouse gas (CH₄) produced by anaerobic decomposition by methanogens, for example in ruminants, rice paddies, wetlands and landfill; per molecule it absorbs infrared radiation far more strongly than CO₂.
The decrease in the pH of seawater caused by absorption of atmospheric carbon dioxide, which forms carbonic acid and reduces the concentration of carbonate ions available for calcification.
Ground, including soil and rock, that has remained frozen for at least two consecutive years; in the Arctic it often contains large stores of undecomposed organic matter.
A loss of synchrony between the timing of life-cycle events in interacting species, such as a consumer's breeding and the peak of its food supply, often because they respond to different cues.
The study of the timing of recurring biological events, such as flowering, budburst, bud set, migration and breeding, and of how they are influenced by variables such as photoperiod and temperature.
The length of the period of light in each 24-hour day, which organisms use as a cue to time seasonal events such as flowering, migration and breeding.
A change in the geographical distribution of a species, for example towards the poles or to higher altitudes, as the area with suitable conditions moves because of climate change.
Re-establishing forest on land from which it was recently cleared, either by planting trees or by allowing natural regeneration from seeds and roots.
Ice that forms when seawater freezes, including drifting pack ice and landfast ice; it is a habitat for breeding, resting and feeding in polar regions.
The rising of cold, dense, nutrient-rich water from the deep ocean to the surface, often driven by winds pushing surface water away from a coast; it supports high primary production.
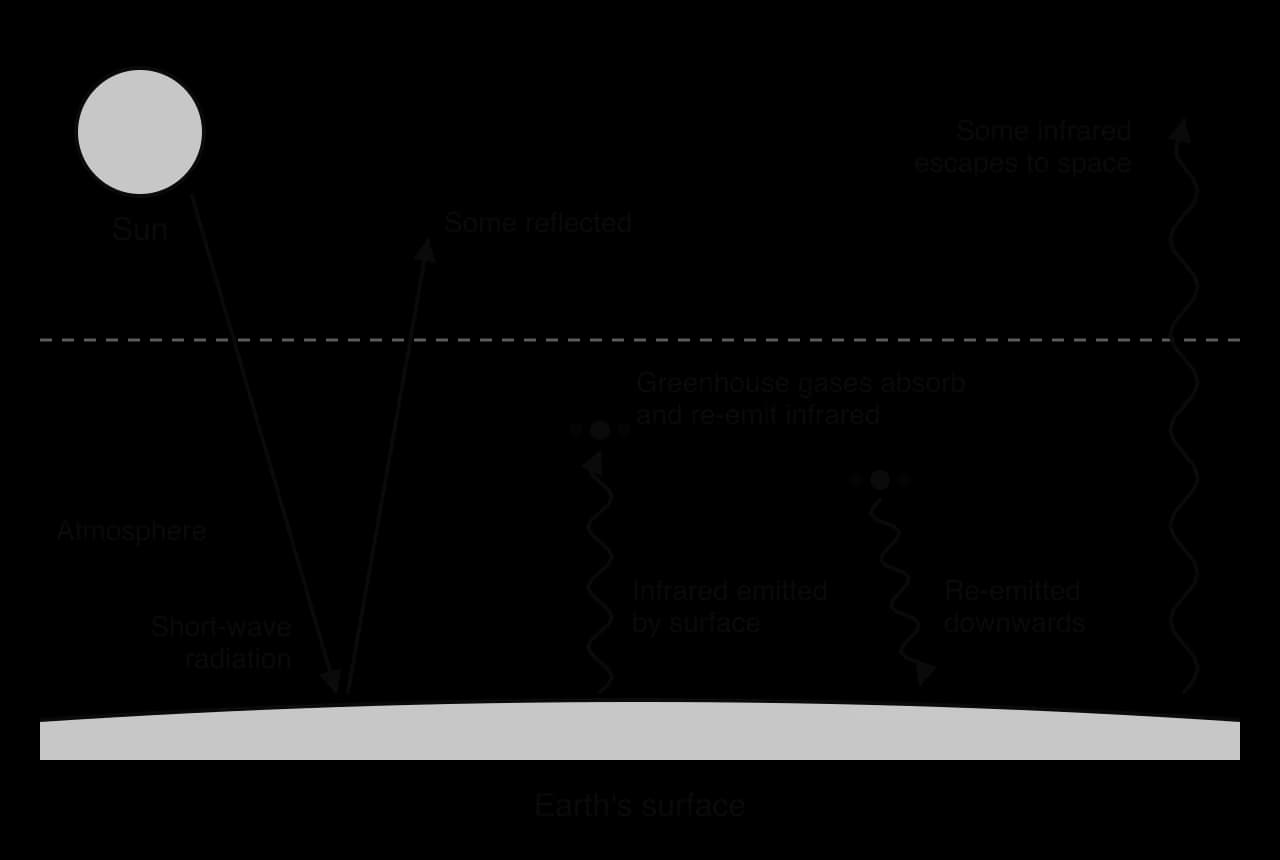
The Earth is warmed by radiation from the Sun. Most solar radiation arrives as short-wave radiation (visible light and some ultraviolet), which passes through the atmosphere easily. Some is reflected by clouds, ice and other pale surfaces, and the rest is absorbed by the land and oceans, which warm up. The warm surface then emits energy as long-wave infrared radiation.
Certain gases in the atmosphere absorb infrared radiation. They then re-emit it in all directions, including back towards the surface, so heat is retained in the lower atmosphere. This is the greenhouse effect, and the gases responsible are greenhouse gases. The most important are water vapour, carbon dioxide (CO₂) and methane (CH₄); nitrous oxide (N₂O) also contributes.
The natural greenhouse effect is essential for life. Without it, the average temperature at the Earth's surface would be about −18 °C instead of about 15 °C, and most water would be frozen. Current global warming is caused by the enhanced greenhouse effect. Since the Industrial Revolution, human activities have raised the concentrations of greenhouse gases, so more infrared radiation is absorbed and re-emitted, and the Earth is warming.
Global warming is one part of climate change, which also includes changes in rainfall, the frequency of droughts, storms and heatwaves, the extent of snow and ice, sea level and ocean chemistry.
Atmospheric CO₂ and methane have both risen steeply since about 1750. Almost all of the increase is caused by human activity. Two main processes increase CO₂ and three main processes increase methane.
Carbon dioxide
Combustion of fossil fuels. Coal, oil and natural gas contain carbon fixed by photosynthesis millions of years ago. Burning them for electricity, transport, industry and heating releases this carbon as CO₂ much faster than it can be absorbed, and it is the largest single source.
Deforestation. Clearing and burning forests releases the carbon stored in wood and soil, and removes trees that would otherwise absorb CO₂ by photosynthesis.
Methane
Livestock. Cattle, sheep and goats are ruminants. Anaerobic microorganisms called methanogens in the rumen (the first chamber of the stomach) digest cellulose and release methane, which the animal belches out.
Rice paddies. Flooded fields are waterlogged and anaerobic, so methanogens in the mud decompose organic matter and release methane.
Landfill. Buried food and other organic waste is decomposed anaerobically, releasing methane.
Methane is present in much lower concentrations than CO₂, but each molecule absorbs infrared radiation much more strongly. Over 100 years, one tonne of methane causes about 28 times as much warming as one tonne of CO₂. Methane breaks down in the atmosphere in about 12 years, whereas a large fraction of emitted CO₂ stays for centuries, so cutting methane emissions slows warming quickly.
Gas | Concentration around 1750 | Recent concentration | Main human sources |
|---|---|---|---|
Carbon dioxide (CO₂) | About 280 ppm | About 424 ppm (Mauna Loa, 2024 annual mean) | Combustion of fossil fuels; deforestation |
Methane (CH₄) | About 730 ppb | About 1,920 ppb (global mean, 2023) | Livestock; rice paddies; landfill; fossil fuel extraction |
Sources: IPCC Sixth Assessment Report, 2021; NOAA Global Monitoring Laboratory, 2024.
Direct measurements of atmospheric CO₂ began in 1958 at Mauna Loa, Hawaii (the Keeling curve, described in C4.2). To find out how CO₂ and temperature varied before then, scientists drill ice cores from the Antarctic and Greenland ice sheets. Snow that falls on an ice sheet is compressed into ice over thousands of years, trapping small bubbles of air. Deeper ice is older, so a core is a record of the atmosphere through time.
The CO₂ and methane concentrations in each layer are measured directly from the air bubbles. Past temperature is estimated from the ratio of the hydrogen and oxygen isotopes in the ice itself, because the proportion of heavy isotopes in snow depends on the temperature at which it formed. The EPICA Dome C core from East Antarctica covers about 800,000 years. Over this period CO₂ rose and fell between about 180 ppm in the cold glacial periods and about 300 ppm in the warm interglacials, and temperature followed the same pattern closely.
The two variables show a strong positive correlation: when CO₂ concentration was high, temperature was high, and when it was low, temperature was low. In a negative correlation, one variable falls as the other rises, as dissolved oxygen falls when the temperature of water rises. A correlation, however positive or negative, shows only that two variables change together. It does not show that one causes the other: both could be caused by a third factor, or the cause could run in the opposite direction.
The causal link between CO₂ and warming comes from other evidence:
A known mechanism. Laboratory experiments since the 1850s have shown that CO₂ and methane absorb infrared radiation at particular wavelengths, while nitrogen and oxygen do not.
Satellite measurements. Less infrared radiation now escapes to space at exactly the wavelengths absorbed by CO₂ and methane, and more is detected coming down to the surface.
Isotope evidence. The carbon added to the atmosphere has the isotope signature of fossil fuels, which lack carbon-14 and are rich in carbon-12.
Climate models. Models based on physics reproduce the observed warming only when the rise in greenhouse gases is included.
The ice cores also show that the relationship works both ways. At the end of each ice age, small changes in the Earth's orbit began the warming; the warmer oceans then released CO₂, which amplified the warming. CO₂ therefore acted as a feedback in the past, while today it is the main driver, because humans are adding it directly.
In a positive feedback cycle, a change causes effects that increase the original change. Several processes in the climate system work in this way: warming causes changes that release more greenhouse gases or absorb more solar radiation, which causes further warming. Positive feedback is why climate change could accelerate even if human emissions stopped rising.
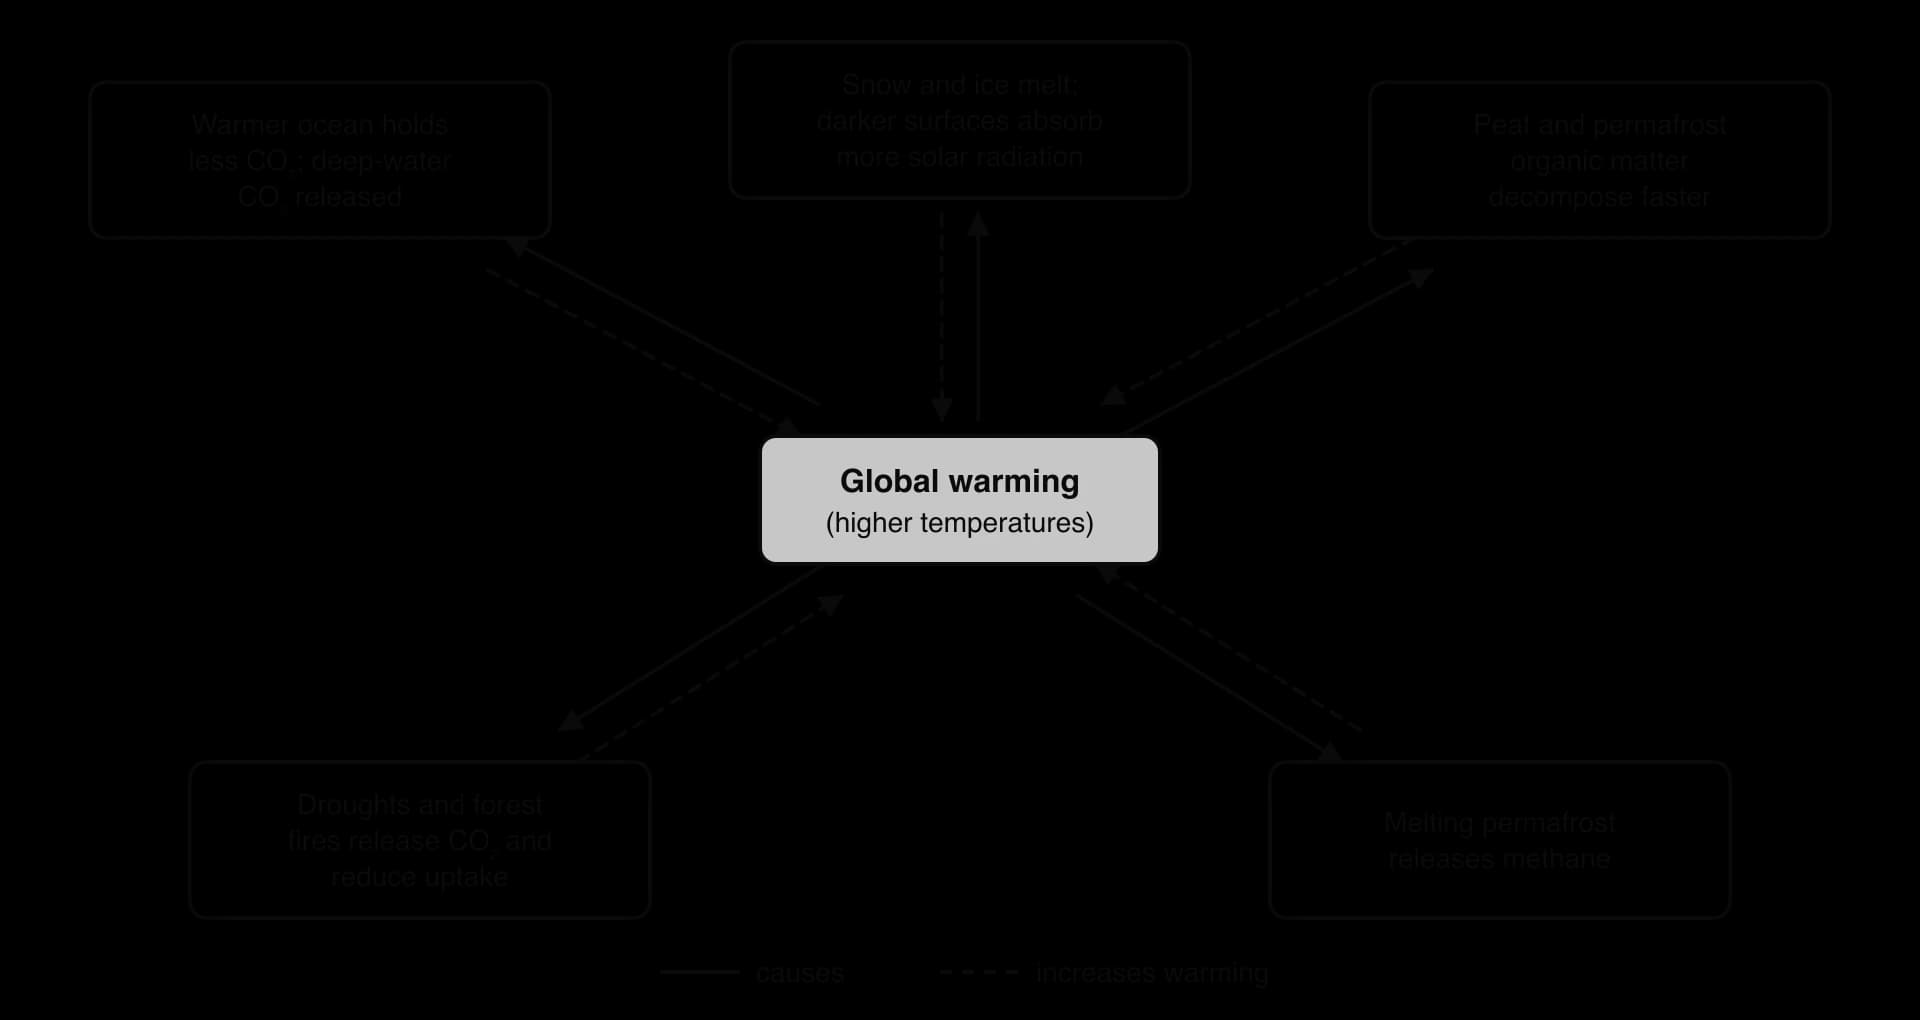
The oceans have absorbed about a quarter of the CO₂ released by humans. Gases are less soluble in warm water than in cold water, so as the oceans warm they absorb CO₂ less effectively. Warming of the surface also strengthens the layering of the ocean, which reduces the mixing that carries CO₂ from surface water into the deep ocean. Large amounts of carbon are stored in deep water, and changes in ocean circulation could bring some of it back to the surface and release it as CO₂.
The proportion of incoming solar radiation that a surface reflects is called its albedo. Fresh snow and sea ice have a very high albedo and reflect most sunlight, while open ocean and bare ground have a low albedo and absorb most of it. As snow and ice melt, darker surfaces are exposed, more solar radiation is absorbed, and warming increases. This causes more melting, in a cycle. The albedo feedback is one reason why the Arctic is warming much faster than the global average.
Peat bogs and permafrost contain vast amounts of organic matter that has not decomposed because conditions are too cold or too waterlogged for decomposers. Permafrost soils in the Arctic contain roughly twice as much carbon as the atmosphere. As temperatures rise, the frozen ground thaws, and bacteria and fungi decompose the organic matter that has been stored for thousands of years. Where the thawed soil is aerobic, decomposers release CO₂. Warmer conditions also dry out peat, speeding up its decomposition.
Where thawing permafrost becomes waterlogged, as in the many lakes and wetlands that form when frozen ground melts, decomposition is anaerobic. Methanogens then release methane instead of CO₂. Because methane is a much stronger greenhouse gas than CO₂, this feedback is particularly serious.
Warming increases evaporation and changes rainfall patterns, so droughts become more frequent and intense in many regions. Drought reduces photosynthesis, so forests absorb less CO₂. Dry vegetation also burns more easily, and the fires release large amounts of stored carbon as CO₂. Burned forest takes decades to regrow, so for many years it absorbs less carbon than before.
The boreal forest, or taiga, is the belt of coniferous forest that stretches across Canada, Alaska, Scandinavia and Russia. It is the largest land biome on Earth. Cold winters and short summers slow decomposition, so boreal forests have stored huge amounts of carbon in their trees, in deep layers of undecomposed needles and moss, and in peat and permafrost. For thousands of years they have been a carbon sink, accumulating more carbon each year than they lose.
Climate change is warming the boreal zone faster than the global average. Higher temperatures and reduced winter snowfall cause drought, because there is less meltwater in spring and more evaporation in summer. Drought reduces primary production, and large areas of forest show "browning", in which trees lose needles or die. Dry forests burn more often and more intensely, and the fires burn not only the trees but the deep organic layers of the soil.
Carbon that has built up in the soil and biomass over many decades or centuries is called legacy carbon. When intense fires burn it, carbon that had been stored for a very long time returns to the atmosphere in a few days. If fires become frequent enough, the forest may lose more carbon each year than it gains, switching from net carbon accumulation to net carbon loss. This switch would be a tipping point, because the extra CO₂ would cause more warming and more fires, in a positive feedback.
In 2023 Canada had by far its worst wildfire season on record. A hot, dry spring followed a winter with little snow in many regions, and fires broke out across the country from May onwards. Most of the area burned was boreal forest, in provinces from British Columbia and Alberta to Quebec. Smoke from the fires caused severe air pollution as far away as New York and western Europe.
Measure | Value |
|---|---|
Area burned in Canada in 2023 | 17,203,625 hectares |
Previous record (1989) | About 7.6 million hectares |
Carbon released by the fires, May to September 2023 | About 647 Tg (0.647 Gt) of carbon (range 570–727 Tg) |
Comparison | Only China, India and the USA released more carbon from fossil fuels in 2022 |
Sources: Canadian Interagency Forest Fire Centre, 2023 Canada Report; Byrne et al., Nature, 2024.
The carbon released by Canada's fires in a single season was comparable to the annual fossil fuel emissions of a large industrial country. The 2023 season does not prove that the boreal forest has passed a tipping point, because a single year can be extreme by chance. However, fire seasons in the boreal zone are becoming longer and more severe, and studies of burned areas show that some recent fires burn carbon that had survived many earlier fires. Both observations point towards the change from net carbon accumulation to net carbon loss.
Sea ice forms when seawater freezes. Some floats freely and moves with winds and currents, while landfast ice (also called fast ice) is attached to the coast or to ice shelves and stays in place. Both are habitats: animals breed, rest and hunt on them, and algae growing on the underside of the ice support polar food chains. As the climate warms, sea ice forms later in the autumn, breaks up sooner in spring and covers a smaller area. In the Arctic, the area of sea ice at its September minimum has fallen by about 12% per decade since satellite records began in 1979.
The general term sea ice covers all ice that forms from frozen seawater, whether drifting pack ice or landfast ice. It is different from icebergs and ice shelves, which form from glaciers on land.
The emperor penguin (Aptenodytes forsteri) is the only bird that breeds during the Antarctic winter. Colonies gather on stable landfast ice from about April. Each female lays a single egg, which the male incubates on his feet through the winter. The chicks hatch in mid-winter and must stay on the ice until they grow waterproof adult feathers in December or January. If the landfast ice breaks up before then, the chicks fall into the sea and drown or freeze.
The colony at Halley Bay, on the Brunt Ice Shelf in the Weddell Sea, was once the second largest emperor penguin colony in the world. In 2016 the sea ice broke out unusually early, and almost all the chicks died. Breeding failed in the same way in 2017 and 2018, and most adults moved to other colonies. As warming continues, early break-out of landfast ice is expected to become more frequent, and the breeding grounds of many emperor penguin colonies may be lost.
The walrus (Odobenus rosmarus) feeds on clams and other animals on the sea floor of shallow continental shelves. Female walruses and their calves rest on floating sea ice between dives, which allows them to stay close to their feeding grounds and safe from predators. In recent summers the ice has retreated far beyond the shallow shelf in the Chukchi Sea, over water too deep for feeding. The walruses then haul out on beaches in huge numbers.
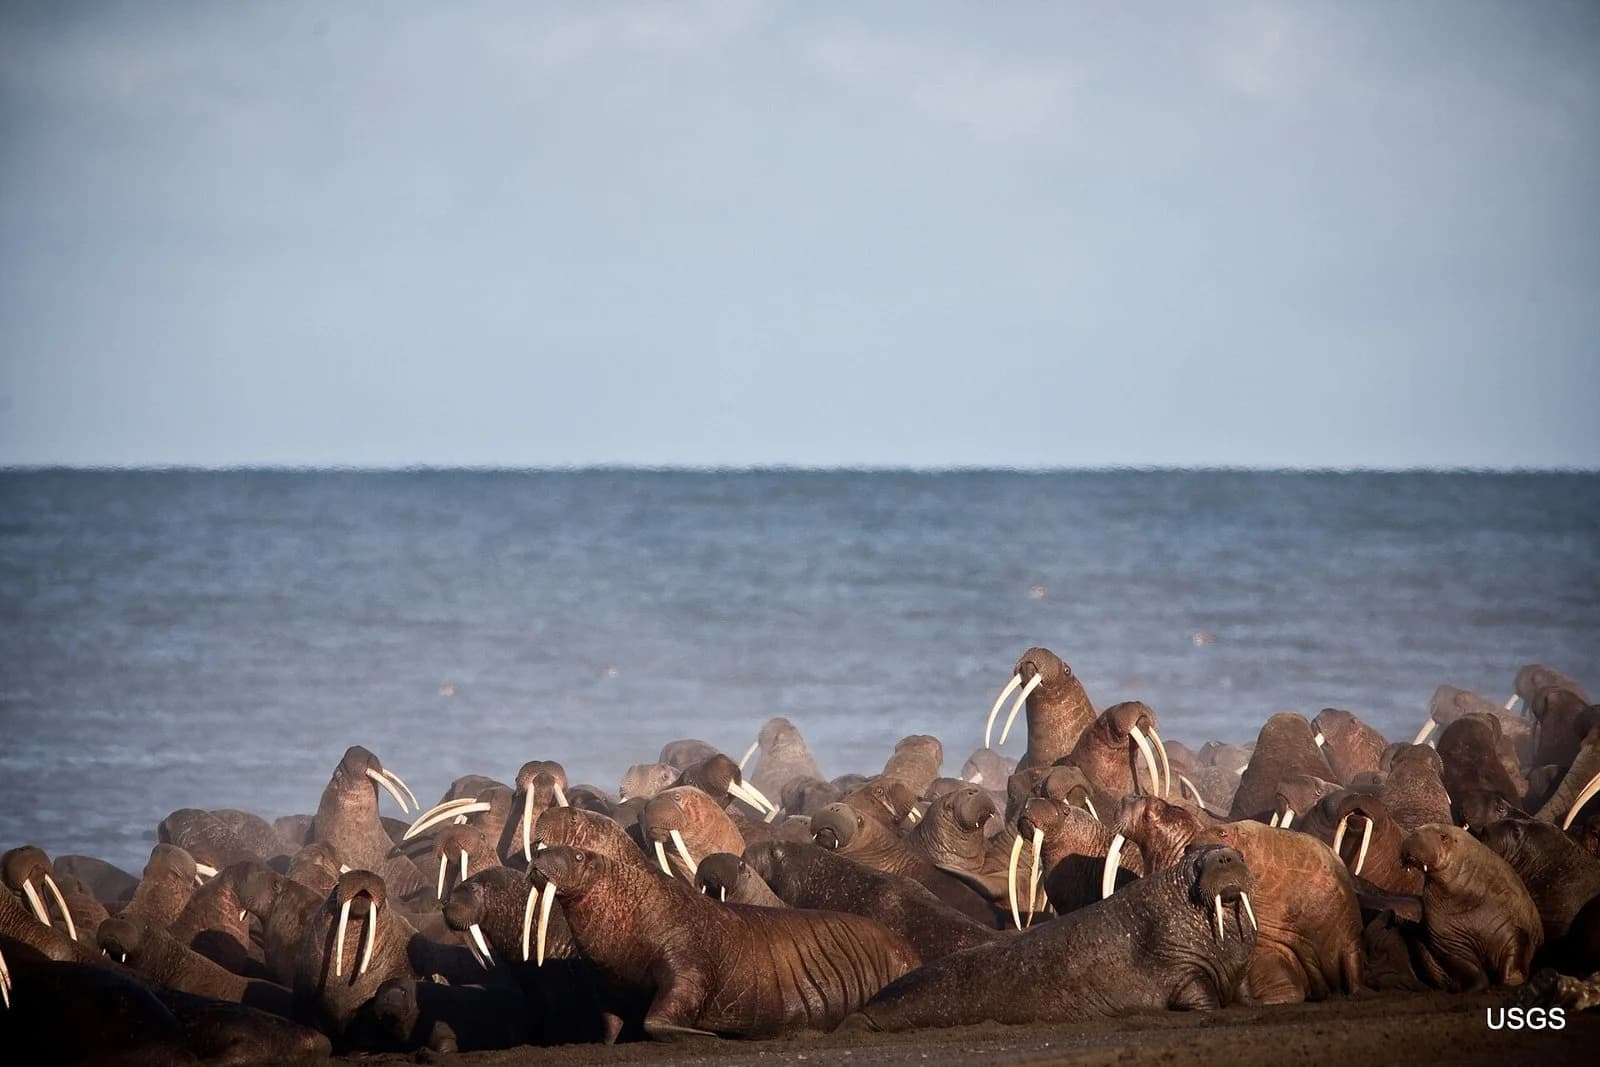
In September 2014 an estimated 35,000 Pacific walruses hauled out on a barrier island near Point Lay, Alaska. Crowding on land is dangerous: walruses must swim further from the beach to feed, using more energy, and if the herd is startled, the stampede can crush calves to death. The loss of sea ice is therefore a loss of habitat, even though the walruses can still survive on land.
Most of the mineral nutrients in the ocean, such as nitrate, phosphate and iron, are found in deep water, where dead organisms sink and decompose. Surface waters, where there is enough light for photosynthesis, are often poor in nutrients. Primary production is therefore highest where deep, nutrient-rich water rises to the surface, a process called upwelling.
Upwelling happens mostly along the western coasts of continents, such as Peru, California and Namibia, where winds push surface water offshore and deep water rises to replace it, and also in parts of the Southern Ocean. These regions cover a small fraction of the ocean but support a large proportion of the world's fisheries, because the nutrients allow dense populations of phytoplankton, which feed zooplankton, fish, seabirds and marine mammals.
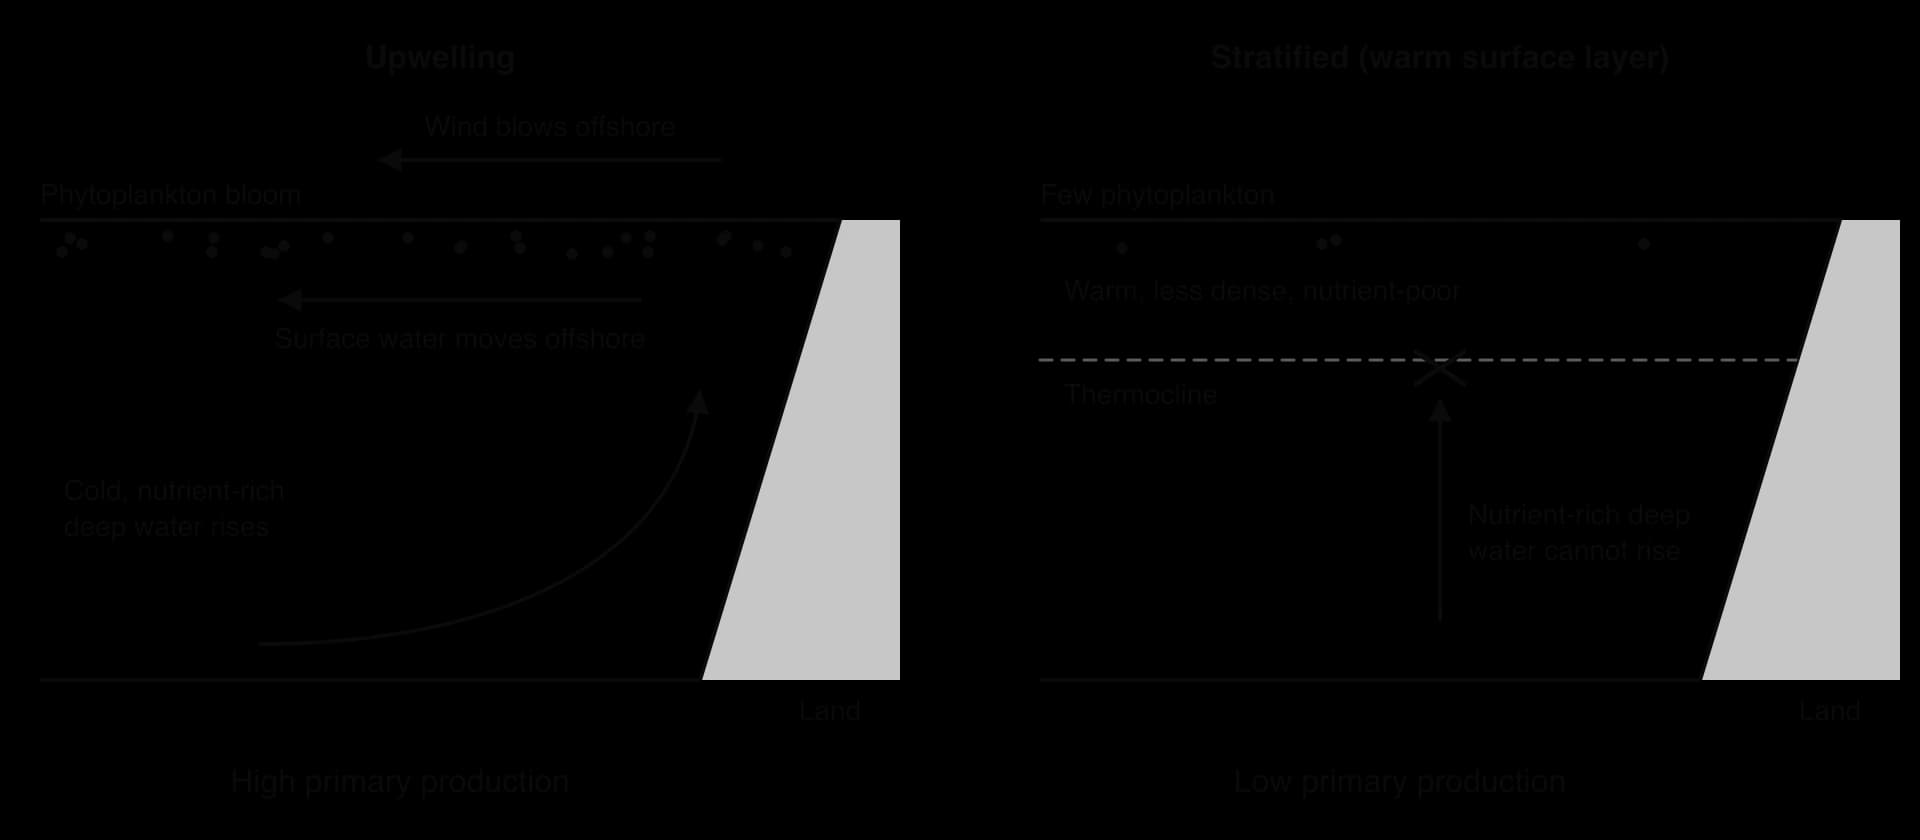
Climate change affects upwelling in two ways. First, the surface of the ocean is warming faster than deep water. Warm water is less dense, so it floats on the cold water beneath, and the boundary between them (the thermocline) becomes sharper. This stratification makes it harder for winds to mix nutrient-rich water up to the surface. Second, changes in the patterns of wind and ocean currents can alter the timing and extent of upwelling, so that it starts later in the year or covers a smaller area.
When upwelling weakens, phytoplankton production falls, and less energy flows through marine food chains. The Peruvian anchoveta (Engraulis ringens) fishery shows the consequences. During El Niño events, warm surface water spreads along the coast of Peru and suppresses upwelling. During the strong El Niño of 1972–73 the anchoveta population collapsed, the fishery failed, and seabirds that feed on anchovies died in large numbers. El Niño is a natural cycle, but it shows how food chains respond when warm surface water blocks upwelling, the same effect that stratification caused by warming is expected to produce more often.
The range of a species is the geographical area in which it lives. Its limits are often set by temperature, because each species can survive and reproduce only within its range of tolerance. As the climate warms, the zone of suitable temperatures moves towards the poles and up mountains, and many species follow it. These movements are called range shifts.
A range shift results from differences in survival and reproduction at the edges of the range. At the cooler edge, conditions become suitable, so individuals that disperse there survive and breed, and the range expands. At the warmer edge, conditions become too hot or dry, adults die or fail to reproduce, and the range contracts. Species that disperse well, such as birds and flying insects, can shift quickly; trees, whose seeds travel only short distances and which take years to reach reproductive age, shift much more slowly.
Temperature falls by roughly 0.6 °C for every 100 m increase in altitude, so warming of a few tenths of a degree moves the zone of suitable temperature tens of metres up a mountain. In 1965 the ornithologist Jared Diamond recorded the altitudes at which bird species lived on Mount Karimui in Papua New Guinea. When the survey was repeated 47 years later, the upper limits of the species' ranges had risen by an average of 113 m and their lower limits by 95 m. On nearby Karkar Island, upper limits rose by an average of 152 m.
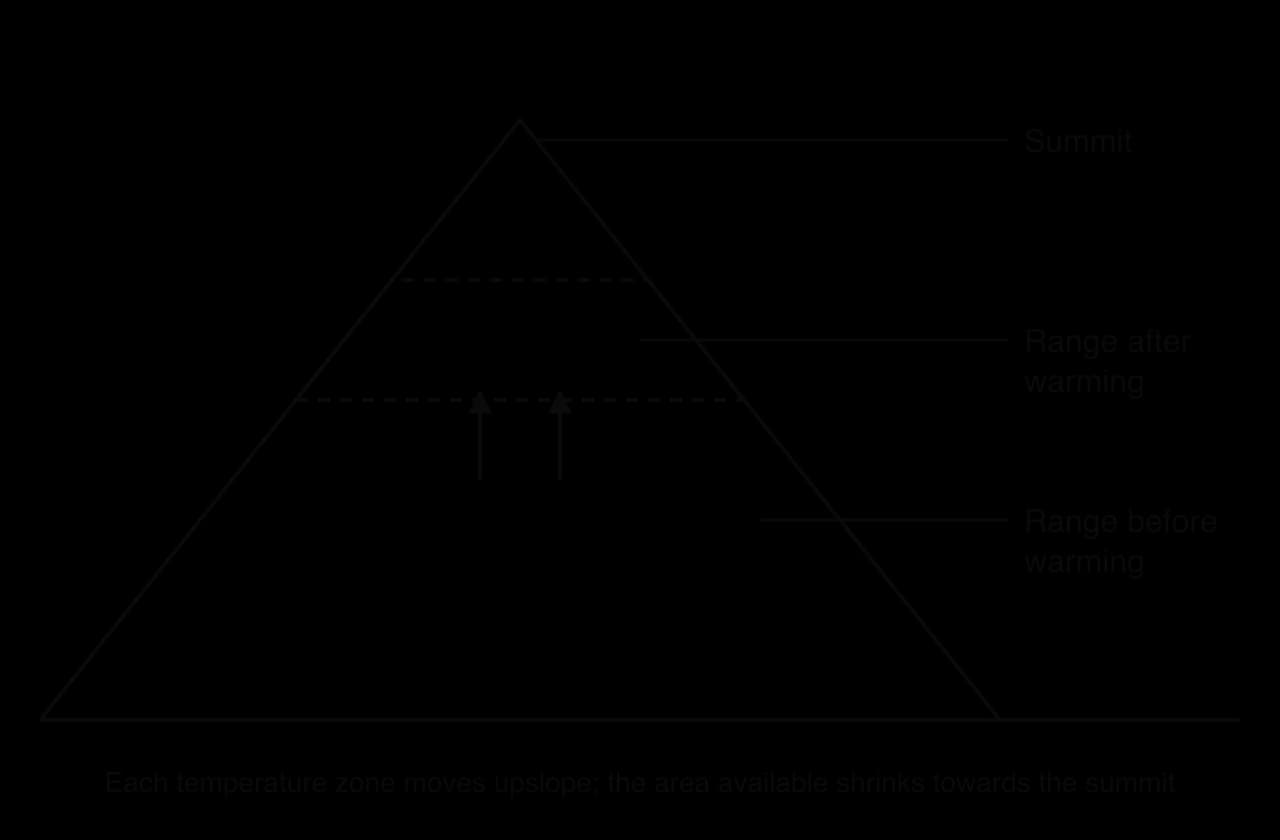
Mountains are cone-shaped, so a band of altitude near the top covers a smaller area than the same band near the base. As species move upslope, their populations are squeezed into smaller areas and become smaller and more vulnerable. Several bird species on Mount Karimui, such as the white-winged robin and the crested berrypecker, now live only near the summit. If warming continues they may be lost from the mountain completely, which is sometimes called an "escalator to extinction".
Forest inventory data collected by the US Forest Service allow the ranges of tree species in the eastern USA to be compared over time. Between 1980 and 2015, the centres of abundance of 62% of the 86 tree species studied moved towards the pole (northwards), and those of 73% moved westwards. Evergreen conifers mainly moved north, while many deciduous species such as oaks and maples moved west, probably because rainfall patterns have changed as well as temperature.
For many tree species, the evidence is of contraction at the southern edge of the range, where saplings fail to establish in warmer, drier conditions, combined with slow expansion at the northern edge. Because trees disperse slowly, ranges may not keep pace with the speed of climate change, and some species may lose more range at their southern limits than they gain in the north.
 YouTube
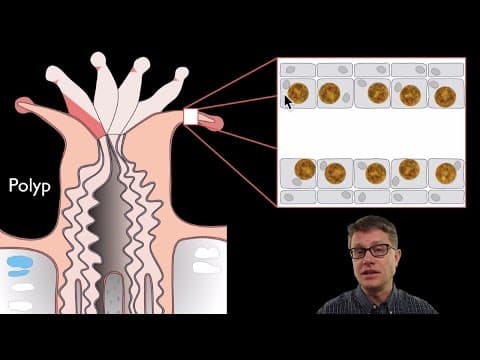
Coral reefs are built by hard corals, colonial animals whose polyps secrete skeletons of calcium carbonate (CaCO₃). Reef-building corals live in shallow, warm, clear tropical water and depend on a mutualistic relationship with zooxanthellae, photosynthetic algae that live inside the coral's cells. The algae give the coral most of the sugars it needs and its colour, while the coral provides the algae with shelter, CO₂ and nutrients. Reefs cover less than 1% of the ocean floor but support about a quarter of all marine species.
Coral reefs are threatened by two consequences of rising CO₂: ocean acidification and higher water temperatures.
About a quarter of the CO₂ released by humans dissolves in the oceans. Dissolved CO₂ reacts with water to form carbonic acid, which releases hydrogen ions:
The extra hydrogen ions lower the pH of seawater. They also combine with carbonate ions, converting them into hydrogencarbonate ions:
This process is ocean acidification. The average pH of surface seawater has fallen from about 8.2 before the Industrial Revolution to about 8.1 today. Because the pH scale is logarithmic, this is an increase of about 30% in the concentration of hydrogen ions. Corals, molluscs and some plankton build their skeletons and shells from calcium ions and carbonate ions. With fewer carbonate ions available, calcification is suppressed: corals grow more slowly, their skeletons are weaker, and in more acidic water existing calcium carbonate can begin to dissolve.
Corals live close to the upper limit of their temperature tolerance. If the water temperature stays 1–2 °C above the normal summer maximum for several weeks, the zooxanthellae are damaged and begin to produce harmful reactive oxygen compounds. The coral polyps then expel the algae. Without them the coral tissue becomes transparent and the white calcium carbonate skeleton shows through, so the coral looks white, which is known as coral bleaching.
A bleached coral is still alive, and if the temperature falls quickly it can take up zooxanthellae again and recover. Without its algae, however, it receives very little food. If high temperatures last too long, the coral starves and dies, and its skeleton is soon covered by seaweed.

The Great Barrier Reef, off north-eastern Australia, is the largest reef system on Earth. A marine heatwave in 2016 caused severe bleaching across its northern section and killed about 30% of its corals within months. Further mass bleaching events followed in 2017, 2020, 2022 and 2024. The intervals between bleaching events are now too short for slow-growing corals to recover fully, and fast-growing species are replacing slow-growing ones, changing the structure of the reef.
 YouTube
Corals are the foundation of the reef ecosystem. Their skeletons create the three-dimensional structure in which thousands of species of fish, crustaceans, molluscs and other animals feed, shelter and breed, and their zooxanthellae provide much of the primary production. When corals die from bleaching, and acidification prevents new growth, the reef structure is eroded by waves and by organisms that bore into it. The habitat for other species disappears, food webs collapse, and the reef can change into a flat, seaweed-covered rubble field with far lower biodiversity. This change from coral reef to a different, much less diverse state is an example of potential ecosystem collapse.
Reducing emissions is the most effective way to slow climate change, but CO₂ can also be removed from the atmosphere and stored. This is carbon sequestration. Ecosystems sequester carbon naturally when photosynthesis fixes more carbon than respiration releases, and the extra carbon is stored in wood, roots, soil and peat.
Growing trees absorb CO₂ and store the carbon in wood for decades or centuries. New forest can be created in two ways. Afforestation is planting trees on land that has not been forested in recent times, such as grassland or old farmland. Reforestation is re-establishing forest on land from which it was recently cleared, either by planting or by letting it regenerate naturally from seeds and roots.
Natural forest regeneration is often cheaper than planting. If grazing animals and fire are kept out, seeds from nearby forest arrive and grow, producing a mixed forest of native species. Planting is faster where there are no seed sources nearby or where the soil is too degraded for seeds to establish.
Scientists actively debate which approach sequesters carbon most effectively. Plantations of fast-growing non-native trees, such as Sitka spruce (Picea sitchensis), a North American conifer widely planted in Britain, or species of Eucalyptus in the tropics, absorb CO₂ quickly and produce timber. However, they are usually monocultures with low biodiversity, they are harvested every few decades, which returns some carbon to the atmosphere, and they may be more vulnerable to pests, fire and drought. Planting on peatland or grassland can even release soil carbon.
Rewilding with native species grows more slowly at first, but it produces diverse forests that store carbon in wood and soil for longer, support many more species, and are more resilient to disturbance. The best choice depends on the site, the timescale and the other goals, such as timber production or conservation. This debate is an example of how scientists weigh evidence of different kinds, and how scientific advice depends on values as well as data.
Feature | Non-native plantation | Native forest regeneration (rewilding) |
|---|---|---|
Rate of carbon uptake | Fast in the first decades | Slower at first |
Long-term carbon storage | Reduced by regular harvesting | Large and long-lasting, in wood and soil |
Biodiversity | Low (often a monoculture) | High; supports native species |
Resilience to pests, fire and drought | Often low | Often higher, because of genetic and species diversity |
Other benefits | Timber and income | Habitat, water regulation, soil protection |
Peat is partly decomposed plant material that builds up in waterlogged soils, where a lack of oxygen and often acidic conditions slow decomposition (C4.2 covers peat as a carbon store). Peat forms naturally in temperate and boreal bogs and fens, and very rapidly in some tropical ecosystems, such as the peat swamp forests of South-East Asia, where high productivity adds plant material faster than it can decompose. Peatlands cover only about 3% of the world's land surface, but they store about 500–600 Gt of carbon, more than all the world's forests.
When peatlands are drained for farming, forestry or peat extraction, air enters the peat, aerobic decomposers break it down, and the stored carbon is released as CO₂. Restoration reverses this: drainage ditches are blocked so the water table rises, peat-forming mosses such as Sphagnum are reintroduced where needed, and the peat becomes waterlogged again. A restored peatland stops releasing CO₂ and, over time, begins to sequester carbon again as new peat forms.
Many biological events happen at a particular time each year: flowering, the opening of leaf buds in spring (budburst), the formation of dormant buds in autumn (bud set) in deciduous trees, the migration of birds and mammals, and the start of nesting and breeding. The study of the timing of these events is called phenology.
Organisms time these events using environmental cues. The two most important are temperature and photoperiod, the length of the daily period of light.
Photoperiod changes in exactly the same way every year at a given latitude, so it is a reliable cue for the time of year. Many birds begin migration and breeding in response to increasing day length, and many deciduous trees form buds and drop their leaves in autumn in response to shortening days.
Temperature varies from year to year, so it indicates the actual conditions. Budburst in many trees, the flowering of many plants and the development of insects depend on the accumulated warmth of spring.
Long-term phenological records, some going back centuries, show that spring events are now happening earlier. In Europe, leaf unfolding and flowering in many plants have advanced by about 2–3 days per decade since the 1970s. Because records of first flowering or bird arrival are easy to collect, phenology has a long tradition of citizen science.
Within an ecosystem, the life cycles of interacting species are often synchronised: herbivores breed when plants are growing most strongly, and predators raise their young when prey are most abundant. Different species may use different cues. If temperature is the cue for one population and photoperiod is the cue for another, warming will advance the first but not the second, and the two will no longer coincide, a situation called phenological mismatch.
Near Kangerlussuaq in West Greenland, reindeer (Rangifer tarandus, called caribou in North America) migrate each spring to their calving grounds, where females give birth and need high-quality food to produce milk. Their migration is timed mainly by photoperiod. The plants they eat on the calving grounds, including Arctic mouse-ear chickweed (Cerastium arcticum), begin growing in response to temperature. As spring temperatures in the region rose, plant growth started earlier, but the reindeer still arrived at the same time. By the time calves were born, the plants had passed their most nutritious stage. Over the study period, from 1993 onwards, calf production fell about fourfold and calf mortality rose.
In the oak woodlands of northern Europe, the great tit (Parus major) feeds its nestlings mainly on caterpillars of moths such as the winter moth, which feed on young oak leaves. The caterpillars are abundant for only two or three weeks in spring. For chicks to survive, the peak demand for food (when nestlings are about 9–10 days old) must coincide with the peak in caterpillar biomass. Caterpillar emergence is triggered by temperature, through its effect on oak budburst and on caterpillar development.
The response differs between populations. In Wytham Woods, near Oxford, England, female great tits now lay their eggs about two weeks earlier than in the 1960s, closely tracking the earlier caterpillar peak, so synchrony has been largely maintained. In some Dutch populations, egg laying advanced much less than the caterpillar peak, because laying is partly cued by photoperiod and begins before the spring temperatures that set the caterpillar peak have occurred. The result was a mismatch, with fewer chicks surviving in years with a large gap between the two peaks.
Insects are ectotherms, so their rate of development depends on temperature. Each stage of the life cycle (egg, larva, pupa and adult) is completed faster in warm conditions. In cold climates many insects complete only one generation per year. As summers lengthen and warm, some species can complete two or more generations, and their populations can grow much faster.
The European spruce bark beetle (Ips typographus) breeds under the bark of Norway spruce (Picea abies). Adults bore into the tree, mate and lay eggs in tunnels in the phloem; the larvae feed there, cutting off the flow of sugars, and the beetles also carry fungi that block water transport. A healthy tree defends itself by producing resin that seals the tunnels, but drought-stressed trees produce less resin and are easily overwhelmed. In southern Sweden the beetle has usually completed one generation per year, while in warmer Denmark a second generation is common. Climate models predict that by the end of the century a second generation will begin in South Sweden in most years.
More generations per year means more beetles, more trees attacked and killed, and outbreaks that spread across whole landscapes. Hot, dry summers make the effect worse, because they weaken the trees at the same time as they speed up beetle development. Since 2018, a series of hot, dry summers in central Europe has caused bark beetle outbreaks that have killed spruce over very large areas, turning parts of the forest from a carbon sink into a carbon source.
Climate change alters the selection pressures acting on populations. When a variable heritable trait affects survival or reproduction differently in the new conditions, natural selection changes the allele frequencies in the population, and the population evolves in response to climate change.
The tawny owl (Strix aluco) shows this clearly. Tawny owls occur in two colour forms, or morphs: grey and brown. The colour is heritable, and the brown allele is dominant to the grey allele. In Finland, where winters were traditionally long and snowy, grey owls are better camouflaged against snowy backgrounds and survive better, both because they are less visible to predators and to prey and possibly for physiological reasons. Brown owls survive poorly in winters with deep snow, but as well as grey owls in mild winters.
In a population of Finnish tawny owls monitored for 28 years, strong selection against brown owls occurred only in snowy winters. As winters became milder and snow cover declined, this selection weakened, and the proportion of brown owls in the population increased rapidly; the same increase was recorded across Finland over about 50 years. Because the colour is heritable, the change in morph frequency reflects a change in allele frequency: the population evolved as the climate changed.
Questions on climate change appear in Paper 1A as multiple-choice items (the gases involved, albedo, acidification chemistry, phenology), in Paper 1B as graphs of CO₂ concentration, temperature, sea-ice extent or species distributions, and in Paper 2 as data-response questions and extended responses such as "Explain the threats to coral reefs from rising CO₂" or "Discuss approaches to carbon sequestration". The command terms most often used are outline, explain, calculate, distinguish, evaluate and discuss.
The practice question uses annual mean CO₂ concentrations measured at Mauna Loa, Hawaii.
Year | 1960 | 1990 | 2020 |
|---|---|---|---|
Annual mean CO₂ / ppm | 316.9 | 354.4 | 414.2 |
Source: NOAA Global Monitoring Laboratory, Mauna Loa annual means.
Climate change also links to D4.1 Natural selection (the tawny owl at HL) and D4.2 Stability and change (tipping points and rewilding).
I can explain the greenhouse effect and the enhanced greenhouse effect.
I can outline the human sources of carbon dioxide and methane.
I can distinguish positive from negative correlation and correlation from causation, using ice-core data.
I can explain the five positive feedback cycles in global warming.
I can explain the boreal forest as a possible tipping point, using the 2023 Canadian wildfires.
I can describe the loss of habitat for emperor penguins and walruses as polar ice melts.
I can explain how stratification reduces upwelling and ocean primary production.
I can describe evidence for upslope and poleward range shifts.
I can explain ocean acidification and coral bleaching and how they threaten reefs.
I can evaluate plantations, native forest regeneration and peatland restoration for carbon sequestration.
I can explain phenological mismatch with the reindeer and great tit examples. (HL)
I can explain how climate change increases insect generations and drives evolution in the tawny owl. (HL)
Combustion of fossil fuels releases carbon dioxide, and methanogenic archaea in the rumen of cattle produce methane. Row A gives a carbon sink for carbon dioxide, and row C is wrong for both gases: flooded paddy fields are a source of methane rather than carbon dioxide, and planting trees removes carbon dioxide rather than adding methane. Row D links carbon dioxide to nitrate fertilizers and methane to drained peat, which mainly releases carbon dioxide as it decomposes aerobically.
The answer is B.
Air bubbles trapped in Antarctic ice cores show that, over several hundred thousand years, periods with high atmospheric carbon dioxide concentration were also periods with high global temperature. What can be concluded from these ice core data alone?
Which is an example of a positive feedback cycle in global warming?