D3.2 Inheritance questions for IB Biology
37 questions on Inheritance, written by Augment in the style of IB exam papers. Six of them are below in full, to answer on paper.
- IB Biology
- Part of D Continuity and change
- SL and HL
Questions by paper and level
SL and HL questions are for students at either level. HL only questions cover what only HL students study.
| Paper | SL and HL | HL only | All |
|---|---|---|---|
| Paper 1A | 15 | 5 | 20 |
| Paper 1B | 3 | 2 | 5 |
| Paper 2 | 8 | 4 | 12 |
| Every paper | 26 | 11 | 37 |
Counted on
Questions to try
Written by Augment in the style of IB exams, not past papers. Answer them on paper, then check each one against its markscheme with a free account.
Body cells of the garden pea (Pisum sativum) contain 14 chromosomes. Which row shows the number of chromosomes in a male gamete from a pollen grain and in the zygote formed when it fertilizes an egg?
Row | Male gamete | Zygote |
|---|---|---|
A | 14 | 28 |
B | 7 | 7 |
C | 7 | 14 |
D | 14 | 14 |
In tomato (Solanum lycopersicum), stem colour in seedlings is controlled by one gene. A pure-breeding plant with purple stems was crossed with a pure-breeding plant with green stems (P generation). All the F1 plants had purple stems. The F1 plants were self-pollinated and their seeds were sown in five trays. The table shows the stem colour of the F2 seedlings.
Tray | Number of seedlings with purple stems | Number of seedlings with green stems |
|---|---|---|
1 | 38 | 11 |
2 | 35 | 14 |
3 | 41 | 12 |
4 | 36 | 13 |
5 | 39 | 11 |
- (a)
Outline how the cross between the two plants of the P generation should be carried out.
2 marks
- (b)
Suggest why the F1 tomato plants could be used to produce an F2 generation without a second plant.
1 mark
- (c)
Calculate the ratio of seedlings with purple stems to seedlings with green stems for all five trays combined. Give your answer to one decimal place.
2 marks
- (d)
Suggest why the results from all five trays were combined.
1 mark
- (e)
Using a Punnett grid, explain the ratio of stem colours in the F2 generation. Use A for the allele for purple stems and a for the allele for green stems.
3 marks
- (f)
State the genotype of the green-stemmed plant in the P generation.
1 mark
In all eukaryotes with a sexual life cycle, genes are passed from parents to offspring in haploid gametes.
- (a)
State the name of the cell formed when two gametes fuse.
1 mark
- (b)
Outline the reasons that a diploid cell has two copies of each autosomal gene.
2 marks
- (c)
Distinguish between homozygous and heterozygous genotypes.
2 marks
- (d)
Distinguish between genotype and phenotype.
2 marks
Which statement distinguishes a gene from an allele?
Thirty stem cuttings were taken from a single coleus plant (Coleus scutellarioides) and grown in identical pots of compost. Ten were grown in full light and twenty under shade cloth that allowed 20 % of the light through. After four weeks, ten of the shaded plants were moved into full light. After a further four weeks, the area of the youngest fully grown leaf was measured on every plant. For the plants that were moved, this leaf had grown after the move. The chart shows the mean leaf area and the standard deviation.
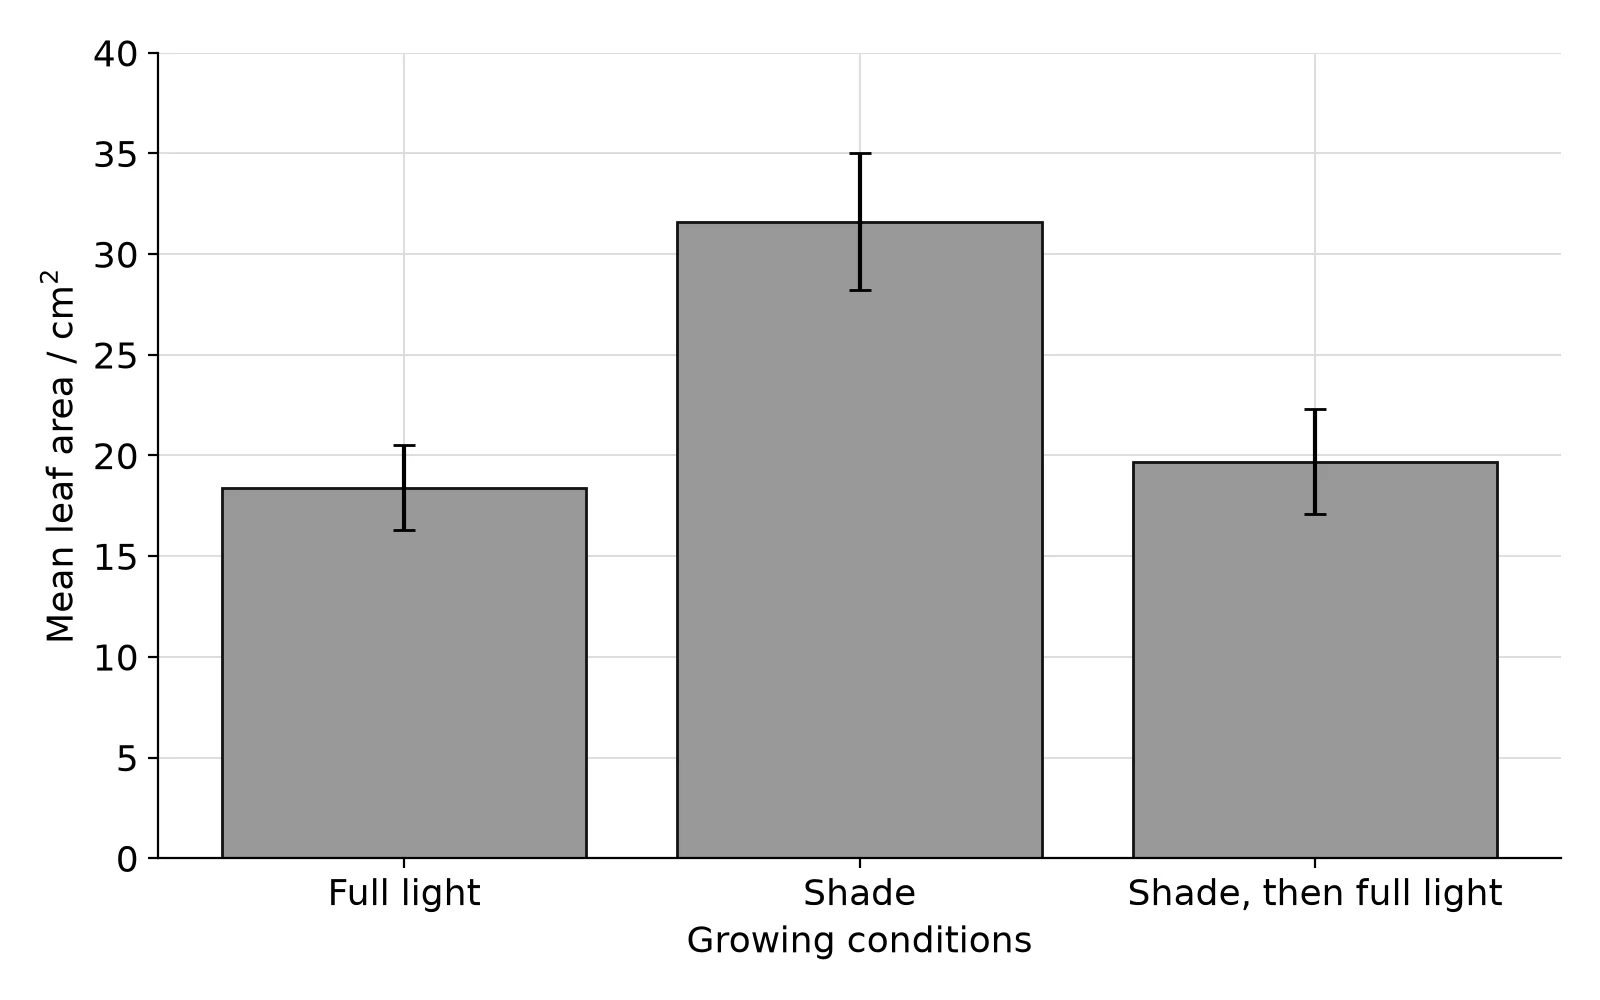
The mean thickness of the leaves was 312 µm in full light, 198 µm in shade and 301 µm in plants moved from shade to full light.
- (a)
Explain why cuttings from one plant were used.
2 marks
- (b)
Calculate the percentage by which the mean leaf area of plants grown in shade was greater than that of plants grown in full light.
1 mark
- (c)
Using the data, evaluate whether there is a difference in leaf area between plants grown in full light throughout and plants moved from shade to full light.
2 marks
- (d)
State one variable, other than the type of compost and the plants' genotype, that should have been kept constant.
1 mark
- (e)
Explain how the results provide evidence of phenotypic plasticity.
3 marks
Phenylketonuria (PKU) is a recessive genetic condition. Children with PKU are now identified by a blood test a few days after birth and given a diet low in phenylalanine. The table compares the mean blood phenylalanine concentration of children without PKU, children with PKU on a low-phenylalanine diet started in the first week of life, and children with PKU born before screening was introduced, who ate a normal diet.
Group | Mean blood phenylalanine at 3 days / µmol dm-3 | Mean blood phenylalanine at 6 months / µmol dm-3 |
|---|---|---|
Without PKU | 55 | 58 |
PKU, low-phenylalanine diet | 620 | 280 |
PKU, normal diet | 640 | 1450 |
- (a)
Outline the cause of PKU.
2 marks
- (b)
Calculate how many times higher the mean blood phenylalanine concentration was at 6 months in children with PKU on a normal diet than in children without PKU.
1 mark
- (c)
Explain the effect of the low-phenylalanine diet on the blood phenylalanine concentration.
2 marks
- (d)
Using the data, explain how PKU shows that phenotype results from both genotype and environment.
2 marks
- (e)
Two parents who are both carriers of the PKU allele are planning a child. Using a Punnett grid, deduce the probability that the child will have PKU and the probability that the child will be a carrier.
2 marks
Practice all 37 in Augment
Free with an account. Every question has its markscheme, and Augment keeps the ones you got wrong so you can come back to them.
More questions in Continuity and change
- D1.1DNA replication
- D1.2Protein synthesis
- D1.3Mutations and gene editing
- D2.1Cell and nuclear division
- D2.2Gene expressionHL only
- D2.3Water potential
- D3.1Reproduction
- D3.2InheritanceThis page
- D3.3Homeostasis
- D4.1Natural selection
- D4.2Stability and change
- D4.3Climate change
Check your answers in Augment
A free account opens all 37 questions on Inheritance with their markschemes, and keeps a record of what you have marked.