A4.1 Evolution and speciation questions for IB Biology
43 questions on Evolution and speciation, written by Augment in the style of IB exam papers. Six of them are below in full, to answer on paper.
- IB Biology
- Part of A Unity and diversity
- SL and HL
Questions by paper and level
SL and HL questions are for students at either level. HL only questions cover what only HL students study.
| Paper | SL and HL | HL only | All |
|---|---|---|---|
| Paper 1A | 13 | 8 | 21 |
| Paper 1B | 2 | 3 | 5 |
| Paper 2 | 9 | 8 | 17 |
| Every paper | 24 | 19 | 43 |
Counted on
Questions to try
Written by Augment in the style of IB exams, not past papers. Answer them on paper, then check each one against its markscheme with a free account.
Which is an example of evolution?
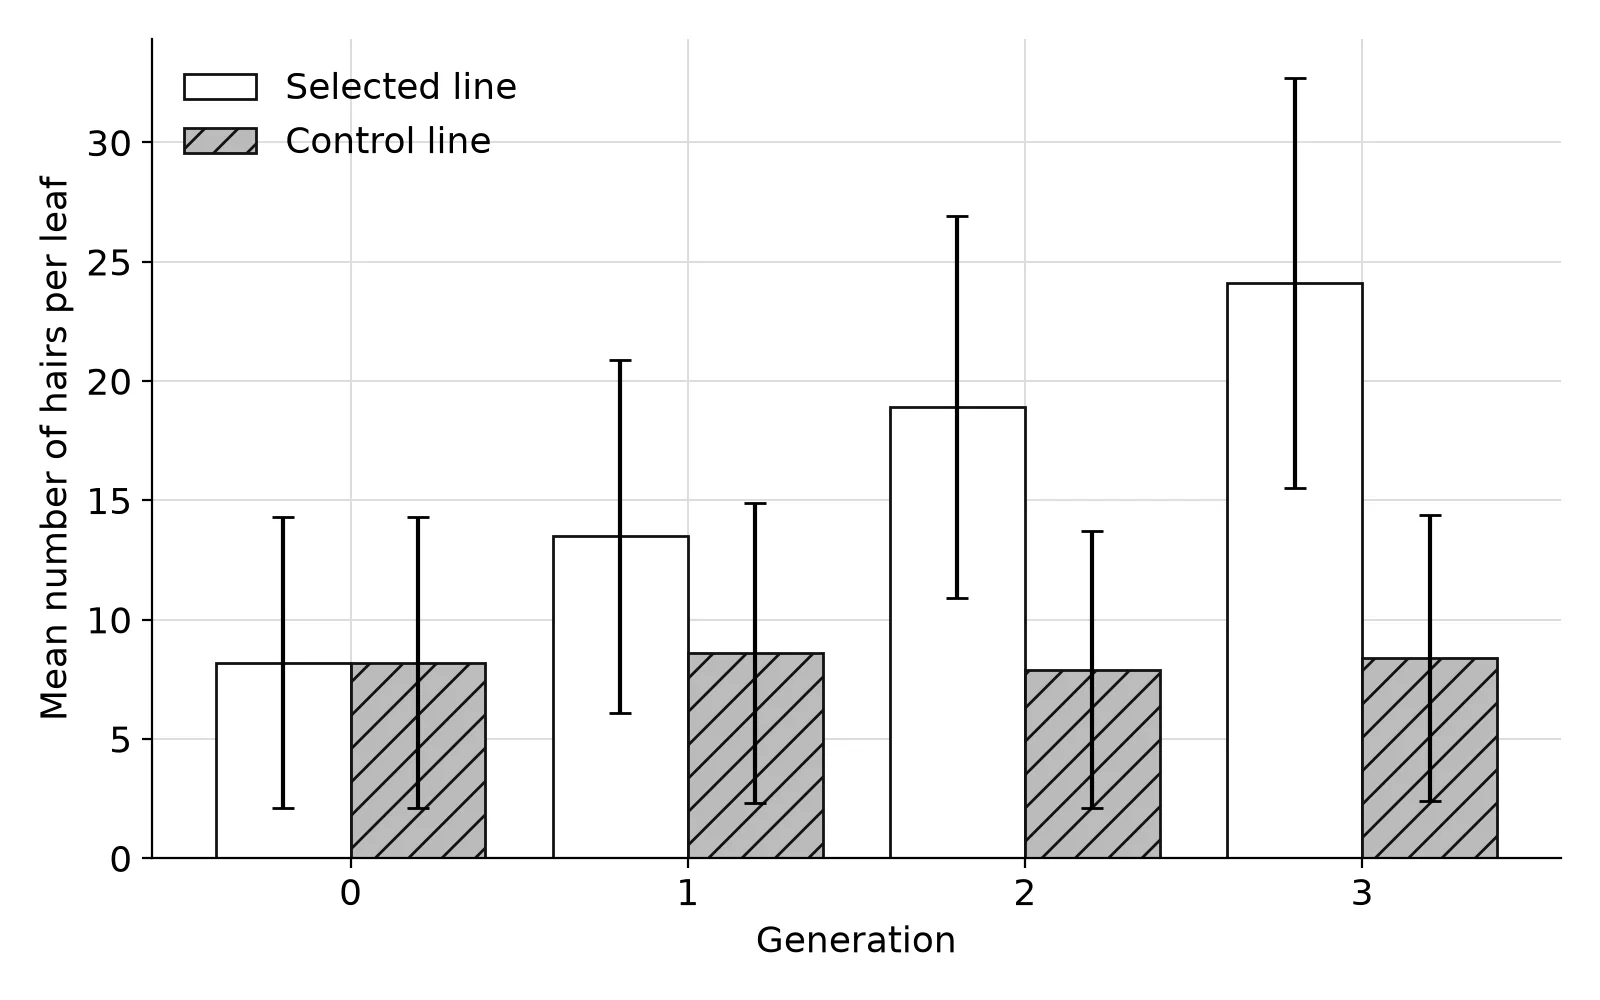
Students investigated the effect of selective breeding on the number of hairs on leaves of a fast-growing variety of field mustard (Brassica rapa). In generation 0, 100 plants were grown and the hairs on the edge of the first true leaf of each plant were counted. Two lines were then set up from this population.
Selected line: the 10 plants with the most hairs were cross-pollinated with each other to produce the next generation.
Control line: 10 plants chosen at random were cross-pollinated with each other to produce the next generation.
This was repeated for three generations, with 100 plants grown in each line in every generation under the same conditions. The bar chart shows the mean number of hairs per leaf. Error bars show ± one standard deviation.
- (a)
State the independent variable in this investigation.
1 mark
- (b)
Explain the purpose of the control line.
2 marks
- (c)
The mean number of hairs in the selected line was 8.2 in generation 0 and 24.1 in generation 3. Calculate the percentage increase.
1 mark
- (d)
Using the error bars, discuss whether the difference between the selected line and the control line is significant in generation 1 and in generation 3.
2 marks
- (e)
Suggest why the hairs were counted on the same leaf of every plant.
1 mark
- (f)
Explain how the results of this investigation provide evidence for evolution.
2 marks
Herons are wading birds with long legs that let them feed in deep water.
- (a)
Distinguish between a Lamarckian and a Darwinian explanation for the long legs of herons.
2 marks
- (b)
Explain why a change in the characteristics of an individual during its lifetime is not evolution.
2 marks
- (c)
Evolution by natural selection could in principle be falsified, but it has not been. Outline what this means, giving one example of an observation that would falsify it.
2 marks
Cytochrome c is a protein found in the mitochondria of all eukaryotes. The table shows the number of amino acid differences between human cytochrome c and the cytochrome c of other organisms.
Organism | Number of amino acid differences from human cytochrome c |
|---|---|
Rhesus monkey | 1 |
Dog | 11 |
Horse | 12 |
Chicken | 13 |
Tuna | 21 |
Yeast | 44 |
Which conclusion is supported by the data?
Students used an online protein database to compare the amino acid sequence of the α chain of haemoglobin in humans with the same protein in eight other vertebrates. The protein is 141 amino acids long. They counted the number of positions at which each sequence differs from the human sequence and found estimates, based on fossil evidence, of the time since each organism's lineage diverged from the human lineage.
Organism | Time since divergence from human lineage / millions of years | Number of amino acid differences from human α chain |
|---|---|---|
Gorilla | 9 | 1 |
Rhesus monkey | 29 | 4 |
Dog | 94 | 18 |
Kangaroo | 160 | 27 |
Chicken | 312 | 35 |
Frog | 352 | 62 |
Carp | 435 | 68 |
Shark | 465 | 79 |
- (a)
Calculate the percentage of amino acids in the α chain that differ between humans and chickens.
1 mark
- (b)
Describe the relationship between the time since divergence and the number of amino acid differences.
2 marks
- (c)
Using the data for the shark, calculate the mean number of amino acid differences that accumulated per 100 million years.
1 mark
- (d)
Suggest two reasons why the number of amino acid differences may underestimate the number of mutations that have occurred in the gene for the α chain since divergence.
2 marks
- (e)
Evaluate the use of these data as evidence that the vertebrates share a common ancestor.
3 marks
Whales are mammals that live in the sea. Researchers compared the base sequence of the same gene in a whale and in four land mammals. The table shows the percentage of bases that differ from the whale sequence.
Mammal | Bases differing from the whale sequence / % |
|---|---|
Hippopotamus | 6.1 |
Cow | 8.4 |
Pig | 11.2 |
Horse | 14.9 |
- (a)
Identify, with a reason, the mammal most closely related to whales.
1 mark
- (b)
Whales have a streamlined body shape and flattened forelimbs similar to those of fish. Outline why this similarity is not evidence that whales are closely related to fish.
2 marks
- (c)
Explain why base sequence data can show how closely species are related.
2 marks
- (d)
Suggest why comparing the sequences of several genes would give more reliable conclusions than comparing one gene.
1 mark
Practice all 43 in Augment
Free with an account. Every question has its markscheme, and Augment keeps the ones you got wrong so you can come back to them.
More questions in Unity and diversity
- A1.1Water
- A1.2Nucleic acids
- A2.1Origins of cellsHL only
- A2.2Cell structure
- A2.3VirusesHL only
- A3.1Diversity of organisms
- A3.2Classification and cladisticsHL only
- A4.1Evolution and speciationThis page
- A4.2Conservation of biodiversity
Check your answers in Augment
A free account opens all 43 questions on Evolution and speciation with their markschemes, and keeps a record of what you have marked.