A2.3 Viruses questions for IB Biology
36 questions on Viruses, written by Augment in the style of IB exam papers. Six of them are below in full, to answer on paper.
- IB Biology
- Part of A Unity and diversity
- HL only
Questions by paper and level
| Paper | Questions |
|---|---|
| Paper 1A | 20 |
| Paper 1B | 5 |
| Paper 2 | 11 |
| Every paper | 36 |
Counted on
Questions to try
Written by Augment in the style of IB exams, not past papers. Answer them on paper, then check each one against its markscheme with a free account.
Which structural feature is found in all viruses?
The concentration of bacteriophage lambda in a stock suspension was estimated by a plaque assay. The stock was diluted in a tenfold series. For each dilution, 0.1 cm3 was mixed with a suspension of Escherichia coli in warm soft agar and poured over a nutrient agar plate, so that the bacteria grew as an even, cloudy layer (a lawn). Three plates were prepared for each dilution. After 18 hours at 37 °C, the clear circular areas (plaques) in the lawn were counted. A control plate received bacteria but no phage.
Dilution of stock | Plate 1 | Plate 2 | Plate 3 |
|---|---|---|---|
10-5 | too many to count | too many to count | too many to count |
10-6 | 284 | 301 | 266 |
10-7 | 31 | 24 | 29 |
10-8 | 4 | 1 | 3 |
The control plate had no plaques.
- (a)
Calculate the mean number of plaques per plate at a dilution of 10-7.
1 mark
- (b)
Each plaque is assumed to start from one phage. Using your answer to (a), calculate the number of phages per cm3 in the undiluted stock. Show your working.
2 marks
- (c)
Suggest why the counts at a dilution of 10-8 are less suitable than those at 10-7 for estimating the concentration of the stock.
2 marks
- (d)
State the purpose of the control plate.
1 mark
- (e)
State one variable, other than the volume of each dilution, that should be kept constant between plates.
1 mark
- (f)
Explain how a single phage particle produces a visible clear plaque in the bacterial lawn.
3 marks
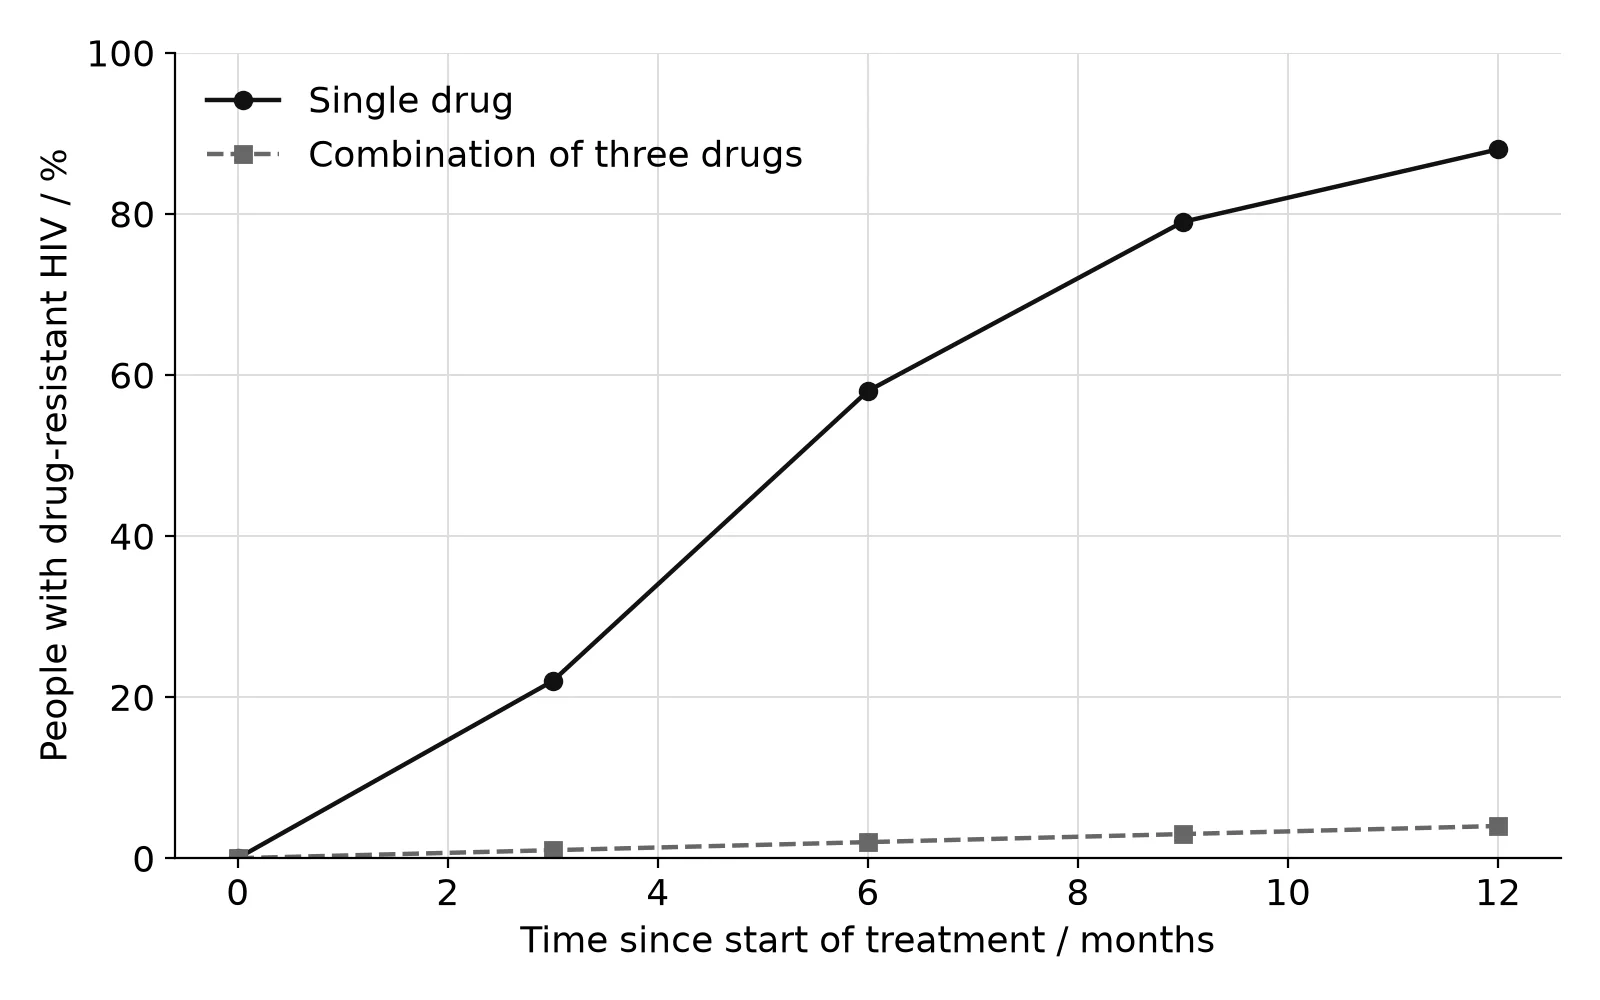
In a clinical study, people infected with HIV received either a single antiretroviral drug that inhibits reverse transcriptase, or a combination of three antiretroviral drugs that act on different viral proteins. Every three months, blood samples were tested for HIV carrying mutations that make it resistant to the drugs being taken. The graph shows the percentage of people in each group in whom drug-resistant HIV was detected.
- (a)
State the percentage of people taking a single drug in whom drug-resistant HIV was detected after six months.
1 mark
- (b)
Compare and contrast the results for the two groups.
2 marks
- (c)
Explain why resistance to a single drug develops so quickly in HIV.
3 marks
- (d)
Suggest reasons why combination therapy slows the evolution of resistance.
2 marks
Which statements apply to all viruses?
I. The genetic material is enclosed in a capsid.
II. A cytoplasm surrounds the genetic material.
III. A virus particle does not grow after it has been assembled.
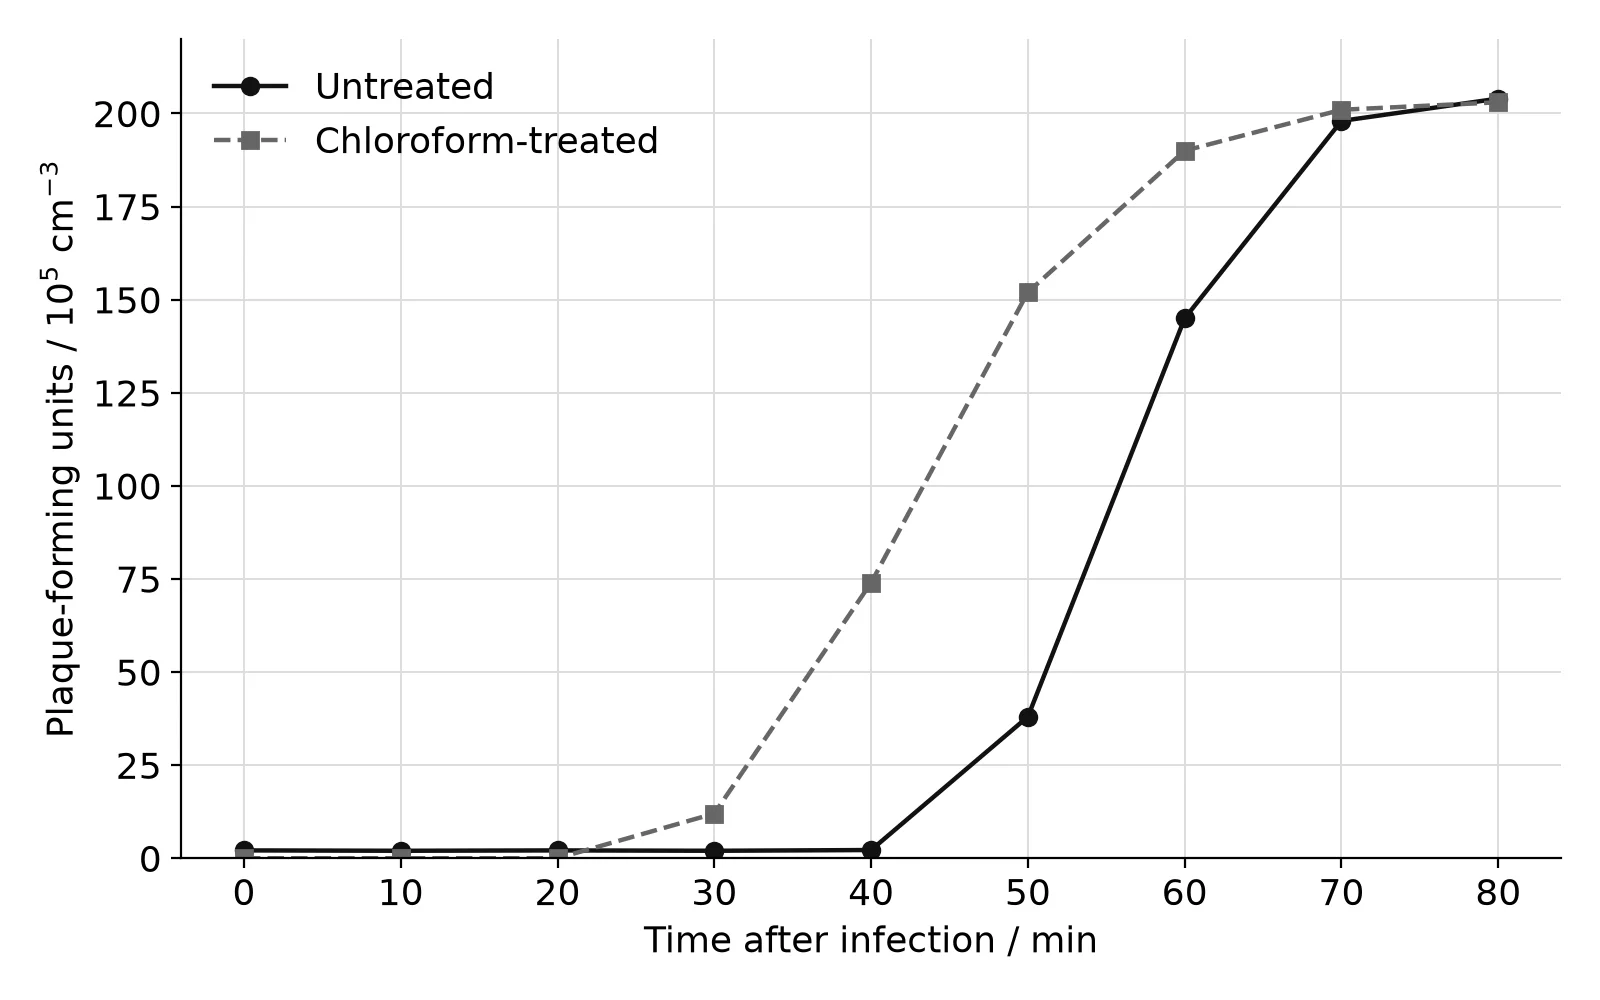
A culture of Escherichia coli was mixed with bacteriophage lambda for 5 minutes, using about one phage for every ten bacteria so that no cell was infected by more than one phage. Phages that had not attached were then removed and the infected cells were diluted into fresh medium at 37 °C (time 0). Samples were taken every 10 minutes and the number of plaque-forming units (each forming one plaque in a plaque assay) was measured in two ways:
Untreated: the sample was plated directly onto a bacterial lawn.
Chloroform-treated: chloroform was first added to the sample to break open all bacterial cells, releasing any complete phages inside them, then the sample was plated.
- (a)
Calculate the mean number of new phages released from each infected cell. Show your working.
2 marks
- (b)
Using the untreated samples, estimate the time after infection at which the infected cells begin to lyse.
1 mark
- (c)
Phages are being produced inside the infected cells from about 25 minutes. Suggest why the untreated count does not rise until after 40 minutes.
2 marks
- (d)
Explain why no plaque-forming units were found in the chloroform-treated samples during the first 20 minutes.
2 marks
- (e)
Suggest why phages that had not attached to the bacteria were removed at the start.
1 mark
- (f)
Outline what the host cell provides for the production of new phages.
2 marks
Influenza vaccines are prepared several months before each winter, using strains of virus that are expected to circulate. A health agency estimated the effectiveness of the vaccine in six winters (the percentage reduction in the risk of illness from influenza in vaccinated people compared with unvaccinated people). In each season it also recorded whether the main circulating strain was a good or poor match to the vaccine strain, judged by how well antibodies against the vaccine strain bound to the circulating virus.
Season | Match between vaccine strain and circulating strain | Vaccine effectiveness / % |
|---|---|---|
1 | good | 52 |
2 | good | 48 |
3 | poor | 19 |
4 | good | 45 |
5 | poor | 13 |
6 | good | 39 |
- (a)
Calculate the mean vaccine effectiveness in the seasons with a good match.
1 mark
- (b)
Outline why the vaccine strain is a poor match to the circulating strain in some seasons.
2 marks
- (c)
Explain why the vaccine gives less protection when the match is poor.
2 marks
- (d)
Suggest one reason why vaccine effectiveness was less than 100 % even in seasons with a good match.
1 mark
Practice all 36 in Augment
Free with an account. Every question has its markscheme, and Augment keeps the ones you got wrong so you can come back to them.
More questions in Unity and diversity
- A1.1Water
- A1.2Nucleic acids
- A2.1Origins of cells
- A2.2Cell structure
- A2.3VirusesThis page
- A3.1Diversity of organisms
- A3.2Classification and cladistics
- A4.1Evolution and speciation
- A4.2Conservation of biodiversity
Check your answers in Augment
A free account opens all 36 questions on Viruses with their markschemes, and keeps a record of what you have marked.