T Business management toolkit
Choose, apply and judge the fifteen situational, planning and decision-making tools of business management, and use them across all five units.
- IB Business Management
- SL and HL
What T covers
From the subject guide: what you need to know and be able to do.
Planning and decision-making tools used across all five units.
15 subtopics in Business management toolkit
Each one has its own page once something is published for it.
- T.1SWOT analysis33 questions · notes
- T.2Ansoff matrix33 questions · notes
- T.3STEEPLE analysis48 questions · notes
- T.4Boston Consulting Group (BCG) matrix30 questions · notes
- T.5Business plan19 questions · notes
- T.6Decision trees35 questions · notes
- T.7Descriptive statistics60 questions · notes
- T.8Circular business models33 questions · notes
- T.9Force field analysisHL only21 questions · notes
- T.10Gantt chartHL only16 questions · notes
- T.11Hofstede’s cultural dimensionsHL only27 questions · notes
- T.12Porter’s generic strategiesHL only22 questions · notes
- T.13ContributionHL only30 questions · notes
- T.14Critical path analysisHL only23 questions · notes
- T.15Simple linear regressionHL onlynotes
An overview of T Business management toolkit
The business management toolkit is a set of fifteen tools for analysing an organisation’s situation, planning what it will do and deciding between options. Each tool is used across the five units: a SWOT analysis or a decision tree can support a growth decision, a marketing plan or a change in operations alike.
Questions that frame the toolkit
The tools help managers answer questions that arise in every organisation.
What is happening inside and outside the organisation, and which of those factors matter most?
Which ways of growing or competing are open to the business, and how risky is each?
When the outcome of a decision is uncertain, which option is likely to give the best result?
How long will a project take, and which tasks cannot be allowed to slip?
How far can a decision be trusted when the numbers behind it are estimates?
What the toolkit covers
The toolkit has fifteen tools. Eight are used at SL and HL; seven are HL only. The units are those where each tool is most often used, although any tool can be applied wherever it helps.
Tool | What it is for | Units | Level |
|---|---|---|---|
T.1 SWOT analysis | Summarising an organisation’s internal strengths and weaknesses and its external opportunities and threats | 1–5 | SL and HL |
T.2 Ansoff matrix | Classifying growth strategies by product and market, and judging their risk | 1, 4 | SL and HL |
T.3 STEEPLE analysis | Identifying the social, technological, economic, environmental, political, legal and ethical factors outside the organisation | 1, 2, 4 | SL and HL |
T.4 Boston Consulting Group matrix | Analysing a portfolio of products by market growth and relative market share, and its cash flow | 3, 4 | SL and HL |
T.5 Business plan | Setting out a new or growing business’s objectives, strategy and finances, often to raise finance | 1–5 | SL and HL |
T.6 Decision trees | Comparing options with uncertain outcomes by their expected value | 1, 5 | SL and HL |
T.7 Descriptive statistics | Summarising and presenting data with averages, measures of spread and charts | 2–5 | SL and HL |
T.8 Circular business models | Designing ways to make money while keeping products and materials in use | 1, 5 | SL and HL |
T.9 Force field analysis | Weighing the forces driving and resisting a proposed change | 2, 5 | HL only |
T.10 Gantt chart | Scheduling the tasks of a project over time and tracking progress | 4, 5 | HL only |
T.11 Hofstede’s cultural dimensions | Comparing national cultures to adapt management and marketing | 2, 4, 5 | HL only |
T.12 Porter’s generic strategies | Choosing how to gain competitive advantage: cost leadership, differentiation or focus | 1, 4 | HL only |
T.13 Contribution | Making short-term cost decisions: make or buy, contribution costing and absorption costing | 3, 4, 5 | HL only |
T.14 Critical path analysis | Finding the shortest time to complete a project and the activities with no float | 4, 5 | HL only |
T.15 Simple linear regression | Measuring the relationship between two variables and using it to forecast | 1, 4, 5 | HL only |
How the tools connect
Most business decisions pass through four stages: analysing the situation, identifying the options, comparing them, and planning the one chosen. Each tool is most useful at one stage, so tools are often used together.
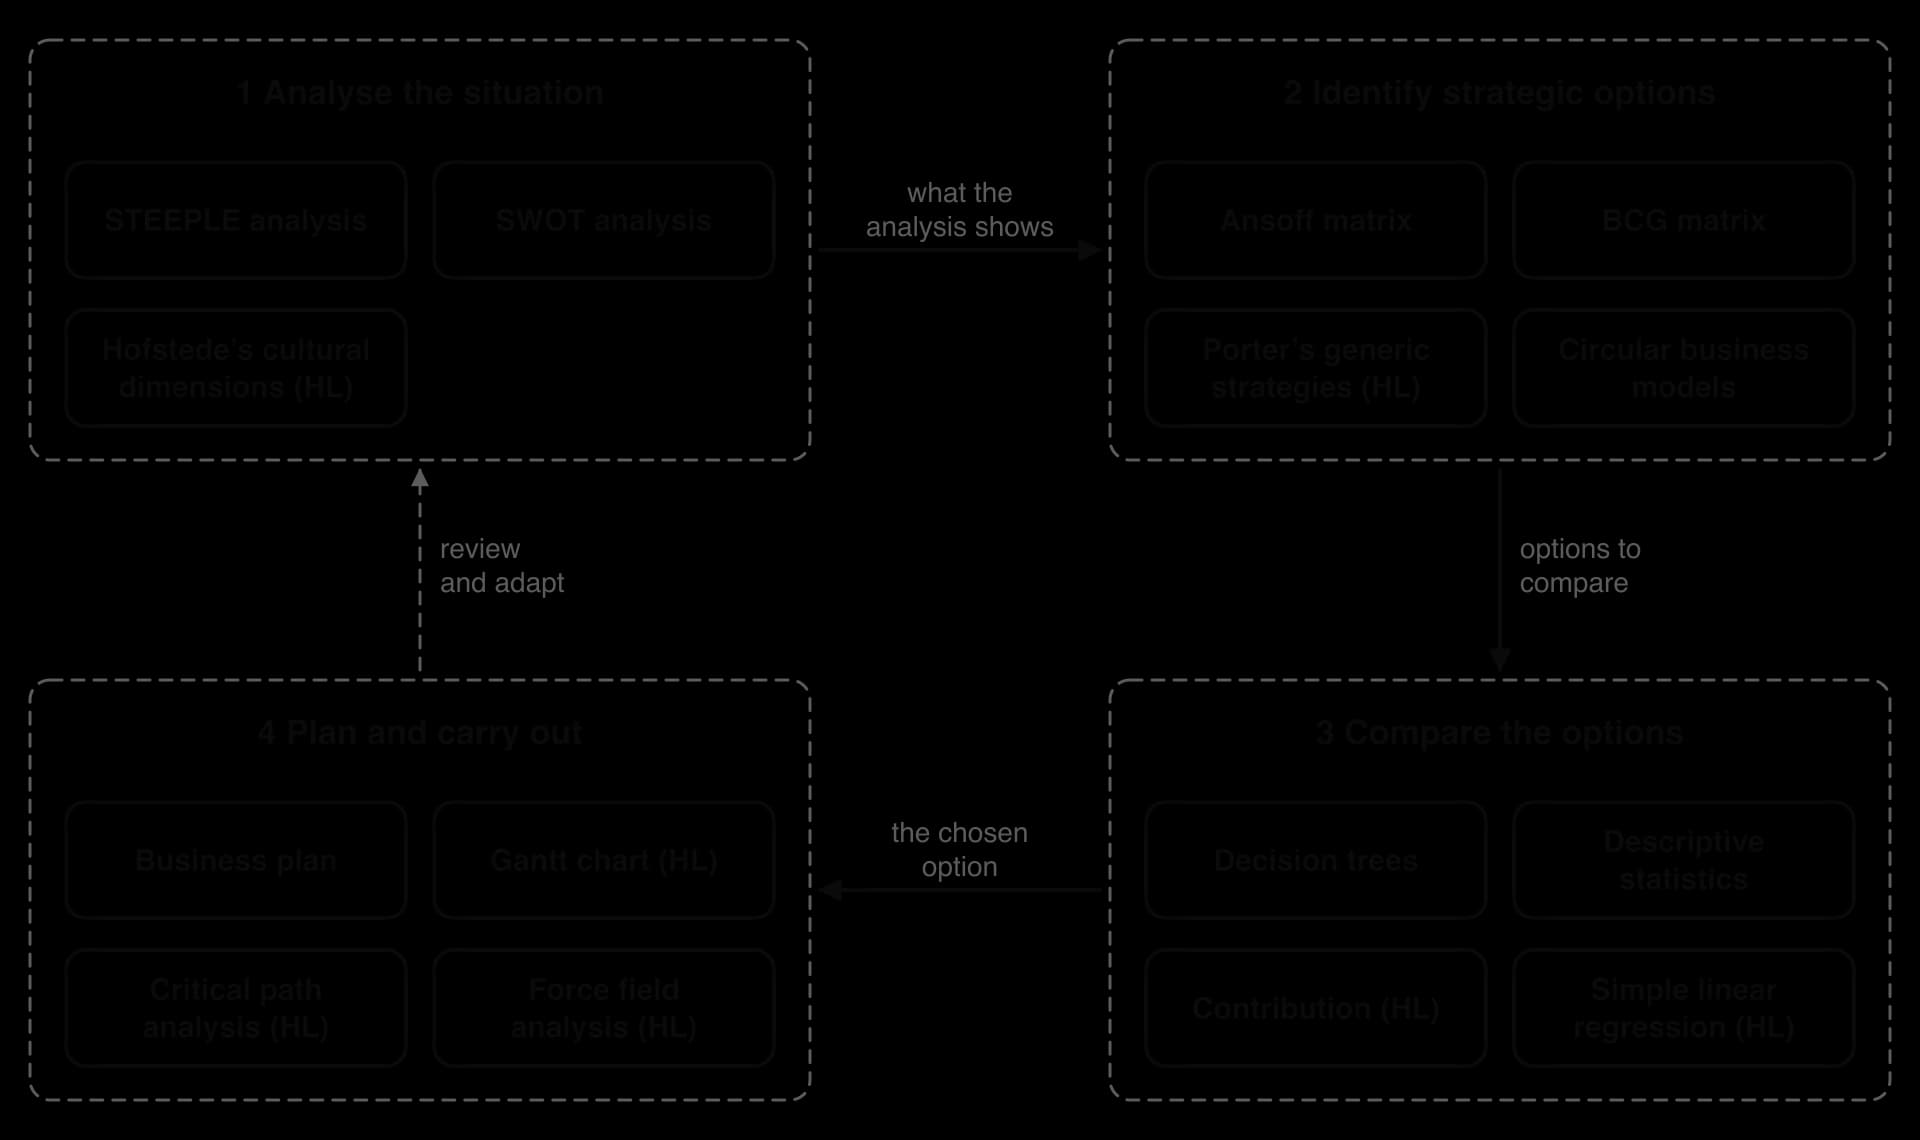
The concept map groups the tools by stage. STEEPLE analysis identifies the external factors that become the opportunities and threats of a SWOT analysis, and at HL Hofstede’s dimensions add the cultural differences between markets. The strategic options that follow can be classified with the Ansoff matrix, the BCG matrix or, at HL, Porter’s generic strategies, while circular business models add options that reduce waste.
Comparing the options needs numbers. A decision tree weighs options by their expected value, descriptive statistics summarise the data behind them, and at HL contribution and simple linear regression add cost decisions and forecasts. Break-even analysis, investment appraisal and ratio analysis from the units do the same job.
A business plan draws on tools from every stage, from a SWOT analysis to the cash flow forecast and break-even figures of its financial plan. At HL, a Gantt chart and critical path analysis schedule the project, and force field analysis helps managers prepare for resistance to the change.
Judging the output of a tool
A tool organises information; it does not make the decision. Its result is only as good as the data put in and the judgment of the person using it.
Reliability of the data put in
Quantitative tools depend on estimates. The probabilities and payoffs in a decision tree, the durations in a network diagram and the sales forecast in a business plan are usually predictions, often made by managers who want a project to go ahead. Data may also be out of date: a STEEPLE analysis can be overtaken within months by a change in interest rates or the law.
Subjectivity of the result
Qualitative tools depend on judgment. Two managers can place the same factor as a strength or a weakness, score the same force as strong or weak, or place a product in a different BCG category depending on how they define the market. A tool that looks objective, such as a force field diagram with numerical scores, still rests on choices about which factors to include and how to weigh them.
Change, creativity, ethics and sustainability in the toolkit
Any tool can be used to study one of the four key concepts, and some suit a concept particularly well.
Key concept | How it shows up in the toolkit |
|---|---|
Change | Force field analysis weighs what drives and resists a change; STEEPLE analysis shows which external changes matter most. |
Creativity | New strategic options come from a SWOT analysis or the Ansoff matrix, and new ways of earning revenue from circular business models. |
Ethics | A tool includes only the factors its user puts in: a decision tree with financial payoffs alone leaves out the effect on workers or communities. |
Sustainability | Circular business models are sustainability tools in their own right, and every STEEPLE analysis includes environmental and ethical factors. |
How SL and HL differ
SL students use the eight tools T.1–T.8. HL students use all fifteen; the seven HL-only tools are:
T.9 Force field analysis: driving forces and restraining forces, scored for strength, and strategies to strengthen or weaken them.
T.10 Gantt chart: tasks, durations, dependencies and milestones, constructed from a task list.
T.11 Hofstede’s cultural dimensions: the six dimensions, such as power distance and uncertainty avoidance, applied to HR, leadership and international marketing.
T.12 Porter’s generic strategies: cost leadership, differentiation and focus, and the risk of being stuck in the middle.
T.13 Contribution: make or buy analysis, contribution costing and absorption costing.
T.14 Critical path analysis: completing and analysing a network diagram, identifying the critical path and calculating total float and free float.
T.15 Simple linear regression: scatter diagrams, correlation, the line of best fit, interpolation and extrapolation.
Assessment
The toolkit is assessed across every component rather than in one paper. In Paper 1 and Paper 2, questions ask students to construct or complete a tool, such as a decision tree, a SWOT analysis or a BCG matrix from data, and extended responses reward the relevant use of tools to support an argument. At HL, Paper 2 can also ask for a Gantt chart, a critical path network to complete, a scatter diagram or a contribution calculation, but HL-only tools never appear in Paper 1.
In Paper 3, the recommended plan of action is marked partly on the effective use of tools and theories, and in the internal assessment the business research project has a criterion for selecting and applying tools that are relevant to the research question.
Studying the toolkit
Flashcards for T
The official decks for this part of the syllabus.
- T.1 SWOT analysis100 cards
- T.10 Gantt chart87 cards
- T.11 Hofstede’s cultural dimensions88 cards
- T.12 Porter’s generic strategies101 cards
- T.13 Contribution102 cards
- T.14 Critical path analysis95 cards
- T.15 Simple linear regression93 cards
- T.2 Ansoff matrix96 cards
- T.3 STEEPLE analysis105 cards
- T.4 Boston Consulting Group (BCG) matrix108 cards
- T.5 Business plan125 cards
- T.6 Decision trees75 cards
- T.7 Descriptive statistics135 cards
- T.8 Circular business models124 cards
- T.9 Force field analysis81 cards
Carry on with T in Augment
With a free account, Augment remembers where you stopped and what you have practiced.