Notes on T.11 Hofstede’s cultural dimensions
Learning objectives
Describe the six dimensions of Hofstede’s model of national culture.
Explain what high and low scores on each dimension suggest about behaviour at work and as consumers.
Construct a comparison of two or more countries’ scores and identify the largest differences.
Apply the dimensions to human resource management, leadership, organisational culture, communication and international marketing.
Analyse a real business decision using Hofstede’s cultural dimensions.
Evaluate the usefulness and limitations of the model.
Introduction
People from different countries often hold different expectations about authority, teamwork, rules, success and how to spend their time and money. Hofstede’s cultural dimensions are a way of measuring and comparing these expectations, so that managers can predict where cultural differences are likely to affect their employees, partners and customers.
The model links closely to the key concepts. It helps managers handle change when a business enters a new country or merges with a foreign firm, and it raises questions of ethics, because describing a whole nation with six numbers can turn into stereotyping if it is used carelessly.
What Hofstede’s model measures
National culture is the set of shared values, beliefs and unwritten rules that most people in a country learn as they grow up. Geert Hofstede, a Dutch social psychologist, called it “the software of the mind”, because it shapes how people think and act without their being aware of it.
Hofstede built his model from surveys of the values of IBM employees in many countries, carried out in the late 1960s and early 1970s. Because the employees did similar jobs for the same company, differences in their answers were likely to come from their national cultures rather than from their work. He identified four dimensions from this data. Two more, long-term orientation and indulgence, were added later from other studies and appear in the 2010 edition of his book Cultures and Organizations.
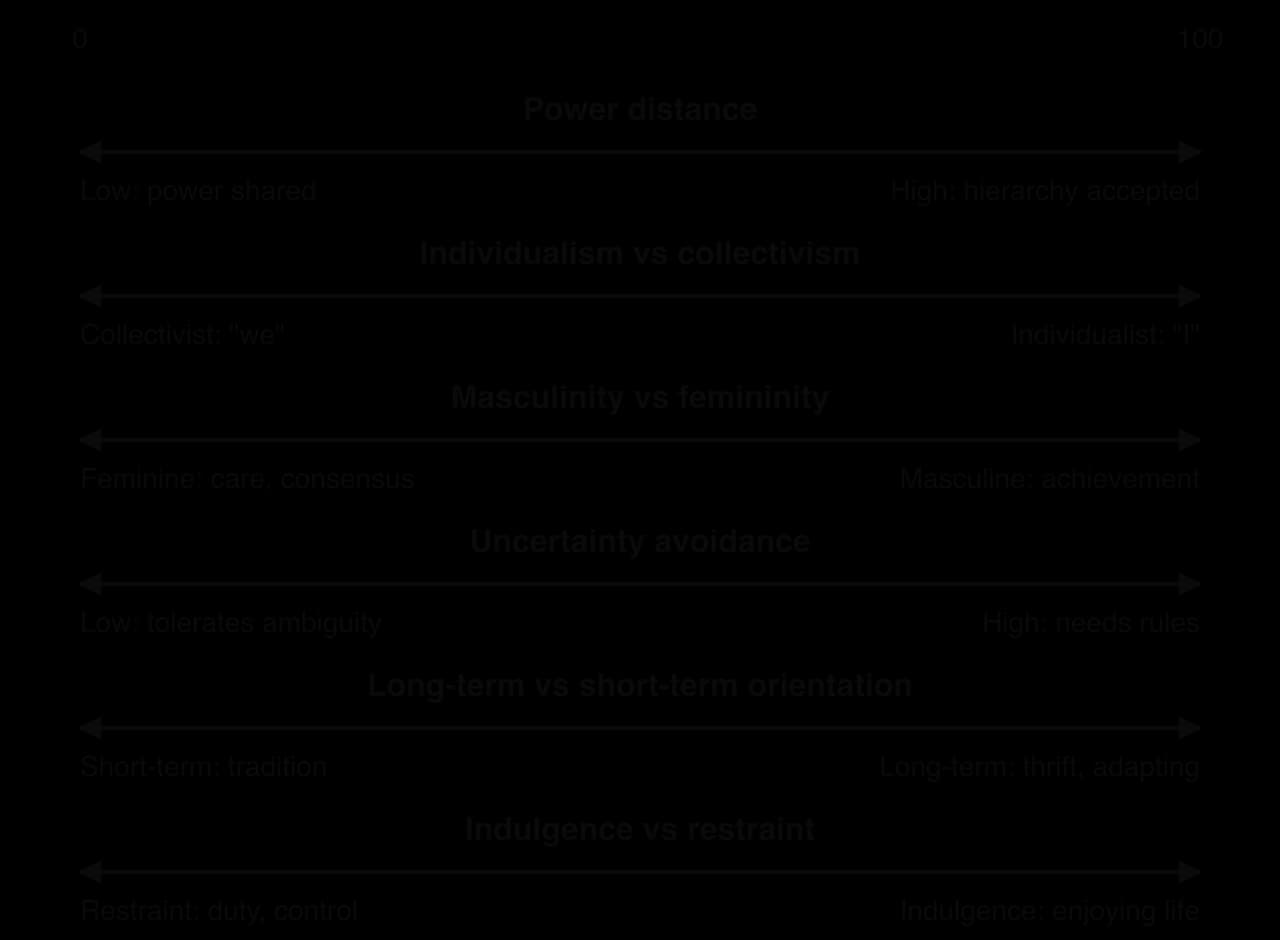
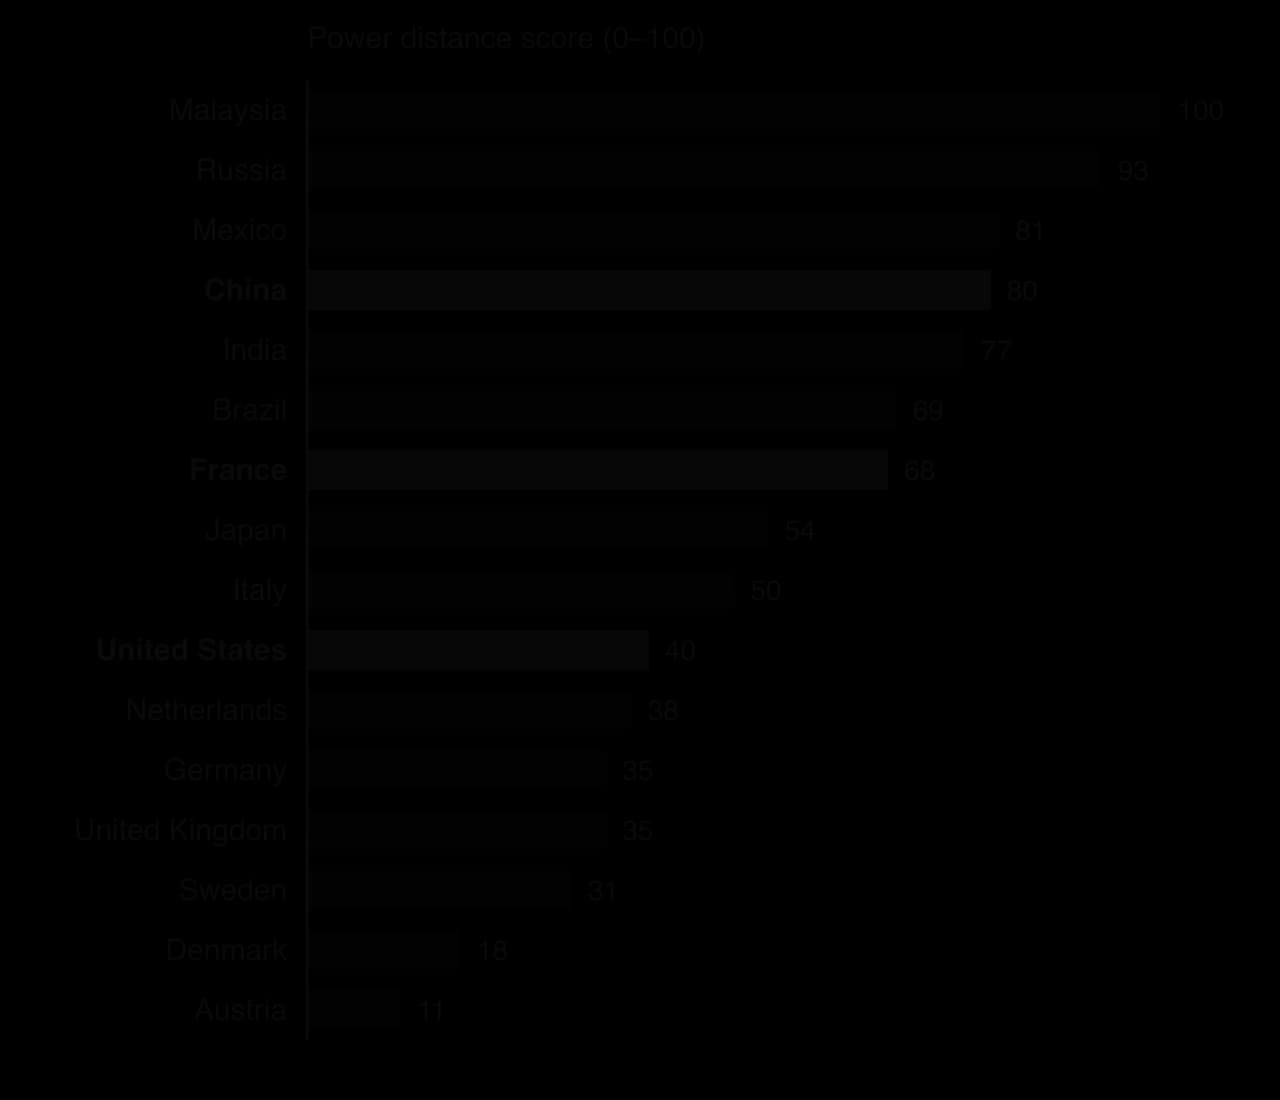
The scale diagram shows each dimension as a line between two opposite poles. A score has meaning only in comparison with other countries. A power distance score of 68 for France says that French society accepts more inequality of power than the United States (40) or Denmark (18), and less than China (80). The scores are kept up to date by The Culture Factor (formerly Hofstede Insights), which publishes them for over 100 countries and revises them when new research is published.
The six dimensions
Power distance
Power distance measures how far the less powerful members of a society expect and accept that power is distributed unequally. It is about attitudes to hierarchy: whether a junior employee expects to be told what to do or to be consulted.
Low power distance (e.g. Austria 11, Denmark 18) | High power distance (e.g. Malaysia 100, Russia 93) |
|---|---|
Managers consult employees; subordinates expect to be involved in decisions | Managers decide; subordinates expect to be told what to do |
Flat structures, wide spans of control, informal relations with the boss | Tall structures, many levels, formal titles and respect for seniority |
Status symbols are played down | Status symbols and privileges for senior staff are normal |
Employees may openly question or criticise a manager | Disagreeing with a superior in public is avoided |
The bar chart shows how widely power distance varies, from 100 in Malaysia to 11 in Austria. Power distance has clear links to organisational structure and leadership. Democratic leadership, delayering and empowerment fit low power distance cultures. In high power distance cultures, employees may see a manager who asks for their views as weak or unsure, and paternalistic leadership, in which a caring but firm leader makes decisions on behalf of the group, may be more effective.
 YouTube
Individualism versus collectivism
This dimension measures whether people see themselves mainly as independent individuals (“I”) or as members of groups such as the extended family, the clan or the organisation (“we”). In an individualist culture, people look after themselves and their close family; in a collectivist culture, people belong to groups that protect them in return for loyalty.
Individualist cultures (Netherlands 100, Sweden 87, United Kingdom 76): individual targets, appraisal and pay are accepted; people say what they think; tasks come before relationships; recruitment is based on skills and rules.
Collectivist cultures (Nigeria 0, Indonesia 5, India 24): group harmony matters; criticism in public causes loss of face; relationships come before tasks; family and personal connections affect hiring and business deals; team rewards may work better than individual bonuses.
Individualism also affects marketing. Advertising in individualist cultures often stresses personal choice, self-expression and the benefits to the buyer; in collectivist cultures it more often shows families and groups, and recommendations from friends and family carry great weight.
Masculinity versus femininity
Hofstede’s original names for this dimension are masculinity and femininity; The Culture Factor now calls it “motivation towards achievement and success”. A high score means a society driven by competition, achievement and success, in which winning and status are admired. A low score means a society in which caring for others and the quality of life matter most and standing out from the crowd is not admired.
High scores (Japan 95, Austria 79, Italy 70): long working hours and competition between employees are accepted; performance-related pay, rankings and promotions motivate; conflicts are resolved by fighting them out; advertising stresses performance, status and being the best.
Low scores (Sweden 5, Netherlands 14, Denmark 16): work–life balance and flexible working are valued; decisions are made by consensus; good managers are supportive; advertising stresses quality of life, care and sustainability.
The dimension is about the values a society rewards, not about men and women as individuals. Hofstede describes masculine societies as much more openly gendered than feminine ones, with sharper differences between the roles expected of men and women.
Uncertainty avoidance
Uncertainty avoidance measures how uncomfortable people feel in unclear, unknown or unstructured situations, and how far they try to avoid them through rules, plans and fixed routines.
High uncertainty avoidance (Russia 95, Japan 92, France 86): detailed rules, procedures and contracts; experts are trusted; careful planning before acting; change and new products are adopted slowly; consumers prefer known brands, guarantees and detailed product information.
Low uncertainty avoidance (Singapore 8, Denmark 23, United Kingdom 35): fewer rules; tolerance of different opinions; comfort with improvisation and risk-taking; new products and ideas are tried readily.
High uncertainty avoidance shapes how a business manages change. Employees are likely to resist a sudden reorganisation unless it is explained in detail and planned step by step, and customers may need trials, guarantees and expert endorsements before they try an unfamiliar brand.
Long-term versus short-term orientation
This dimension measures how a society links its past with its present and future. Long-term oriented societies value thrift, persistence and adapting traditions to new circumstances in order to prepare for the future. Short-term oriented societies value tradition, stability and meeting social obligations now, and are more suspicious of change.
Long-term orientation (Japan 100, South Korea 86, China 77): high saving rates; investment for long-term market share rather than quick profit; acceptance that results may take years; willingness to adapt traditions pragmatically.
Short-term orientation (Colombia 6, Nigeria 8, Egypt 22): respect for tradition and established ways; an emphasis on quick results; spending rather than saving; strong national pride.
Long-term orientation affects how businesses set objectives and judge managers. Businesses from long-term oriented cultures are often willing to accept several years of losses to build a position in a new market, while shareholders in short-term oriented cultures may press for profits in the current year.
Indulgence versus restraint
The newest dimension measures how far people try to control their desires and impulses. Indulgent societies allow relatively free enjoyment of life, leisure and having fun; restrained societies control gratification through strict social norms and see duty, rather than freedom, as the normal state of life.
Indulgent cultures (Mexico 97, Sweden 78, United Kingdom 69): leisure and friends are important; people are optimistic and spend on enjoyment; marketing that stresses fun, pleasure and treating oneself works well.
Restrained cultures (Egypt 0, Russia 20, China 24): leisure is less valued; spending on enjoyment may be seen as wasteful; marketing that stresses practicality, value and duty to the family may work better.
Dimension | A high score suggests… | A low score suggests… | Most affected business areas |
|---|---|---|---|
Power distance | Acceptance of hierarchy; top-down decisions | Equality; consultation and participation | Structure, leadership, communication |
Individualism | Independence; individual targets and rewards | Group loyalty; team rewards; relationships first | HR, motivation, marketing |
Masculinity | Competition, achievement, status | Cooperation, care, quality of life | Motivation, rewards, advertising |
Uncertainty avoidance | Rules, planning, known brands | Flexibility, risk-taking, new ideas | Change management, product launches |
Long-term orientation | Thrift, persistence, long-term objectives | Tradition, quick results | Objectives, investment, finance |
Indulgence | Enjoyment, leisure, spending | Restraint, duty, saving | Marketing, working conditions |
 YouTube
Using the model step by step
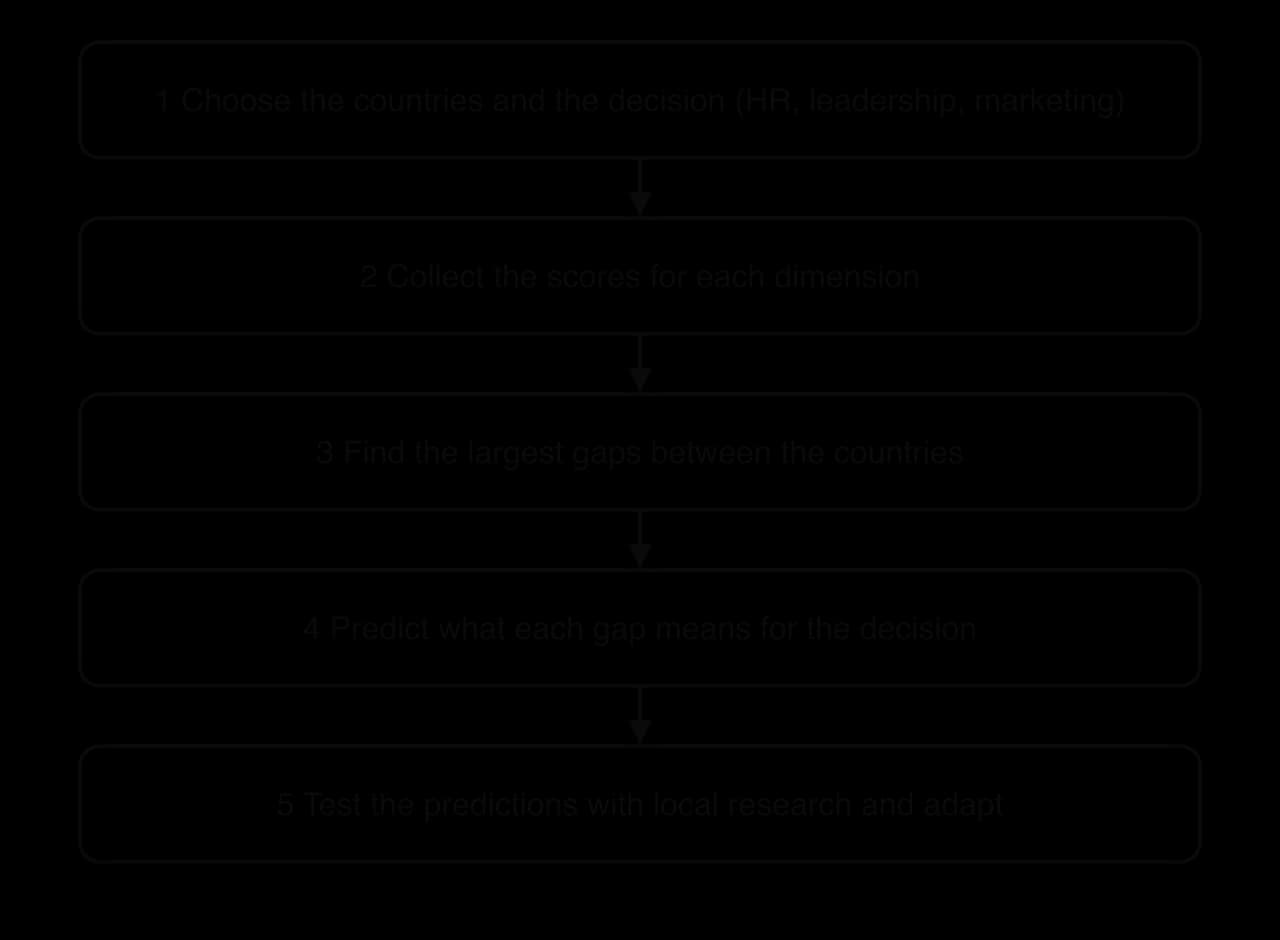
The model is most useful when it is applied to a particular decision, such as opening a subsidiary, appointing a manager or launching an advertising campaign in a new country. The flow chart sets out the five steps of the process.
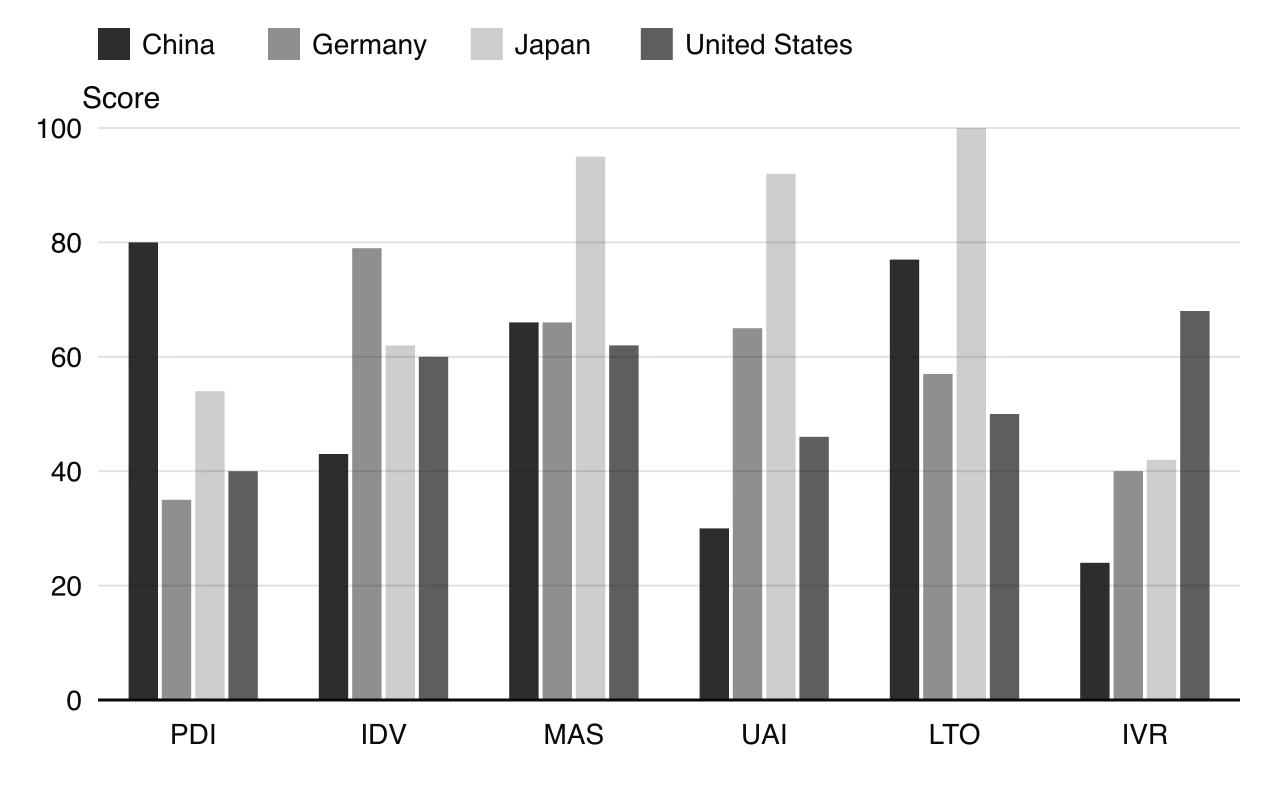
The country profile chart shows step 2 for four countries. Germany scores low on power distance and high on individualism and uncertainty avoidance; China scores high on power distance and long-term orientation and low on uncertainty avoidance; Japan scores very high on masculinity, uncertainty avoidance and long-term orientation; the United States scores high on indulgence and moderately on most other dimensions.
Applications across business management
The model is used wherever people from different national cultures work together or where a business sells to customers in another country.
Human resource management
In human resource management, national culture affects recruitment, training, appraisal and rewards. In individualist, masculine cultures, individual performance-related pay, open competition for promotion and direct appraisal feedback are widely accepted. In collectivist cultures, recruitment through personal networks is more common, team rewards may motivate better than individual bonuses, and an appraisal that criticises an employee directly may cause loss of face. High uncertainty avoidance cultures value job security, clear job descriptions and formal training.
Culture also affects how theories of motivation apply. Maslow’s hierarchy, with self-actualisation at the top, was developed in the United States, a highly individualist country; in collectivist cultures, belonging to a group and the group’s success may matter more to employees than personal achievement.
Leadership and management
Power distance and uncertainty avoidance shape which leadership styles employees expect. In low power distance cultures, democratic leadership, delegation and flat structures fit employees’ expectations; in high power distance cultures, more directive, autocratic or paternalistic styles may be accepted and even preferred. A manager transferred from one culture to another often needs to adjust their style, at least at first.
Organisational culture
Organisational culture is the culture of a business: its shared values and ways of working. It is shaped partly by the national culture of the founders and employees. When businesses from different countries merge, form a joint venture or work as partners, differences in national culture can cause culture clash, for example when managers from a low power distance culture expect open debate and their counterparts expect decisions to come from the top. The model helps managers anticipate these clashes and plan how to bring the two cultures together.
Communication
Cultural dimensions affect how directly people speak, who speaks to whom and how disagreement is handled. In low power distance, individualist cultures, communication tends to be direct and employees may contact senior managers without going through the hierarchy. In high power distance, collectivist cultures, messages are often indirect, criticism is softened, and communication follows the formal chain of command. Misunderstandings arise when a direct message is heard as rude or an indirect one is missed altogether.
International marketing
In international marketing, the dimensions help a business decide how far to adapt its marketing mix and which method of entry to use. They suggest, for example:
Promotion: individualist, indulgent cultures respond to messages of personal enjoyment and self-expression; collectivist cultures to messages about family and group belonging; high masculinity cultures to status and performance; high uncertainty avoidance cultures to expert endorsement, guarantees and detailed information.
Product and branding: high uncertainty avoidance consumers prefer established brands and are slower to adopt new products, so a new entrant may need trial offers and strong after-sales service.
Price: in restrained or long-term oriented cultures with high saving rates, value for money and durability may matter more than novelty.
People and processes: in high power distance cultures, customers may expect formal, respectful service and visible status differences.
Method of entry: the greater the cultural distance between home and host country, the stronger the case for a local partner, such as a joint venture or a franchisee, that understands local customers.
Evaluation of Hofstede’s cultural dimensions
Strengths of the model
Simple and comparable. Six numbers per country make it quick to compare cultures and to spot the differences most likely to matter.
Based on large-scale research. The original data came from a very large survey, and the dimensions have been tested and extended by many later studies.
Widely used. Managers, trainers and researchers share a common language for discussing culture, which helps communication in multinational teams.
Practical. It turns vague ideas about “cultural differences” into specific predictions about leadership, rewards and marketing that can be tested.
Limitations of the model
National averages. A country score hides large differences between individuals, regions, generations and social groups. Canada’s power distance score is 39, but Hofstede’s published data give French-speaking Canada a separate score of 54, and Belgium’s Dutch-speaking and French-speaking communities also have separate scores.
Risk of stereotyping. Applying a national score to an individual employee or customer can lead to wrong and unfair assumptions, which raises ethical concerns.
Dated and changing data. The original survey was carried out more than fifty years ago, and cultures change with economic development, migration, technology and globalisation. The scores themselves are revised, and the published versions differ widely for some countries.
The original sample. IBM employees were not typical of their countries’ populations: most were educated, urban and working for one American company.
Nations are not the only cultures. Professional, industry and organisational cultures can matter more than national culture, for example among engineers or doctors who share a professional training.
The dimensions are models. They are statistical constructs, not facts “out there”; other researchers, such as Trompenaars and the GLOBE project, divide culture in different ways.
The changes between versions of the scores are large enough to change the conclusions of an analysis. The Culture Factor’s latest update, in October 2023, revised the individualism and long-term orientation scores using a newer study by Minkov and Kaasa (2022).
Country | Individualism: 2010 book data | Individualism: 2023 update | Long-term orientation: 2010 book data | Long-term orientation: 2023 update |
|---|---|---|---|---|
United States | 91 | 60 | 26 | 50 |
China | 20 | 43 | 87 | 77 |
India | 48 | 24 | 51 | 51 |
Japan | 46 | 62 | 88 | 100 |
Germany | 67 | 79 | 83 | 57 |
The United States, for decades presented in textbooks as the most individualist country in the world with a score of 91, now scores 60, below the Netherlands, Sweden and the United Kingdom. China’s individualism score more than doubled. An analysis based on the older figures would reach different conclusions about the size of the gap between, for example, US and Chinese employees.
Sources: Hofstede, G., Hofstede, G. J. and Minkov, M., Cultures and Organizations (2010), dimension data matrix version 2015-12-08, geerthofstede.com; The Culture Factor, country comparison tool and “Source of country scores”, accessed October 2026.
Judgment: how useful is the model?
Hofstede’s model is most useful as a starting point: a quick, structured way of identifying where cultural differences are likely to affect a decision and of preparing managers and marketers for them. It is least useful when treated as a precise description of real people. Its value depends on how large the gap between countries is (small differences of a few points mean little), how recent the scores are, how similar the target group is to the national average, and whether the predictions are checked through local research and local staff before decisions are made.
Case study: Euro Disney
The Walt Disney Company opened Euro Disney Resort at Marne-la-Vallée, east of Paris, on 12 April 1992. After the success of Tokyo Disneyland, which opened in 1983, Disney expected a park close to the centre of Europe to attract millions of visitors a year. Euro Disney was built largely on the American model: American-style attractions, restaurants with an American menu, and Disney’s standard practices for running a park.
Some French intellectuals were openly hostile before the park opened. Critics called the project “Euro Disgrace” and “a cultural Chernobyl”. One policy in particular clashed with local custom. Following the practice of its American parks, Euro Disney served no alcohol inside the park, although wine with meals is a normal part of French and much of European life; visitors had to leave the park to buy a drink at a hotel bar.
Attendance and spending were below forecasts in the early years, partly because of a European recession, and Euro Disney made heavy losses. It lost 1.8 billion French francs in the year to September 1994 alone. In June 1993, it began serving wine, beer and champagne in four restaurants inside the park. In 1994 its banks and the Walt Disney Company agreed a financial restructuring, and in October 1994 it was renamed Disneyland Paris.
It’s mainly in response to our non-French European visitors. Visitors from Germany or England want wine because it’s part of the French experience.
— Yves Boulanger, spokesman for Euro Disney, quoted by the Associated Press in The New York Times, 12 June 1993
Hofstede’s scores help to analyse the cultural distance between the American model and the French market. The largest gaps are in uncertainty avoidance (France 86, United States 46) and power distance (68 and 40), followed by indulgence (48 and 68) and masculinity (43 and 62).
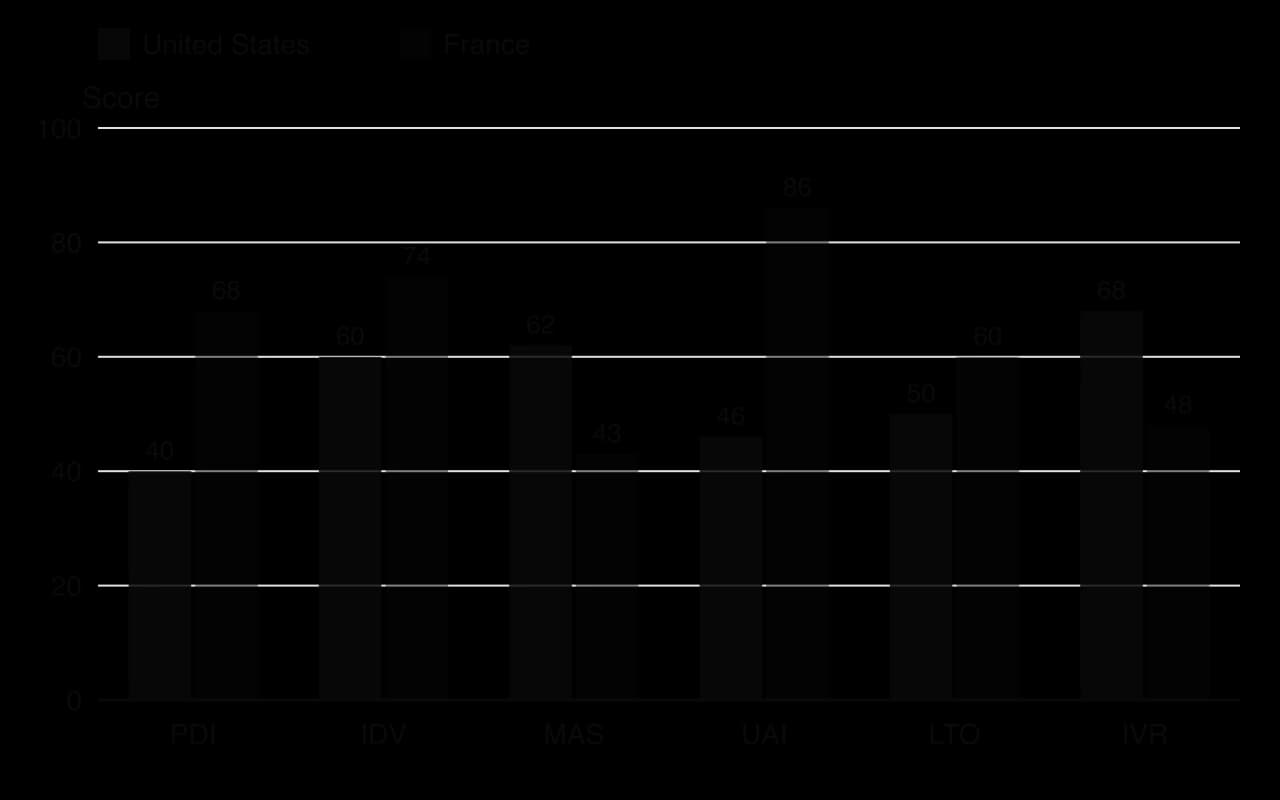
The model suggests several pressures. French visitors’ higher uncertainty avoidance points to a preference for the familiar, which may help to explain the slow take-up of an unfamiliar American format and the importance of reassuring visitors on value and quality.
The lower indulgence score suggests that French families might be less willing than American ones to spend heavily on a day of pure entertainment. For employees, the model points in two directions: the higher power distance score suggests acceptance of a clear hierarchy, but France’s higher individualism (74 against 60) suggests resistance to rules that limit personal choice. Conflicting predictions of this kind are one reason the model must be tested with local research.
Euro Disney changed several of its policies. Alongside the change in alcohol policy, it cut entry prices and added attractions such as Space Mountain. In the year to September 1995 it made its first annual profit, 114 million francs, as attendance rose 21.5% to 10.7 million visitors, although the profit was helped by Disney temporarily waiving its royalties and fees. Tokyo Disneyland offers a contrast: it is owned and run by a Japanese company, Oriental Land Company, under a licence from Disney, so local managers made the operating decisions from the start.
The case also shows the limits of the model. The alcohol policy was a specific custom that none of the six scores predicts, and many of Euro Disney’s problems were financial: a recession, high interest costs and over-optimistic forecasts of attendance and spending. The scores used here come from The Culture Factor’s 2023 update, not from data collected at the time; the original 1970s data gave the United States a much higher individualism score of 91. Hofstede’s model is therefore best used alongside other tools, such as STEEPLE analysis, market research and financial analysis, when explaining the early difficulties of Euro Disney.
Using the scores in the chart, analyse which cultural differences between the United States and France were most likely to affect Euro Disney’s employees and visitors.
Explain why a licensing agreement with a local company, as at Tokyo Disneyland, might have reduced Euro Disney’s cultural risks.
To what extent can Hofstede’s cultural dimensions explain Euro Disney’s losses in 1992–1994?
Sources: Time, “Voila! Disney Invades Europe”, 20 April 1992; The New York Times, “Euro Disney Adding Alcohol”, 12 June 1993, and “Euro Disney Reports Profit for ’95, but the Future Remains Cloudy”, 16 November 1995; The Culture Factor, country comparison tool, accessed October 2026; Oriental Land Company.
Exam practice
Hofstede’s cultural dimensions are an HL tool, so they appear in Paper 2 for HL students and can be used in Paper 3. Questions may give you scores for two countries and ask you to analyse them, or expect you to apply the model to a business entering a new market, merging with a foreign firm or managing a multinational workforce.
Questions often start with a definition and an application of one dimension.
The final question is a 10-mark extended response.
Summary
Hofstede’s model compares national cultures on six dimensions, each scored roughly 0–100: power distance, individualism, masculinity, uncertainty avoidance, long-term orientation and indulgence.
Scores have meaning only in comparison: they describe a country’s average relative to other countries, never an individual.
Applying the model means collecting the scores, finding the largest gaps, predicting what each means for a decision and testing the predictions locally.
The dimensions help explain differences in leadership, structure, rewards, appraisal, communication and organisational culture, and guide adaptation of the marketing mix and the choice of method of entry.
The model is simple, comparable and widely used, but it relies on national averages, can lead to stereotyping, uses data that age and are revised, and ignores non-cultural factors.
The model is most useful as a starting point combined with local research and other tools such as STEEPLE and market research.
Self-check
- To do:
I can name and describe all six of Hofstede’s cultural dimensions.
- To do:
I can explain what high and low scores on each dimension suggest about employees and consumers.
- To do:
I can construct a table comparing two countries’ scores and identify the largest gaps.
- To do:
I can apply the dimensions to HR, leadership, organisational culture and communication.
- To do:
I can apply the dimensions to international marketing decisions, including the marketing mix and the method of entry.
- To do:
I can analyse a real case, such as Euro Disney, using the model.
- To do:
I can evaluate the usefulness and limitations of Hofstede’s model.