Notes on T.10 Gantt chart
Learning objectives
Define a project, a Gantt chart, a milestone and a dependency.
Distinguish between sequential tasks and parallel tasks.
Construct a Gantt chart from a list of tasks, durations and dependencies.
Identify the critical tasks, the float of each non-critical task and the minimum project duration from a Gantt chart.
Analyse a Gantt chart to judge whether a project is on schedule and explain the effect of a delay.
Explain the uses of Gantt charts in different areas of a business.
Explain the limitations of Gantt charts and how they relate to critical path analysis.
Introduction
A Gantt chart is a bar chart that shows the tasks of a project against time, so that managers can see what has to be done, in what order and by when. It is one of the most widely used planning tools in business, from the opening of a single shop to the construction of an airport.
Gantt charts connect with the key concepts in practical ways. Most projects exist because of change: a new product, a new location, a new computer system or a new way of working. A clear schedule helps managers to explain that change to employees and other stakeholders. Planning a project well also involves creativity, because managers often find a faster route to the deadline by running tasks at the same time or by reorganising the work.
Projects and project management
Much of what businesses do is routine: the same products are made, sold and delivered every day. Some work is different. It has a clear start and a clear end, a specific goal and a limited budget, and it will not be repeated in exactly the same form. Opening a new store, launching a product, moving to a new office and installing new software are all examples of a project.
Because a project is a one-off, managers cannot rely on habit to organise it. They have to break the work into tasks, estimate how long each task will take, decide what must happen before what, assign people and money, and then check that the work keeps to plan. This activity is called project management.
Project managers usually describe their targets as three linked constraints: time (the deadline), cost (the budget) and quality (what the finished project must achieve). A change in one usually affects the others. Finishing early may require overtime or extra workers, which raises cost; cutting cost may lengthen the schedule or reduce quality.
Poor planning can be very expensive. Berlin Brandenburg Airport was originally planned to open in October 2011, five years after construction started. Repeated problems, above all with the fire protection and alarm system, meant that it opened for commercial traffic only on 31 October 2020, and the budget of €2.83 billion set in 2009 rose several times.
What a Gantt chart shows
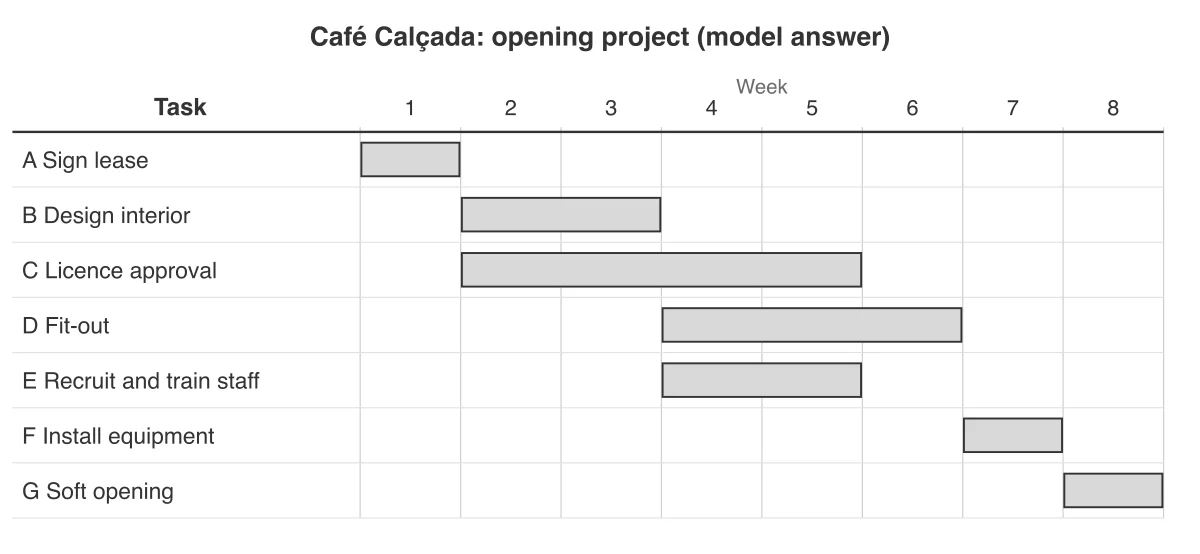
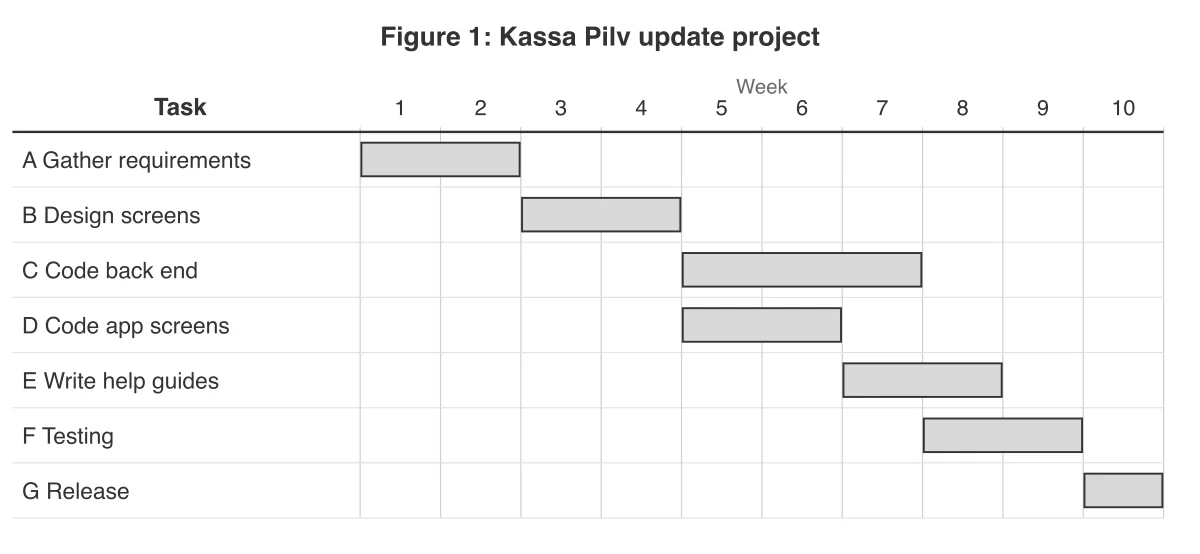
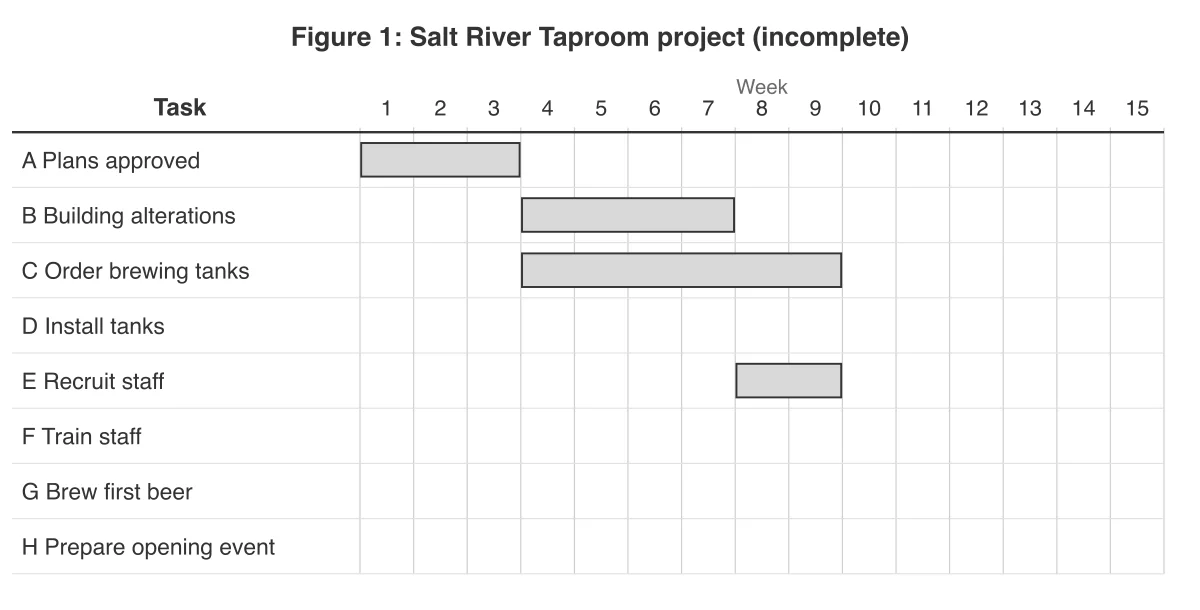
A Gantt chart has two dimensions. The tasks of the project are listed down the left-hand side, usually in the order in which they start. Time runs from left to right across the top, divided into equal periods such as days, weeks or months. Each task is drawn as a horizontal bar that starts at the period when the task begins; the length of the bar shows the task’s duration.
Reading down a column of the chart shows which tasks are under way in a given period; reading along a row shows when one task starts and finishes. Because every bar sits on the same time scale, a manager can see at a glance which tasks overlap, which follow one another and when the whole project should end.
The chart is named after Henry Gantt (1861–1919), an American engineer and management consultant who designed it around 1910–1915. Gantt first used it for routine operations, to measure the productivity of workers, rather than to plan projects. A similar chart, the “harmonogram”, had been developed by the Polish engineer Karol Adamiecki in 1896, but he published only in Polish and Russian, so it was little known elsewhere. One of the first major uses of Gantt’s charts was by the United States during the First World War.
Today almost all Gantt charts are drawn with project management software, which redraws the chart automatically when a date changes. The principles are the same whether the chart is drawn by hand on squared paper or produced by a computer.
Tasks, durations and dependencies
Before a Gantt chart can be drawn, the project has to be broken down into tasks. Each task needs three pieces of information: a short description, an estimated duration in a chosen unit of time, and its dependencies.
Dependencies come from the logic of the work. Packaging cannot be printed until it has been designed; staff cannot be trained on new equipment until the equipment is installed. The most common type is the finish-to-start dependency, in which the later task starts when the earlier one finishes.
Sequential and parallel tasks
Tasks that depend on one another must be done in order, one after the other. These are sequential tasks. Tasks that do not depend on one another can be carried out at the same time, usually by different people or teams. These are parallel tasks.
Parallel tasks are the main way of shortening a project. If two tasks of three weeks each are done in sequence, they take six weeks; done in parallel, they take three. The limit is set by resources: two tasks can run in parallel only if there are enough people, machines and money to do both at once.
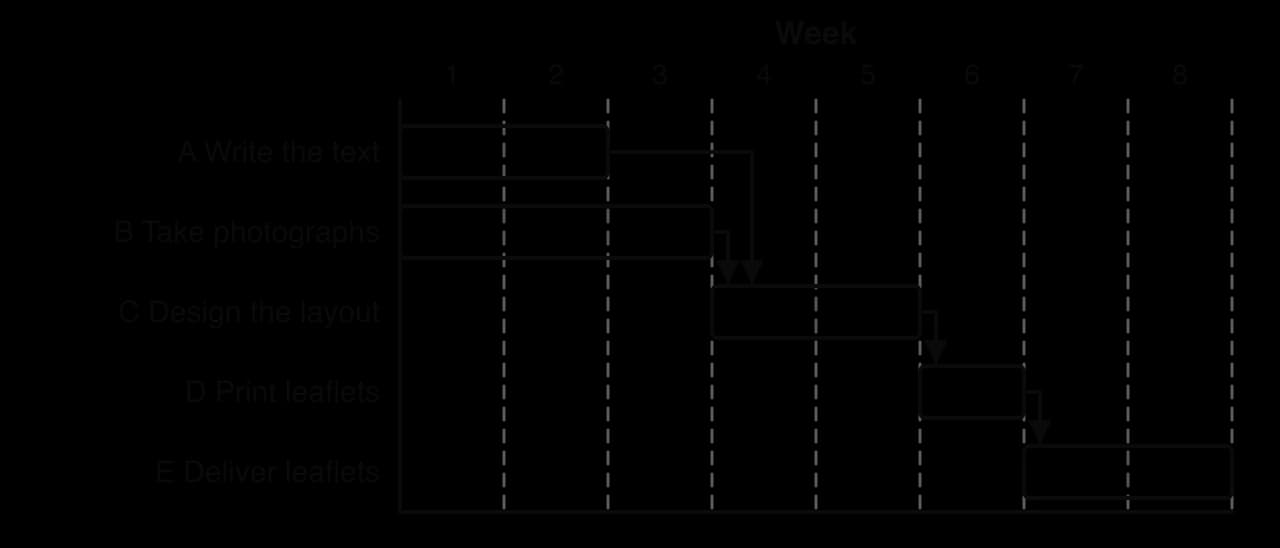
The leaflet campaign shows both kinds of task. Tasks A and B start together in week 1 because neither needs the other. Task C has two predecessors, so it starts only when the later of them, B, finishes at the end of week 3; the one-week gap after A is spare time. Tasks C, D and E then follow one another in sequence, and the whole campaign takes 8 weeks.
Milestones
A milestone marks an important point in a project rather than a piece of work. Typical milestones are the signing of a contract, the approval of a design, the end of a phase or the launch date. A milestone takes no time, so on a Gantt chart it is drawn as a symbol, usually a diamond, rather than a bar.
Milestones help managers and stakeholders to judge progress without reading every task. Investors may release the next instalment of finance when a milestone is reached, and senior managers often review a project only at its milestones. A missed milestone is an early warning that the final deadline is at risk.
Constructing a Gantt chart step by step
A Gantt chart is constructed from a task list that gives each task’s duration and its predecessors. The same seven steps work for any project, however large.
List the tasks with a letter for each, its duration and its predecessors (the tasks that must finish first).
Draw the time axis across the top, with equal periods numbered from 1, and enough periods for the whole project.
List the tasks down the left-hand side, in order of their earliest start.
Find each task’s earliest start. A task with no predecessors starts at time 0 (the start of period 1). Any other task starts when the last of its predecessors finishes.
Draw each bar from its earliest start for the length of its duration.
Find the project duration: the latest finishing time of any task. Add milestones as diamonds.
Mark the critical tasks (the chain of tasks with no spare time) and, if asked, the float of the others.
Step 4 is the most important step. It is the same calculation as the earliest start time in critical path analysis, carried out task by task from the start of the project. Working through the tasks in order and writing each start and finish time in a table makes it hard to make a mistake.
The worked example applies the method to a café owner who plans to open a second café. The tasks, their durations and their dependencies are given in the table (hypothetical data).
Task | Description | Duration (weeks) | Preceded by |
|---|---|---|---|
A | Sign the lease and obtain permits | 3 | — |
B | Design the interior | 2 | — |
C | Refit the shop | 4 | A, B |
D | Order the equipment | 2 | B |
E | Install the equipment | 1 | C, D |
F | Recruit staff | 3 | A |
G | Train staff | 2 | E, F |
H | Marketing campaign | 3 | A |
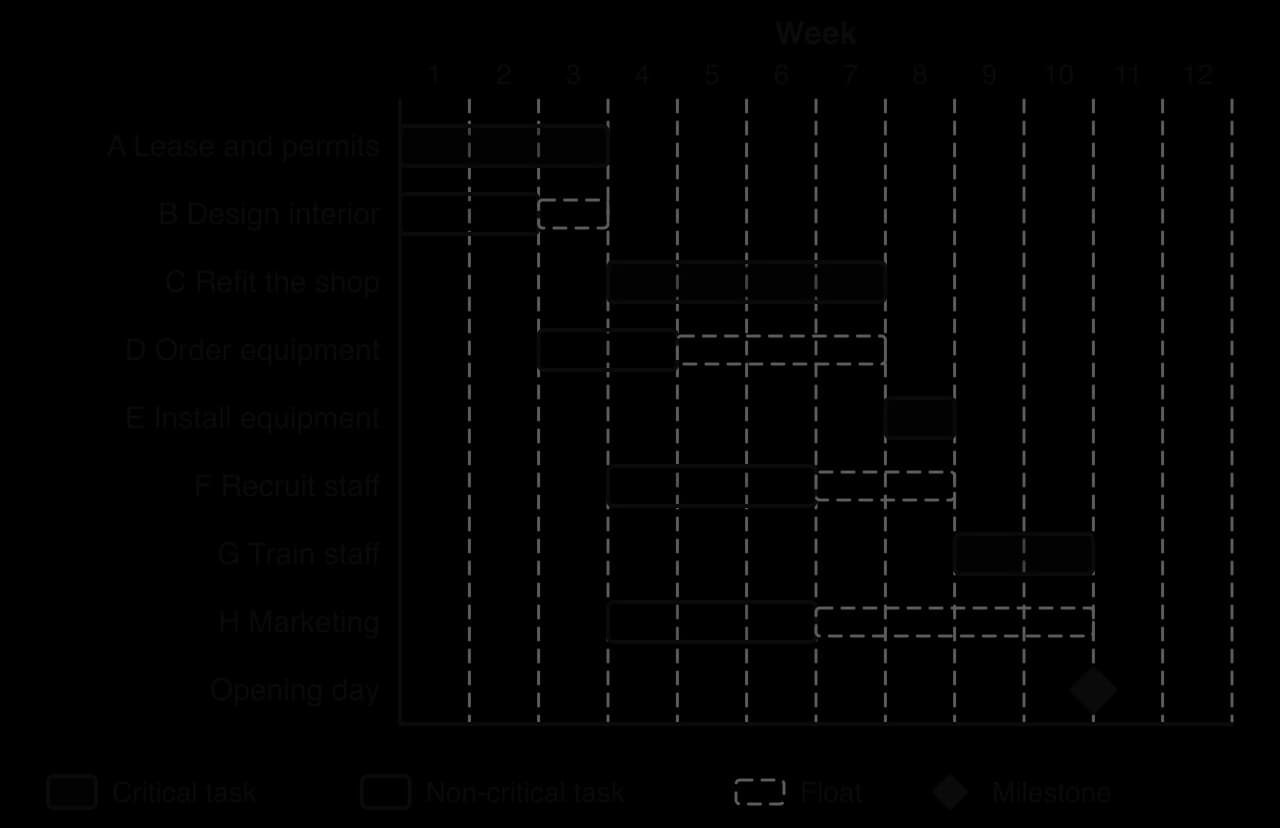
The finished chart shows the whole plan on one page. Several tasks run in parallel in weeks 4–6 (the refit, recruitment and marketing), which is why the project takes 10 weeks rather than the 20 weeks that the durations add up to. The opening-day milestone at the end of week 10 is the date that the owner can announce to suppliers, staff and customers.
Critical tasks and float
Some tasks can be delayed without affecting the end date of the project; others cannot. A critical activity (a critical task) is one with no spare time: if it starts late or takes longer than planned, the whole project finishes late. The chain of critical tasks from the start to the end of a project is its critical path, and its total duration is the shortest time in which the project can be completed.
A non-critical task has float: the amount of time it can be delayed without delaying the project. On a Gantt chart, float is often drawn as a dashed or lighter extension after the bar, running up to the latest time by which the task must finish. Float is measured precisely, and divided into total float and free float, in critical path analysis; a Gantt chart shows the same idea visually.
Task | Earliest finish (end of week) | Latest finish without delaying the opening (end of week) | Float (weeks) | Critical? |
|---|---|---|---|---|
A Lease and permits | 3 | 3 | 0 | Yes |
B Design interior | 2 | 3 | 1 | No |
C Refit the shop | 7 | 7 | 0 | Yes |
D Order equipment | 4 | 7 | 3 | No |
E Install equipment | 8 | 8 | 0 | Yes |
F Recruit staff | 6 | 8 | 2 | No |
G Train staff | 10 | 10 | 0 | Yes |
H Marketing | 6 | 10 | 4 | No |
Each latest finish is found by working backwards from the opening date. G must finish by week 10, so E must finish by week 8 (10 − 2), and so must F. C and D must finish by week 7, because E starts then. B must finish by week 3, because C cannot start before week 3 anyway (it also waits for A). Marketing, H, has only the opening as its successor, so it can finish as late as week 10 and has four weeks of float.
Float gives managers flexibility. Staff and equipment can be moved from a task with float to a critical task that is falling behind, and non-critical tasks can be scheduled later to even out the workload or to delay spending. A task with plenty of float, such as marketing, could start later so that the campaign is fresher when the café opens.
Reading progress and controlling a project
A Gantt chart is used during a project as well as before it. Managers compare the work actually completed with the plan and act when the two differ. On the chart, a vertical line marks the current date (often labelled “Today”) and the completed part of each bar is shaded or hatched. Any bar to the left of the line that is not fully shaded is behind schedule; any bar shaded beyond the line is ahead.
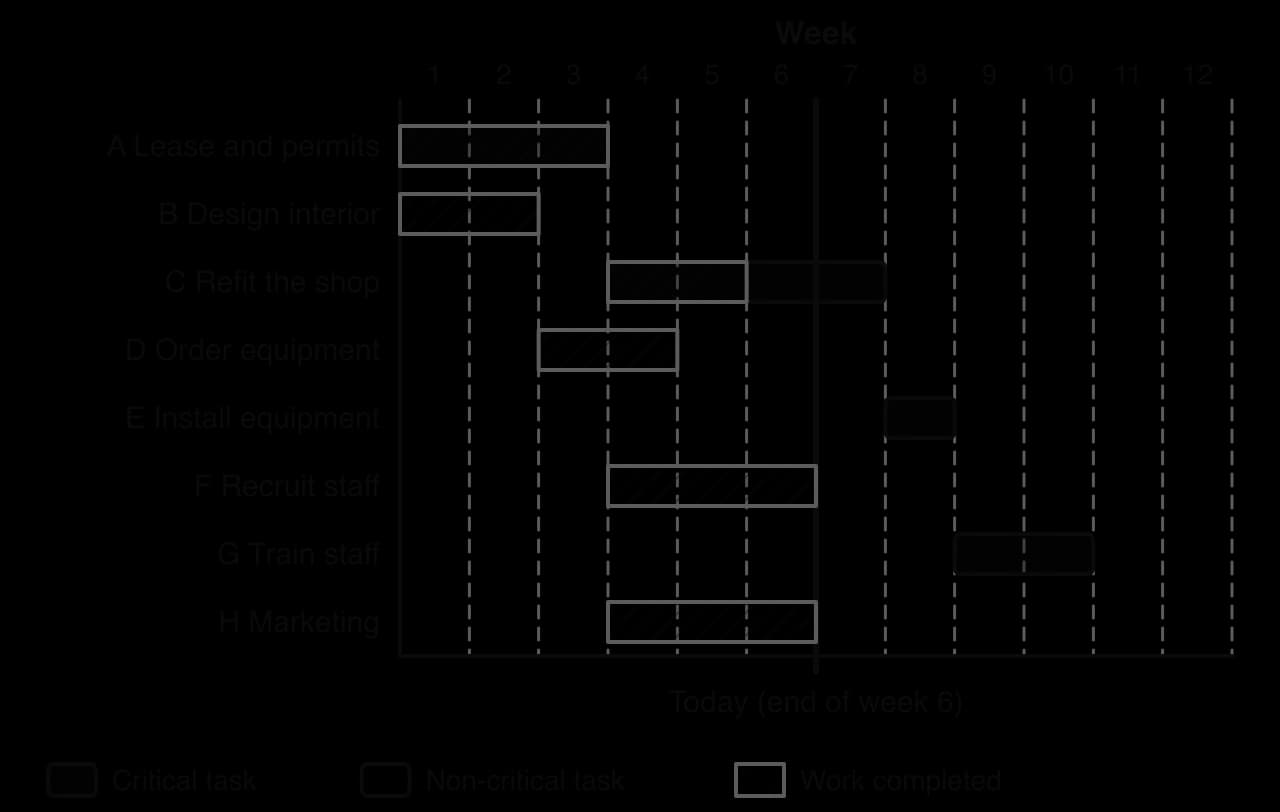
The progress check identifies a delay that the original plan could not have shown. The lease, design, equipment order, recruitment and marketing are all complete, but the refit is one week behind. If nothing changes, C finishes at the end of week 8 instead of week 7, installation moves to week 9, training to weeks 10–11, and the café opens at the end of week 11. A delay to recruitment or marketing would not have mattered in the same way, because those tasks had float.
How managers bring a project back on schedule
When a critical task falls behind, managers have several options. Each one has a cost, so the choice depends on how much a late finish would cost the business compared with the cost of the remedy.
Add resources to the late critical task: overtime, extra contractors or more equipment. This raises cost and may reduce quality if new workers are rushed.
Move resources from tasks with float: workers on a non-critical task can help with a critical one, as long as the non-critical task does not use up all its float.
Overlap tasks: start part of the next task before its predecessor is completely finished (for example, install equipment in the finished half of the shop). This adds risk if the earlier work has to be changed.
Reduce the scope: open with a smaller menu or leave non-essential work until after the opening.
Accept the delay and move the milestone, telling stakeholders early. This may be the cheapest option if the deadline is flexible.
Honest reporting of progress is essential. The central section of London’s Elizabeth line (Crossrail) was due to open in December 2018; the delay was announced only at the end of August 2018, about four months before the planned date, and passenger services began on 24 May 2022. A chart is useful only when the progress entered into it is accurate, and managers under pressure to report good news face questions of ethics when they record progress.
Uses of Gantt charts across the business
Gantt charts are used wherever a business runs a project. They support planning, but they are also a communication tool: a single page shows every team when it is needed and what it depends on. The table gives examples from each area of business management.
Area | Example project | How the Gantt chart helps |
|---|---|---|
Human resource management | Recruiting and training staff for a new branch; introducing a new appraisal system | Shows when job adverts, interviews and training must happen so that staff are ready on the opening date |
Finance and accounts | Preparing the annual accounts; raising finance for an expansion | Sets deadlines for each stage and shows when spending occurs, which feeds the cash flow forecast |
Marketing | A product launch or an advertising campaign | Coordinates market research, design, production of materials, media bookings and the launch milestone |
Operations management | Building a new factory; installing a new production line; relocating | Schedules construction, equipment delivery, testing and training; shows the effect of supplier delays |
Research and development | Developing and testing a new product | Breaks a long project into phases with milestones (prototype, testing, approval) |
Information systems | Moving to a new management information system | Plans data migration, testing and staff training so that the old system is switched off only when the new one works |
Gantt charts are also part of many business plans, where an operations or implementation timetable shows lenders and investors that the entrepreneur has thought through how the plan will be carried out. In large organisations, a project with its own team and timetable may be run within a project-based organisation, and the Gantt chart becomes the shared plan for everyone in the team.
 YouTube
The video shows the chart as project managers use it in practice, with dependencies drawn as arrows between bars and milestones as diamonds. These conventions are the same as in the café example; software simply adds the ability to update the chart as the project changes.
Gantt charts and critical path analysis
Gantt charts and critical path analysis are two ways of presenting the same plan. Critical path analysis uses a network diagram of nodes and arrows to calculate the earliest and latest times of every activity and to identify the critical path precisely. A Gantt chart shows the same activities as bars on a time scale, which is easier to read and to update.
Feature | Gantt chart | Critical path analysis (network diagram) |
|---|---|---|
Main purpose | Showing the schedule against time; monitoring progress | Calculating earliest and latest times, float and the critical path |
Time | Drawn to scale: the length of a bar shows its duration | Not to scale: durations are written on the arrows |
Dependencies | Implied by the positions of bars (or shown by arrows in software) | Shown explicitly by the arrows and nodes |
Float | Visible as gaps, but easy to misread in a complex project | Calculated exactly: total float and free float |
Ease of use | Easy for anyone to read, including non-specialists | Needs training to draw and interpret |
Best for | Communicating the plan and tracking progress | Analysing the plan and finding where delays matter most |
In practice, managers often use both: critical path analysis to work out the logic and the critical path, and a Gantt chart to present the resulting schedule to the team and track it week by week. Project management software does this automatically, computing the critical path from the dependencies and highlighting the critical tasks on the Gantt chart.
Evaluation of Gantt charts
Advantages
Clear and visual: the whole schedule fits on one page and can be understood by employees, investors and suppliers without training.
Shows parallel work: managers can see which tasks overlap and so plan the use of people, machines and cash.
Sets deadlines: every task and milestone has a date, which helps to motivate teams and hold them accountable.
Monitors progress: comparing the hatched work with the “Today” line shows at once which tasks are late.
Supports resource planning: if two parallel tasks need the same specialist, the clash is visible and one task can be moved into its float.
Easy to update in software, so the plan can be revised quickly when circumstances change.
Limitations
Durations are estimates. A chart built on optimistic estimates gives a false sense of certainty, and its end date is wrong if the estimates are wrong.
Dependencies are hard to see in large projects. With hundreds of tasks the chart becomes cluttered, and it is difficult to tell which tasks depend on which. A network diagram shows the logic more clearly.
Float can be misread. The chart does not calculate float by itself; a gap after a bar can be mistaken for spare time when a later task depends on it.
Time only. The chart shows when tasks happen, not what they cost or how well they are done, so it must be used alongside a budget and quality checks.
Static on paper. A hand-drawn chart must be redrawn whenever a date changes, and an out-of-date chart can mislead.
It assumes the plan is right. By setting out fixed bars, the chart can make managers slow to respond to uncertainty and change, especially in creative work such as research, where the tasks themselves may change.
What the usefulness of a Gantt chart depends on
The value of a Gantt chart depends first on the size and complexity of the project. For a small project with a dozen tasks, such as opening a café, it is often the only planning tool needed. For a large project, such as a hospital or an airport, it is essential for communication but must be supported by critical path analysis and software that track thousands of dependencies.
It also depends on the certainty of the durations. In construction and event planning, where tasks are familiar, estimates are reasonably reliable. In research and development or the restoration of a damaged building, where nobody knows exactly what will be found, the chart is better treated as a forecast that will be revised. Finally, the chart is useful only if managers update it honestly and act on what it shows.
On balance, a Gantt chart is one of the most useful tools for planning and controlling a project because it is simple and visual, and because it turns a list of tasks into a schedule that everybody can follow. Its main weaknesses, the reliance on estimates and the difficulty of showing dependencies in complex projects, are best addressed by combining it with critical path analysis and by building in contingency time.
Case study: restoring Notre-Dame de Paris
On 15 April 2019 a fire destroyed the roof and spire of Notre-Dame de Paris, the medieval cathedral in the centre of Paris. The day after the fire, President Emmanuel Macron said that the cathedral should be rebuilt within five years. A public body, Rebâtir Notre-Dame de Paris, was set up to manage the work, led first by a retired general, Jean-Louis Georgelin, and, after his death in August 2023, by Philippe Jost. The cathedral reopened with ceremonies on 7 and 8 December 2024, about five years and eight months after the fire.
The restoration was a project of unusual difficulty. It had a fixed political deadline and a large budget from private donations (about 340,000 donors gave money), but much of the work could not be planned in detail at the start, because nobody knew how badly the stone vaults and walls had been damaged. The managers therefore divided it into phases, each with its own tasks, and treated each phase as a dependency for the next.
Phase 1: securing the building
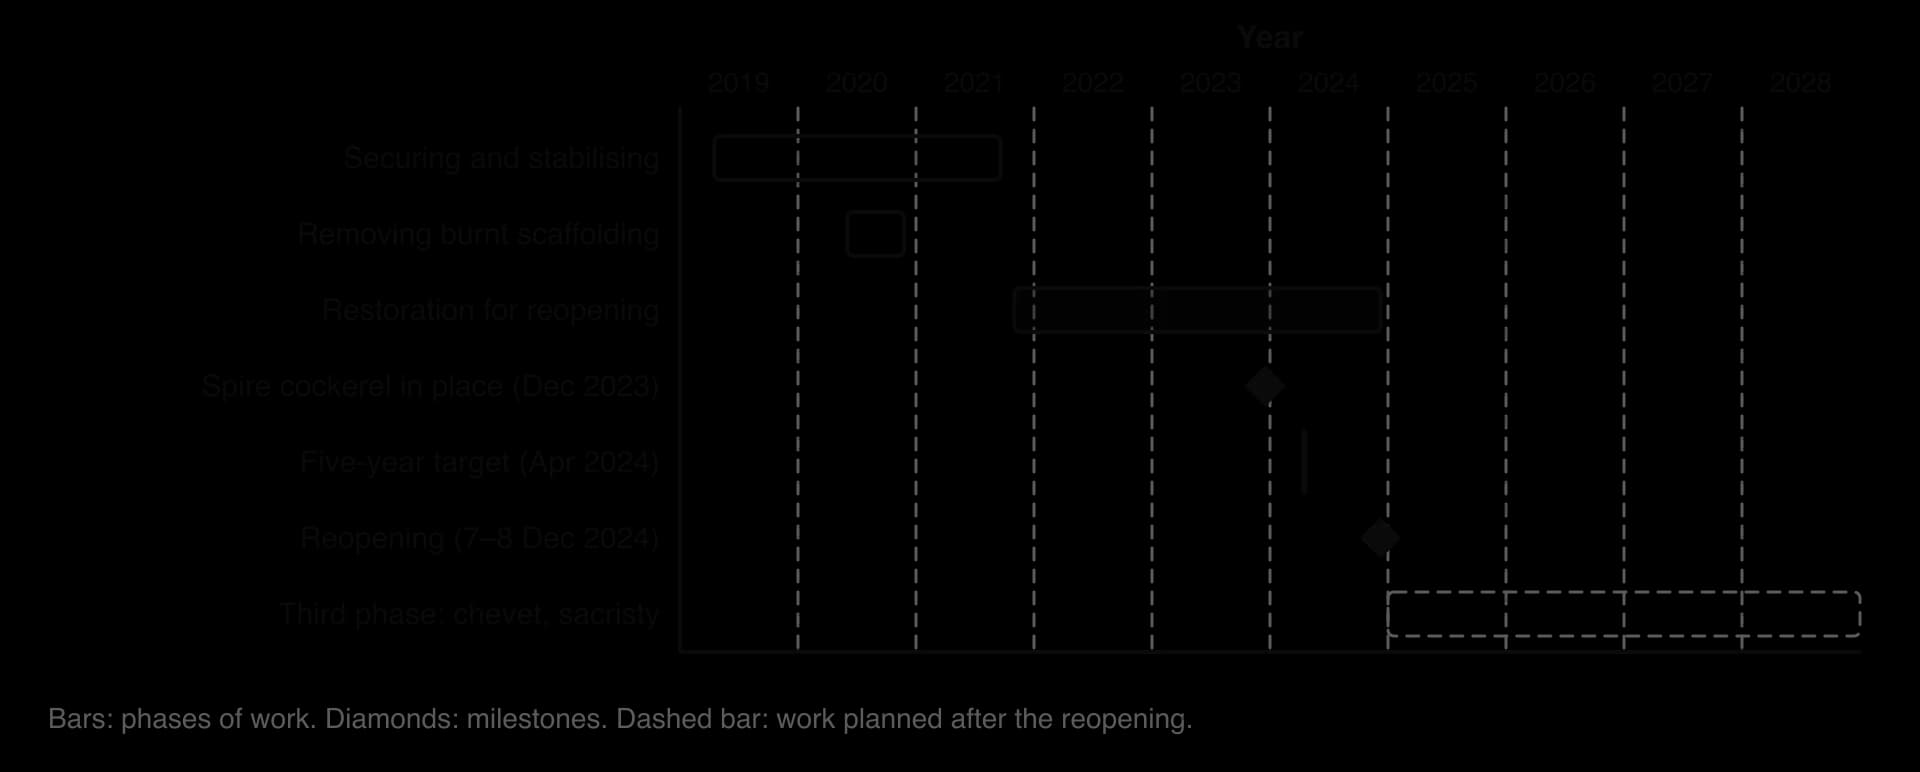
The first phase, securing and stabilising the building, began the day after the fire and was declared complete on 18 September 2021. It included propping the flying buttresses with 28 supporting arches, consolidating the vaults, taking down the great organ’s pipes for cleaning, and removing about 1,300 works of art. Its most dangerous task was removing the scaffolding that had surrounded the spire at the time of the fire: about 40,000 tubes weighing some 200 tonnes had melted and fused together above the open vaults.
This task had strict sequential dependencies. Workers first had to enclose the burnt scaffolding in a new frame so that it could not move, then build a second structure from which rope-access workers could be lowered to cut it apart piece by piece. The removal began in June 2020 and was completed on 24 November 2020. Until it was finished, almost no restoration work could safely begin, so it lay on the project’s critical path.
Delays and interruptions
The schedule was also interrupted by events outside the managers’ control. Work was suspended in the summer of 2019 because of concerns about lead dust from the melted roof, and the worksite stopped during the first COVID-19 lockdown in spring 2020. Each interruption to a critical task moved the whole schedule back and contributed to missing the target of April 2024.
Phase 2: restoration in parallel
Once the building was safe, the restoration phase could run many tasks in parallel. Carpenters rebuilt the oak roof frames using traditional methods, with the timber for the spire assembled and tested in workshops outside Paris before it was taken to the site; masons rebuilt the collapsed vaults; and specialist workshops across France and elsewhere cleaned the stained glass and restored the organ. The golden cockerel was placed on top of the spire on 16 December 2023, marking the completion of the spire’s structure; the remaining roof frames and vaults were completed during 2024.
Running work in parallel was possible only because the restoration was divided among many contractors, each working on a separate part of the building. The milestones of late 2023 and 2024 then gave a clear sequence for the final months: structure, then roofing and interior cleaning, then the return of the bells (September 2024) and the installation of the new liturgical furnishings (autumn 2024), and finally the reopening. Work that was not needed for the reopening, such as the restoration of the chevet and the sacristy, was moved into a third phase planned for 2025–2028.
What the case shows
Planning idea | How it appeared at Notre-Dame |
|---|---|
Sequential tasks and dependencies | Restoration could not start until the building was secured; the burnt scaffolding had to be enclosed before it could be cut apart |
Critical tasks | Removing the burnt scaffolding (June–November 2020) held up almost all other work |
Parallel tasks | Roof frames, vaults, stained glass and the organ were restored at the same time by different contractors |
Milestones | Securing complete (September 2021); cockerel on the spire (December 2023); reopening (7–8 December 2024) |
Reducing scope to protect a deadline | The chevet and sacristy were moved to a third phase, 2025–2028 |
The restoration shows both the strengths and the limits of Gantt-style planning. Breaking the project into phases and milestones made a huge, uncertain task manageable and gave donors and the public clear evidence of progress. Moving non-essential work after the reopening was a deliberate use of scope reduction to protect the key milestone. However, the durations of the securing phase could not be known in advance, and external events such as the pandemic changed the plan, so the chart was a forecast that had to be revised many times rather than a fixed schedule.
The case also links to the key concepts. The decision to rebuild the roof and spire in their original form, in oak and lead, was a choice about heritage and sustainability, and the health risks of lead dust for workers and neighbours raised questions of ethics that delayed the work.
Explain why removing the burnt scaffolding was a critical task in the restoration of Notre-Dame.
Using the timeline, analyse how dividing the restoration into phases and moving some work after the reopening helped the managers to meet the 2024 reopening date.
Explain one limitation of using a Gantt chart to plan a restoration project of this kind.
Sources: Rebâtir Notre-Dame de Paris, “Securing the site” and “Restoration” (2025–2026); AP via NBC News, 18 September 2021; Gulf News (AFP), 25 November 2020; The Art Newspaper, 2 December 2024; France 24, 2 December 2024.
Exam practice
Gantt charts are an HL tool, so they appear in Paper 2 (HL), usually in Section A as a structured question that asks you to construct or complete a chart from a task table, identify the critical tasks or the project duration, and comment on a delay. They can also support an extended response in Section B or a plan of action in Paper 3, where a short timetable shows the sequence of a social enterprise’s plan.
The next question uses the following task list for a charity concert organised by a school (hypothetical data).
Task | Description | Duration (weeks) | Preceded by |
|---|---|---|---|
P | Book the venue | 2 | — |
Q | Audition acts | 3 | — |
R | Sell tickets | 4 | P |
S | Rehearse | 4 | Q |
T | Set up stage and sound | 1 | P |
U | Dress rehearsal | 1 | S, T |
Questions on the same task list often go on to ask about the limitations of the tool, applied to the project.
Summary
A project is a temporary set of tasks with a defined start, end and objective; project management plans and controls it within limits of time, cost and quality.
A Gantt chart lists the tasks down the side and shows each one as a bar on a time scale across the top.
Dependencies decide when tasks can start: sequential tasks follow one another, parallel tasks run at the same time, and a task waits for the last of its predecessors.
Milestones are zero-duration checkpoints, shown as diamonds.
Critical tasks have no float, so any delay to them delays the project; non-critical tasks can slip only by up to their float.
A “Today” line and shaded progress show whether a project is on schedule, and managers respond with extra resources, overlapping tasks, reduced scope or a revised date.
Gantt charts are clear and widely used but depend on estimated durations and show complex dependencies poorly, so they are often combined with critical path analysis.
Self-check
- To do:
I can define a project, a Gantt chart, a milestone and a dependency.
- To do:
I can distinguish between sequential and parallel tasks.
- To do:
I can construct a Gantt chart from a task list with durations and predecessors.
- To do:
I can identify the critical tasks, the float of each task and the project duration from a Gantt chart.
- To do:
I can read a progress chart with a “Today” line and explain the effect of a delay.
- To do:
I can explain how Gantt charts are used in different areas of a business.
- To do:
I can explain the limitations of Gantt charts and how they relate to critical path analysis.