T.14 Critical path analysis
Complete and analyse a network diagram in the IB layout: find earliest start and latest finish times, identify the critical path, calculate total and free float, and evaluate CPA as a planning tool.
- IB Business Management
- Part of T Business management toolkit
- HL only
Key terms introduced here
Each is in the Business glossary, with every other term in the subject.
- Activity
A task within a project that takes time and resources to complete, shown on a network diagram as an arrow labelled with its letter and duration.
- Critical activity
An activity on the critical path, with zero total float, so that any delay to it delays the completion of the whole project.
- Critical path
The sequence of activities through a network that takes the longest time, which sets the project's minimum duration; any delay to an activity on it delays the whole project.
- Critical path analysis
A project planning technique that uses a network diagram of activities, durations and dependencies to find the minimum time needed to complete a project and the activities that cannot be delayed.
- Dummy activity
An activity with zero duration, drawn as a dashed arrow on a network diagram, which shows a dependency that ordinary arrows cannot show and uses no time or resources.
- Earliest start time
The earliest time at which an activity can begin, given that all the activities it depends on must first be completed.
- Float
The amount of time by which an activity can be delayed without delaying the whole project (total float) or the next activity (free float); critical activities have zero float.
- Free float
The time by which an activity can be delayed without delaying the earliest start of the following activity, calculated as the next activity's earliest start time minus duration minus this activity's earliest start time.
- Latest finish time
The latest time by which an activity must be completed if the project as a whole is not to be delayed.
- Network diagram
A diagram that shows a project's activities as arrows between numbered nodes, in the order in which they must be completed, so that the project's sequence and timing can be analysed.
- Node
A circle on a network diagram marking the start or end of activities, divided to show the node number, the earliest start time and the latest finish time.
- Total float
The time by which an activity can be delayed without delaying completion of the project, calculated as the latest finish time minus the duration minus the earliest start time.
Notes on T.14 Critical path analysis
Learning objectives
Define critical path analysis, activity, node, earliest start time, latest finish time, critical path, float and dummy activity.
Describe the conventions of a network diagram, including the IB layout of a node and the use of dummy activities.
Calculate the earliest start time and latest finish time at every node of a network.
Identify the critical path and the minimum duration of a project.
Calculate the total float and free float of an activity.
Complete and analyse a given network diagram, including the effect of a delay to an activity.
Explain the uses and limitations of critical path analysis.
Introduction
Critical path analysis (CPA) is a method of planning a project that shows the order of its activities in a network, calculates the shortest time in which the project can be completed, and identifies which activities must not be delayed. It is used to plan and control projects such as building a hospital, launching a product or installing a new computer system.
CPA links to the key concepts. Projects are a response to change, and CPA helps managers to deliver that change on time. Finding a faster way through a network, for example by running activities in parallel, calls for creativity. CPA also has a role in ethics: a plan that hides an unrealistic deadline puts pressure on workers and can lead to unsafe practices on a construction site.
What critical path analysis does
Every project is made up of separate pieces of work, each of which takes time. Some can be done at the same time; others must wait until earlier work is finished. CPA turns this information into a diagram and a set of calculations that answer three questions: how long the whole project will take, which activities decide that length, and how much spare time the other activities have.
The method was developed in the late 1950s by Morgan Walker of the chemical company DuPont and James Kelley of Remington Rand, to plan the maintenance and construction of chemical plants. A similar technique, the programme evaluation and review technique (PERT), was developed at about the same time by the US Navy with the consultancy Booz Allen Hamilton. Today CPA is used in construction, aerospace and defence, software development, product development and plant maintenance, usually through project management software.
CPA is closely related to the Gantt chart. A Gantt chart shows a schedule as bars on a time scale, which is easy to read; CPA shows the logic of the project as a network and calculates its timing exactly. Many managers use CPA to work out the critical path and a Gantt chart to present the schedule to the team.
Activities, durations and dependencies
The starting point for CPA is a list of the project’s activities. Each activity is a task that uses time and usually resources, such as designing the packaging or testing a product. For each one, managers estimate its duration and identify its dependencies: the activities that must be finished before it can begin.
The information is set out in a precedence table. The table used in the examples that follow describes the launch of a new range of bottled smoothies by a drinks company (hypothetical data, in weeks).
Activity | Description | Preceded by | Duration (weeks) |
|---|---|---|---|
A | Develop the recipes | — | 4 |
B | Agree contracts with fruit suppliers | — | 6 |
C | Design the packaging | A | 5 |
D | Trial production run | A, B | 3 |
E | Print the packaging | C | 4 |
F | Food safety testing | D | 2 |
G | Fill bottles and deliver to shops | E, F | 3 |
The table shows the logic of the launch. The recipes (A) and the supplier contracts (B) have no predecessors, so they can start at once and run in parallel. The trial run (D) needs both a recipe and fruit, so it must wait for A and B, while the packaging design (C) needs only the recipe. The final activity (G) can begin only when the printed packaging (E) and the safety tests (F) are both ready.
Network diagrams and the IB node layout
A network diagram shows the activities of a project and the order in which they must happen. In the IB layout, each activity is an arrow and each node (a circle) marks a point in time: the end of the activities that lead into it and the start of the activities that leave it.
Each node is divided into three parts. The left half holds the node number, which simply identifies the node. The right half is divided into two: the top right shows the earliest start time of the activities that leave the node, and the bottom right shows the latest finish time of the activities that enter it.
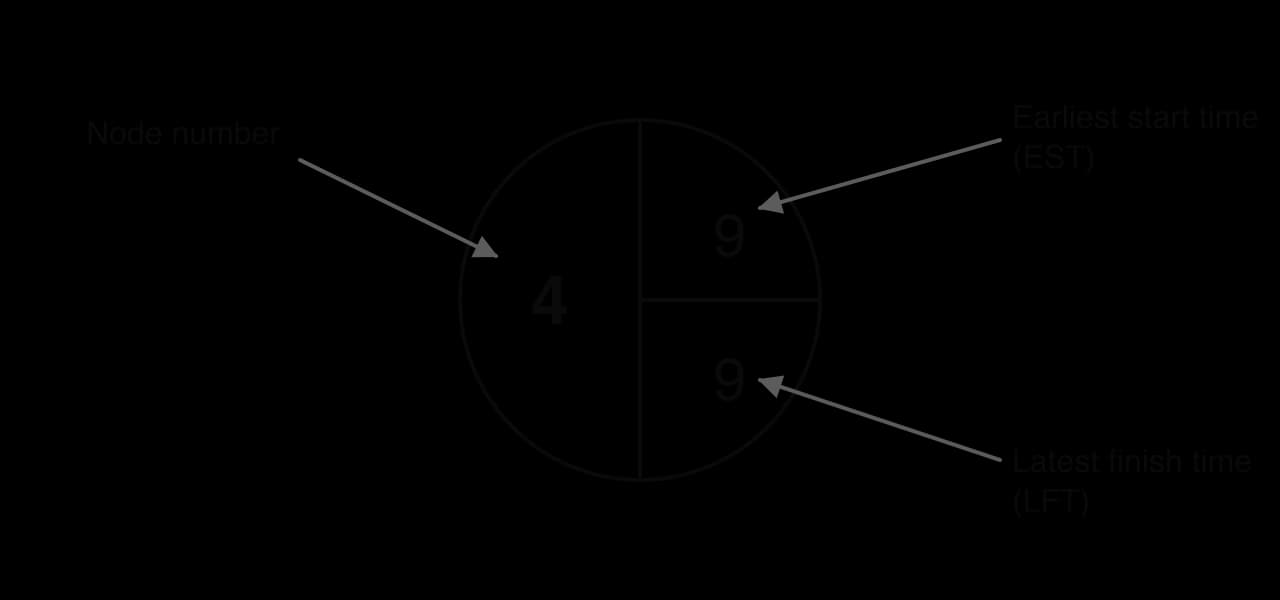
The two times in the node are the result of two calculations. The earliest start time (EST) is the earliest point at which the activities leaving the node can begin, given that all the activities leading into it must be finished first. The latest finish time (LFT) is the latest point by which all the activities entering the node must be finished if the project is not to be delayed.
The ESTs are found by working forwards from the start of the project; the LFTs are found by working backwards from its end. The difference between them at a node shows how much room for delay there is at that point in the project.
Conventions for drawing a network
The network has one start node and one end node, and flows from left to right.
Each activity is drawn once, as an arrow labelled with its letter and duration (for example “C 5”).
An activity that depends on others begins at the node where those activities end.
Arrows should not cross where this can be avoided, and the lengths of the arrows have no meaning: the network is not drawn to scale.
Nodes are numbered from left to right, so that every arrow goes from a lower number to a higher one.
Two activities must never start and end at the same pair of nodes.
Dummy activities
Sometimes the dependencies cannot be shown with ordinary arrows alone. In the smoothie launch, the trial run (D) depends on both A and B, but the packaging design (C) depends on A only. If A and B ended at the same node, C would wrongly appear to wait for B as well. The solution is a dummy activity: a dashed arrow from the end of A to the end of B, which carries the dependency on A forward to D without making C wait for B.
Dummy activities have two uses. They show a logical dependency, as in the smoothie launch, and they keep two activities that run between the same events from sharing both a start node and an end node, so that each activity can be identified by its pair of nodes. A dummy takes no time, so it is treated as an activity with a duration of 0 in every calculation.
Building a network step by step
Building a network once from a precedence table shows how every part of the diagram follows from the dependencies.
Draw the start node (node 1) on the left.
Draw the activities with no predecessors as arrows leaving node 1, each ending in a new node (A to node 2, B to node 3).
For each remaining activity, find its predecessors. If it depends on one activity, start it from that activity’s end node (C starts at node 2, after A).
If it depends on several activities, they must end at the same node; use a dummy if one of them also leads to another activity on its own (the dummy from node 2 to node 3, so that D starts after A and B).
Continue until every activity is drawn, joining the final activities at a single end node.
Check: every activity appears once, each arrow goes from a lower to a higher node number, and no two activities share both start and end nodes.
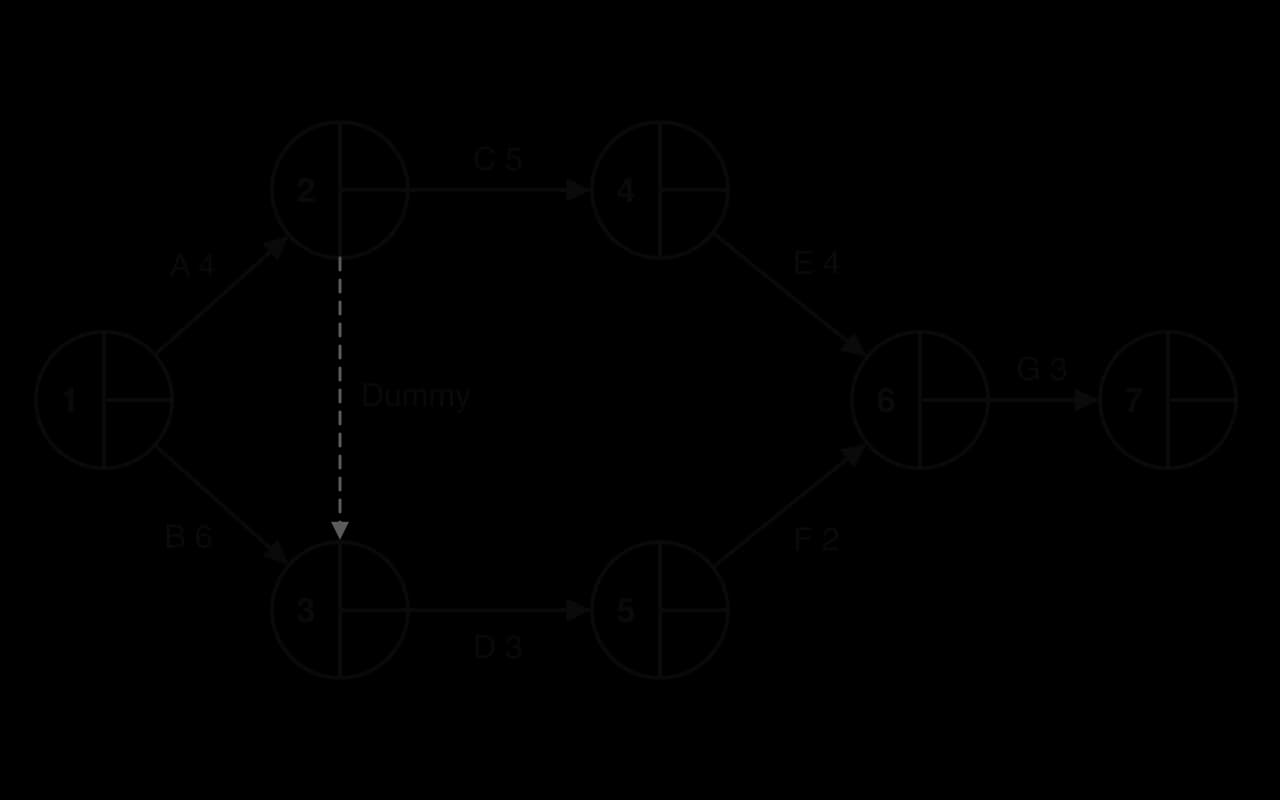
The network shows the same logic as the precedence table in a form that can be calculated. Two routes lead from the start to node 6: one through the recipes, packaging design and printing (A, C, E), and one through the supplier contracts, trial run and safety testing (B, D, F). Both must be complete before G. The forward and backward passes show which of the two routes takes longer.
The forward pass: earliest start times
The ESTs are found by working through the network from left to right, a process called the forward pass. The EST of the start node is 0. At every other node, the EST is the largest value of (EST of the previous node + duration of the activity) over all the activities entering the node.
The largest value is used because the activities leaving a node cannot start until all the activities entering it are finished, and that happens when the slowest of them finishes.
The backward pass: latest finish times
The LFTs are found by working back through the network from right to left, the backward pass. The LFT of the end node equals its EST, because the project should finish as soon as it can. At every other node, the LFT is the smallest value of (LFT of the next node − duration of the activity) over all the activities leaving the node.
The smallest value is used because every activity leaving the node must be able to finish on time. If one of them needs to start early, the activities that end at the node must be finished by then.
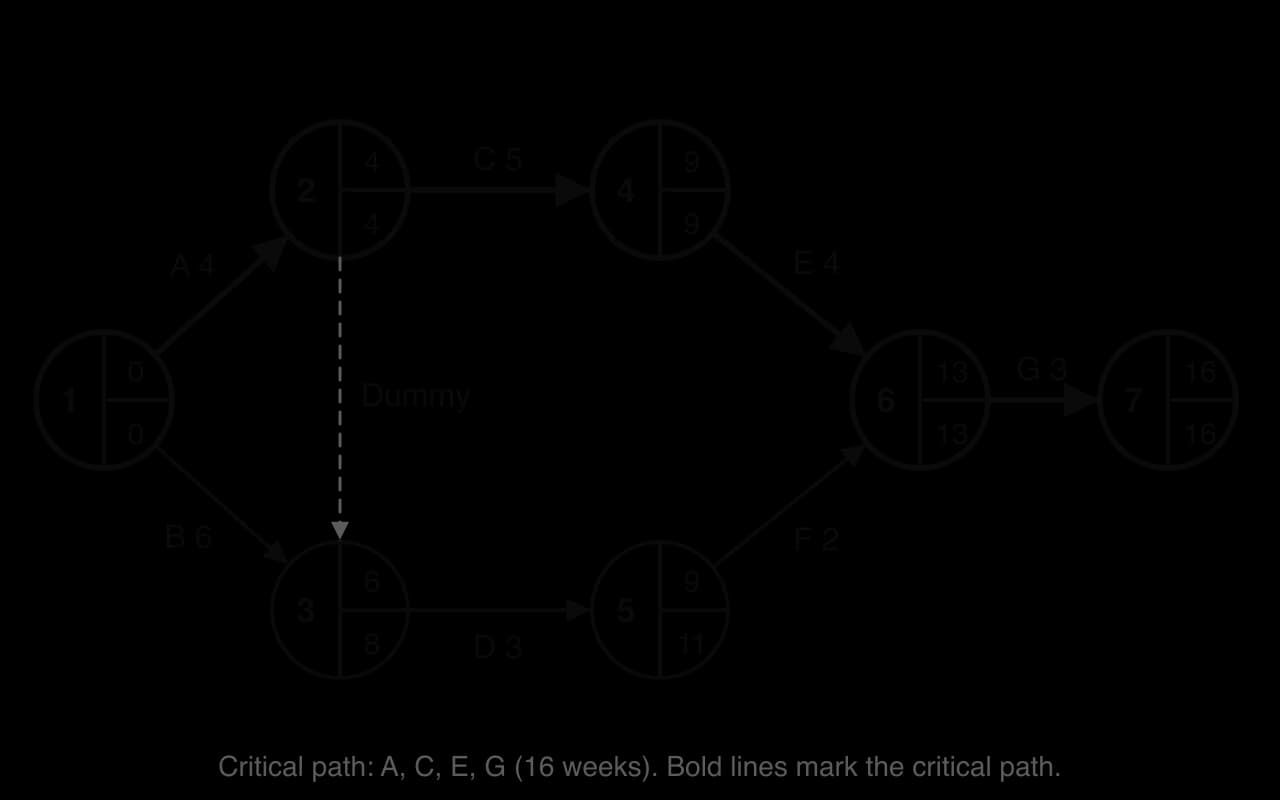
The completed network holds all the information needed to manage the project. Node 3, for example, shows that the trial run (D) can start at week 6 at the earliest, but B and the dummy need only be finished by week 8. Node 5 shows that D can finish as early as week 9, but the project is not delayed as long as it finishes by week 11.
Identifying the critical path
The critical path is the longest path through the network, from the start node to the end node. Its length is the minimum duration of the project, because no project can be finished sooner than its longest chain of dependent activities. Every activity on it is a critical activity, with no spare time at all.
There are two ways to find it. The first is to list every path and add up the durations: A–C–E–G takes 4 + 5 + 4 + 3 = 16 weeks; B–D–F–G takes 6 + 3 + 2 + 3 = 14 weeks; and A–dummy–D–F–G takes 4 + 0 + 3 + 2 + 3 = 12 weeks. The longest, A–C–E–G, is the critical path. The second way, which is quicker in a large network, is to use the completed nodes: the critical path runs through nodes where the EST equals the LFT, along activities whose total float is zero.
A network can have more than one critical path when two routes take exactly the same time. Managers then have more activities to watch closely, because a delay on either route delays the project. Critical paths are usually marked on a network with bold arrows, a different colour, or two short lines across each critical arrow.
Float: total float and free float
Activities that are not on the critical path have float: spare time that allows them to start late or take longer than planned. Float is useful to managers, because it shows where there is room to move workers and equipment, or to delay spending, without putting the deadline at risk. There are two measures of float.
Total float
Total float is the time an activity can be delayed without delaying the whole project. It compares the time available for the activity, from the EST at its start node to the LFT at its end node, with its duration.
In this formula, the LFT is taken from the node at the end of the activity and the EST from the node at its start.
Free float
Free float is the time an activity can be delayed without delaying the earliest start of the next activity. It uses the EST at the end node instead of the LFT.
Free float is never larger than total float. When the two are equal, the activity’s spare time belongs to it alone. When free float is smaller, part of the total float is shared with later activities on the same path: using it up early leaves less spare time for the activities that follow.
Using CPA to manage a project
Managers use a completed network to decide where to concentrate their attention, how to respond to delays and how to shorten a project when the deadline is tight.
Monitoring and responding to delays
Managers watch the critical activities most closely, because any delay to them delays the project. A delay to a non-critical activity matters only if it is longer than the activity’s total float. In the smoothie launch, if food safety testing (F) takes 3 weeks longer than planned, its 2 weeks of total float absorb part of the delay and the launch moves from week 16 to week 17. A 1-week delay to the supplier contracts (B) has no effect on the launch date.
Shortening the project
If the project must finish sooner, managers can shorten (or “crash”) critical activities by adding resources: overtime, extra staff, a faster supplier or more machines. Shortening a non-critical activity is pointless, because it does not change the length of the critical path. Each week saved has a cost, so managers usually shorten the activities that are cheapest to speed up first.
Shortening a critical activity often makes another path critical, as the example shows. Managers therefore recalculate the network after every change rather than assuming that the critical path stays the same.
Planning resources and cash
The ESTs and LFTs show when each activity will need people, equipment and money. Activities with float can be scheduled to avoid two activities needing the same specialist at once, or to delay a payment until cash comes in, which helps to manage cash flow and working capital. Many businesses turn the network into a Gantt chart for this purpose, so that the workload in each week can be seen on a time scale.
 YouTube
The video works through the same forward and backward passes as the smoothie launch. Its explanation of float shows why managers move resources away from activities with float and towards the critical path.
Evaluation of critical path analysis
Advantages
Finds the minimum project duration and so shows whether a deadline is realistic before work begins.
Identifies the critical activities, so that managers focus supervision and resources where delays would be most costly.
Shows float, allowing resources to be moved and spending to be timed efficiently.
Encourages careful planning: listing every activity and dependency forces managers to think through the whole project and often uncovers problems early.
Shows the effect of delays and of shortening activities, so managers can compare options such as overtime against a later launch.
Improves coordination between departments and suppliers, who can see when their work is needed.
Limitations
Durations are estimates. If they are optimistic, the critical path and the end date are wrong. Uncertain activities, such as research or approval by a regulator, are especially hard to estimate.
Networks are complex to draw and update for large projects with hundreds of activities, and they need trained staff or software.
It assumes resources are available. A network may show two activities in parallel even though they need the same team, which in practice forces one to wait.
It shows time, not cost or quality. Shortening activities costs money, and rushing them may reduce quality or safety, so CPA must be used with a budget and quality checks.
The plan can go out of date quickly. As soon as an activity overruns, the network has to be recalculated, and a different path may become critical.
It can create pressure on staff. Tight deadlines on critical activities may lead to stress and long hours, which can lower motivation and raise the risk of accidents.
What the usefulness of CPA depends on
Factor | CPA is more useful when… | CPA is less useful when… |
|---|---|---|
Size of the project | There are many interdependent activities and a firm deadline | There are only a few activities, which a simple Gantt chart can show |
Reliability of estimates | Activities are familiar and past projects give good estimates | Activities are new or depend on outsiders, such as regulators or importers |
Resources | Enough people and equipment exist to run parallel activities | The same few people are needed for activities shown in parallel |
Use by managers | The network is updated and acted on as the project runs | It is drawn once and then ignored |
CPA is most useful for large projects with many interdependent activities and a firm deadline, such as construction, product launches and events, where knowing the critical path saves time and money. For a small project with a handful of activities, a simple Gantt chart may be enough.
Its usefulness also depends on how reliable the estimates are. In familiar projects with similar past experience, estimates are reasonably accurate and CPA gives a dependable plan. In new or uncertain projects, managers can still use it, but should build in contingency time, update the network as information arrives and treat the end date as a forecast. Finally, CPA depends on the skills and honesty of the people using it, because the results are only as reliable as the estimates entered and are useful only if managers act on them.
On balance, CPA is a powerful tool for planning and controlling complex projects, because it identifies exactly which activities determine the end date and where spare time exists. Its limitations come mainly from the quality of the estimates and the complexity of real projects, so it works best combined with Gantt charts for communication, budgets for cost control and contingency planning for risks.
Case study: Huoshenshan Hospital, Wuhan
In January 2020 the city of Wuhan in China was at the centre of the first COVID-19 outbreak, and its hospitals did not have enough beds for infectious patients. The authorities decided to build two temporary hospitals, Huoshenshan (1,000 beds) and Leishenshan (1,500 beds), within a few days. Huoshenshan was modelled on Xiaotangshan Hospital, which had been built in Beijing in 2003 during the SARS epidemic.
Work on the Huoshenshan site began on the evening of 23 January 2020 and the building was completed on 2 February, when it was handed over to the People’s Liberation Army. The first patients were admitted on 3 February. The project therefore took about ten days from the start of site work to handover, for a two-storey hospital of 1,000 beds in about 10 m² prefabricated units, each fitted with two beds.
Date (2020) | Event |
|---|---|
23 January (evening) | Site work begins with levelling the ground |
Late January | Technical drawings for both hospitals produced in about 60 hours by a team of 60 designers |
2 February | Construction complete; the hospital is handed to the People’s Liberation Army |
3 February | First patients admitted (Zone 1) |
7 February | Zones 2–4 open |
8 February | Leishenshan Hospital (1,500 beds), built to the same design, opens |
15 April | Both hospitals closed |
The timeline shows how little time separated each stage: the hospital was designed, built, equipped and staffed within about two weeks of the decision to build it.
How the project was compressed
In a normal project, design would be finished before construction began, and each building system would be installed after the structure was complete. At Huoshenshan, the managers turned these sequential activities into parallel ones. The design was based on an existing hospital, so site levelling could start before the full technical drawings were finished. The wastewater treatment system, which would normally take at least 60 days to build, had to be finished within about ten days while the hospital buildings were going up. For Leishenshan, prefabricated buildings were partly assembled in a supplier’s factory in Suzhou before they reached the site.
These decisions have the same effect as shortening a critical path. Running activities in parallel removes dependencies, so the longest chain of activities becomes shorter; using prefabricated units moves work off site, where it does not compete for space with other activities. The project also used very large amounts of resources to shorten each critical activity, with up to 7,000 people working around the clock in three shifts and hundreds of quality inspectors checking frames and welds across the two sites.
What the case shows
Huoshenshan shows the core idea of critical path analysis at an extreme: the deadline was fixed by a public health emergency, so the managers had to find the critical activities and shorten every one of them. The high cost of doing so was accepted because of the urgent need for beds.
The case also shows the limits of the approach. Shortening activities on this scale is possible only with almost unlimited labour, machinery and political priority, and much of the risk was reduced by reusing a proven design. The hospitals were temporary and closed on 15 April 2020, which raises questions about the sustainability of resources used for a short-term purpose, even though the speed of construction met an urgent human need.
Explain how turning sequential activities into parallel activities shortened the time needed to build Huoshenshan Hospital.
Using critical path analysis, analyse why adding thousands of workers to the project could shorten it, and why there is a limit to how far this can work.
Explain one reason why the methods used at Huoshenshan would be difficult for a private business to copy on an ordinary construction project.
Sources: China Daily, “Workers race against time to build ‘high-speed’ hospitals”, 1 February 2020; Hospital Management, “Huoshenshan Hospital”, 2020; AP, South China Morning Post, Caixin, Metro and NPR reports (2020), via Wikipedia, “Huoshenshan Hospital”, 2026.
Exam practice
Critical path analysis appears in Paper 2 (HL). Questions give you a precedence table and a partly completed network in the IB node layout. You complete the network rather than draw one from scratch, then identify the critical path, calculate float and comment on a delay or a proposal to shorten the project.
The next questions refer to a gym that is opening a new fitness studio. The activities, durations (in weeks) and dependencies are given in the table (hypothetical data), followed by the partly completed network.
Activity | Description | Preceded by | Duration (weeks) |
|---|---|---|---|
J | Plan the studio layout | — | 3 |
K | Order and receive equipment | — | 5 |
L | Recruit instructors | J | 4 |
M | Remove old fittings | J | 2 |
N | Fit out the studio and install equipment | K, M | 6 |
O | Train instructors | L | 3 |
P | Open week and launch | N, O | 2 |
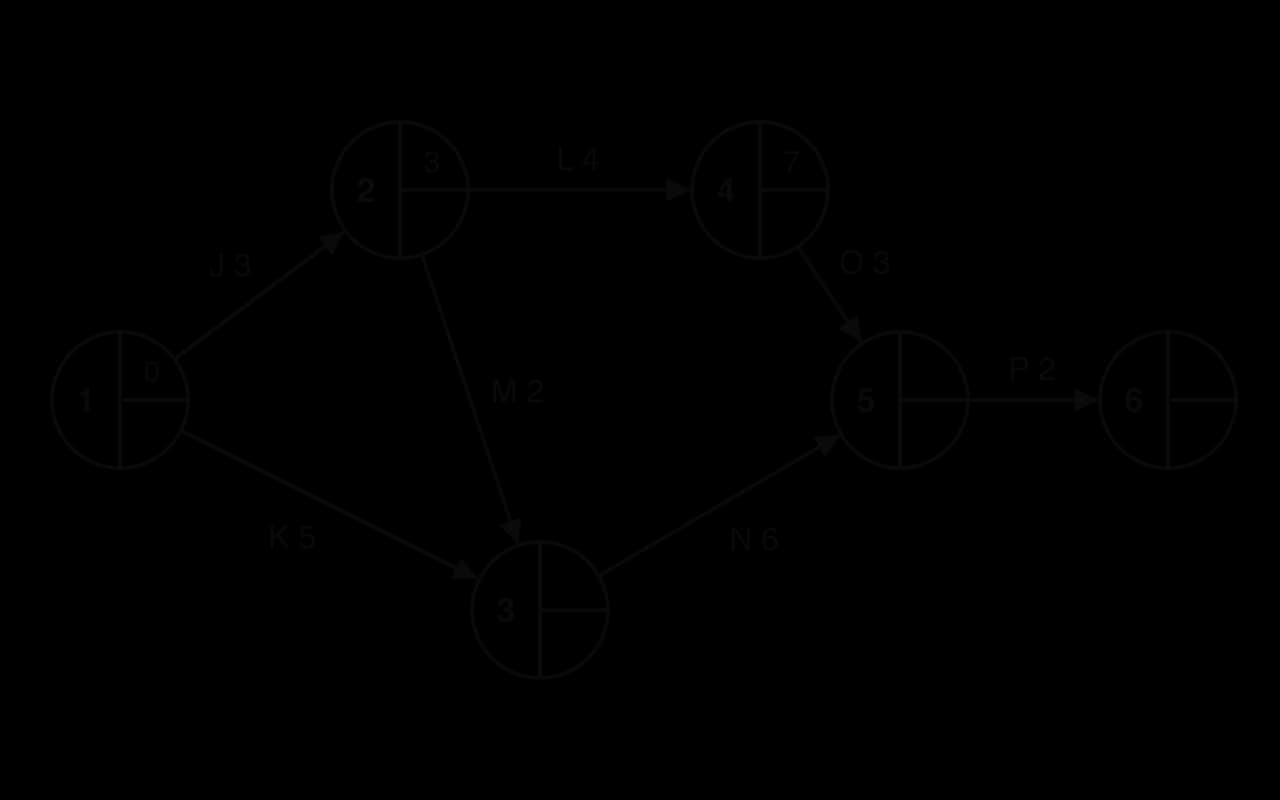
Follow-up parts often ask for a comment on the result in the context of the business.
Summary
Critical path analysis uses a network of activities, durations and dependencies to find the minimum duration of a project and the activities that cannot be delayed.
In the IB layout, each node shows the node number (left), the earliest start time (top right) and the latest finish time (bottom right); activities are arrows labelled with a letter and duration.
A dummy activity (dashed, zero duration) shows a dependency that ordinary arrows cannot.
Forward pass: EST = largest of (previous EST + duration). Backward pass: LFT = smallest of (next LFT − duration).
The critical path is the longest path; its activities have zero total float, and there can be more than one.
Total float = LFT − duration − EST; free float = EST (next activity) − duration − EST (this activity).
CPA helps managers to set realistic deadlines, focus on critical activities, respond to delays and shorten projects, but it depends on estimated durations and ignores resource limits, cost and quality.
Self-check
- To do:
I can define critical path analysis, activity, node, EST, LFT, critical path, float and dummy activity.
- To do:
I can describe the IB node layout and the conventions of a network diagram, including dummy activities.
- To do:
I can calculate the EST and LFT at every node of a network.
- To do:
I can identify the critical path (or paths) and the minimum duration of a project.
- To do:
I can calculate the total float and free float of an activity and explain what each means.
- To do:
I can complete a given network and explain the effect of a delay or of shortening an activity.
- To do:
I can explain the uses and limitations of critical path analysis.
Questions on T.14
23 exam-style questions on this subtopic, written in the style of the IB papers. The first has its markscheme open. Counted on
Question 1 · BM-015646 marks
Clínica Dental Arcos in Guadalajara, Mexico, must close while it is renovated, losing about MXN 40 000 of revenue a day. The tasks are shown in Table 1.
Table 1: Renovation tasks
Task | Description | Preceded by | Duration (days) |
|---|---|---|---|
A | Strip out old fittings | – | 2 |
B | Rewire the surgeries | A | 3 |
C | Install power and lighting for the X-ray room | A | 2 |
D | Plumbing for the dental chairs | A | 4 |
E | Plaster and paint | B, C | 3 |
F | Install dental chairs | D, E | 2 |
G | Clean and inspect | F | 1 |
- (a)
Determine the minimum number of days needed for the renovation (show all your working).
2 marks
Markscheme (a)
A days 1–2; B days 3–5; C days 3–4; D days 3–6; E starts after B and C, days 6–8; F starts after D and E, days 9–10; G day 11.
Minimum duration = 11 days (A–B–E–F–G).
Award [1] for correct working (a Gantt chart, a schedule or the longest sequence of tasks) and [1] for the correct answer.
- (b)
The clinic has only one electrician, who must do both task B and task C. Calculate the new minimum duration (show all your working).
2 marks
Markscheme (b)
B and C cannot overlap: B days 3–5, then C days 6–7 (or C first, then B). E days 8–10; F days 11–12; G day 13.
New duration = 13 days (2 days longer).
Award [1] for correct working and [1] for the correct answer. Accept OFR from (a).
- (c)
Explain one way in which the clinic could avoid the extra delay.
2 marks
Markscheme (c)
Hire a second (temporary) electrician so that B and C can run at the same time again; at MXN 40 000 of lost revenue a day, paying for two extra days of an electrician is likely to cost less than the 2 days of closure (MXN 80 000).
Ask the electrician to work overtime or weekends to shorten B or C.
Rearrange the work so the X-ray room is completed after reopening, if that room can stay closed for a short time.
Award [1] for a relevant way and [1] for explaining it in the clinic’s context.
Question 2 · BM-015654 marks
Mavuno Builders Ltd is a construction company in Nairobi, Kenya. For small house extensions its site managers use Gantt charts. For a new six-storey school building, with more than 40 activities and a penalty clause for late completion, the operations director, Nyambura Kinyua, wants the managers to use critical path analysis (CPA) as well.
Distinguish between a Gantt chart and critical path analysis as planning tools for Mavuno Builders.
4 marks
Answer it, then compare with the markscheme.Check this one with a free account
Question 3 · BM-0156620 marks
Dapur Rempah Sdn Bhd (DR)
DR runs a popular Malay restaurant in Kuala Lumpur, Malaysia. It has signed a lease for a second outlet in Petaling Jaya. Its founder, Aisyah Rahman, wants it open before Ramadan, which begins at the start of week 11 of the project. During Ramadan, buffets for the evening breaking of the fast (buka puasa) are DR’s busiest and most profitable trade: the new outlet is forecast to earn a contribution of RM150 000 in that month.
DR’s plan uses its own two carpenters and some casual workers for the fit-out, which would take 7 weeks and cost RM290 000 (Figure 1). A contractor has offered to complete the fit-out in 4 weeks for RM380 000. DR’s carpenters, who also maintain the first restaurant, built its much-praised wooden interior; the contractor’s work on other restaurants has received mixed reviews. Council permits for restaurants in Petaling Jaya have taken between 4 and 7 weeks this year.
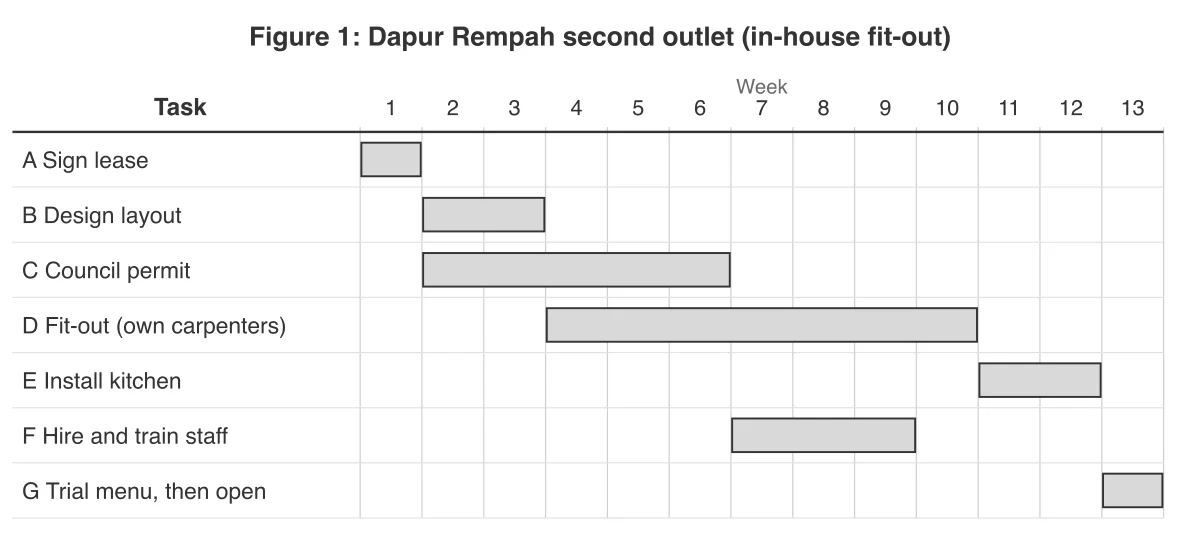
The fit-out (D) starts when the layout design (B) is finished, and the kitchen (E) is installed after the fit-out. Task F can start only after the council permit (C) is granted. Task G needs tasks E and F to be finished.
- (a)
Describe one feature of a Gantt chart.
2 marks
- (b)(i)
Using Figure 1, state the week in which the new outlet would open with the in-house fit-out.
1 mark
- (b)(ii)
Calculate the week in which the outlet would open if the contractor does the fit-out (show all your working).
2 marks
- (b)(iii)
Using your answer to (b)(ii), identify the tasks that would have no spare time (float) if the contractor is used.
1 mark
- (c)
Calculate the net financial gain from using the contractor, if it allows the outlet to open for Ramadan and the in-house option would earn none of the RM150 000 (show all your working).
2 marks
- (d)
Explain one reason why the actual opening date may differ from the date shown in a Gantt chart.
2 marks
- (e)
Using the information in the stimulus, recommend whether DR should use the contractor for the fit-out.
10 marks
Answer it, then compare with the markscheme.Check this one with a free account
Flashcards for T.14
The official deck for this part of the syllabus.
T.14 Critical path analysis · front
What is critical path analysis (CPA)?
T.14 Critical path analysis · front
State the three questions that critical path analysis answers about a project.
- T.14 Critical path analysis95 cards
Carry on with T.14 in Augment
With a free account, Augment remembers where you stopped and what you have practiced.