Notes on T.4 Boston Consulting Group (BCG) matrix
Learning objectives
Explain the purpose of portfolio analysis and the two axes of the BCG matrix.
Calculate market growth rate and relative market share from data.
Describe the four categories of the BCG matrix: question marks, stars, cash cows and dogs.
Explain the cash flow implications of each category for a business’s portfolio.
Construct a BCG matrix from data, with each product drawn as a circle sized by its revenue.
Apply the build, hold, harvest and divest strategies to products in a portfolio.
Explain the link between the BCG matrix and the product life cycle, and the limitations of the matrix.
Introduction
Most businesses sell more than one product, and many large companies own dozens of brands in different markets. The Boston Consulting Group matrix (BCG matrix) is a tool for analysing such a portfolio: it shows which products bring in cash, which need cash, and where managers should invest or withdraw.
Managing a portfolio is a response to change, because markets grow and decline over time and products move between categories. Decisions about which products to fund also call for creativity in developing new products to replace those that are fading.
Portfolio analysis
A product portfolio is the range of products a business sells. In a large company, products are often grouped into strategic business units, divisions that serve a distinct market and are run almost like separate businesses. Unilever, for example, reports its results through business groups such as Beauty & Wellbeing, Personal Care, Home Care and Foods.
Portfolio analysis asks how money and management time should be shared between these products or units. A business has limited funds, so money spent promoting one product cannot be spent developing another. Some products earn far more cash than they need, while others need heavy investment before they earn anything. A healthy portfolio balances the two, so that today’s successful products pay for tomorrow’s.
The Boston Consulting Group, a management consultancy founded by Bruce Henderson in Boston in 1963, developed its “growth-share matrix” around 1970 to make this choice clearer. The matrix places each product according to two measures: how fast its market is growing and how strong its position is in that market compared with its largest rival.
The two axes of the matrix
The vertical axis of the matrix shows the market growth rate, which measures how attractive the market is. The horizontal axis shows relative market share, which measures how strong the product is in that market. Both are calculated from market data.
Market growth rate
The market growth rate is the percentage change in the total sales of a market over a period, usually a year. It refers to the whole market, all firms together, and not to the sales of one business. A fast-growing market offers more chances to win new customers, but it also attracts new competitors and needs spending on capacity and promotion to keep up.
The formula is the same percentage change formula used for market growth in marketing. It can use sales revenue or sales volume, as long as both years are measured in the same way.
Relative market share
Market share is a business’s sales as a percentage of total market sales. The BCG matrix uses a related measure, relative market share, which compares a product’s share with that of its largest competitor. It shows whether the product leads its market or follows others.
A relative market share above 1 means the product is the market leader: its share is larger than any rival’s. A value of 2 means its share is twice that of the next biggest firm. A value below 1 means at least one rival is larger: 0.5 means the product has half the share of the leader. For the market leader, the “largest competitor” is the firm in second place; for every other firm, it is the leader.
Where the dividing lines go
The matrix is split into four cells by a vertical line and a horizontal line. On the share axis the line is usually drawn at a relative market share of 1.0, which separates market leaders from followers. On the growth axis the original BCG matrix used 10% a year, a rate typical of fast-growing markets in the 1970s. Many analysts now draw the line at the average growth rate of the markets or the economy being studied, because in mature consumer markets a 10% growth rate is rare.
By BCG convention, high relative share is on the left of the horizontal axis and low share on the right, so the axis runs “backwards” compared with most graphs. The share axis is often drawn on a logarithmic scale (for example 10×, 1×, 0.1×), so that equal distances show equal ratios.
The four categories
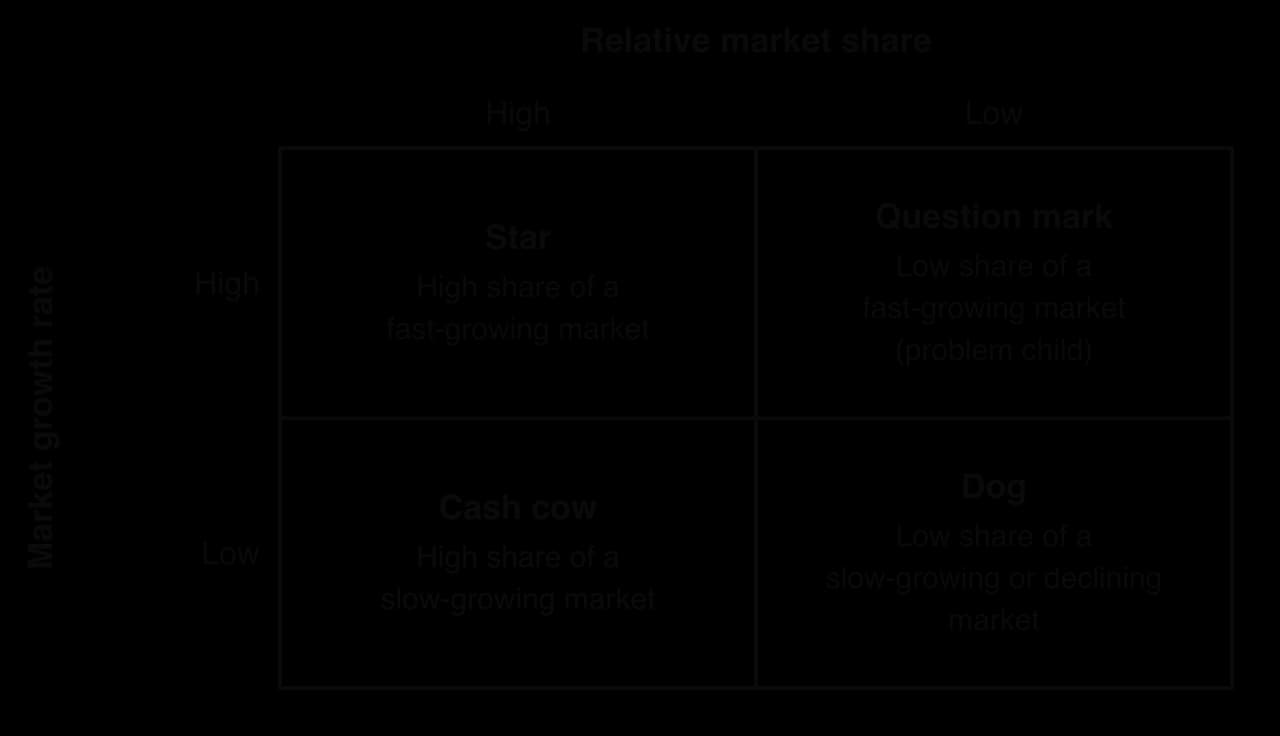
The matrix gives four categories. Each combines a level of market growth with a level of relative market share, and each has a typical cash position and a typical strategy. The descriptions are tendencies, not rules: a real product may sit close to a dividing line or behave differently from the typical pattern.
 YouTube
Question marks
A question mark (also called a problem child or a wildcat) is a product with a low relative market share in a fast-growing market. Many new products start here. The market is attractive, but the product is not yet a leader and its future is uncertain. It needs heavy spending on promotion, distribution and capacity to win share, while its sales are still small.
Managers must decide which question marks to back. Investing in all of them spreads money too thinly, and some will never become leaders. A question mark that wins share becomes a star; one that fails to win share as the market slows becomes a dog.
Stars
A star is a product with a high relative market share in a fast-growing market. It is a market leader in an attractive market, so it earns large revenues. However, it also needs large investment to keep up with the growing market and to defend its lead against rivals, so it may generate little spare cash for now.
Stars are often the future of the business. If a star keeps its leadership as its market matures and growth slows, it becomes a cash cow.
Cash cows
A cash cow is a product with a high relative market share in a slow-growing market. It is a market leader in a mature market, where there are few new customers to win and competitors are well known. Because it is the largest seller, it usually benefits from economies of scale and strong brand loyalty, so its costs per unit are low and its profit margins high. It needs little spending on growth.
Cash cows are the main source of funds for the rest of the portfolio. The surplus cash they produce pays for research and development, for building question marks and for supporting stars, as well as for dividends to shareholders.
Dogs
A dog is a product with a low relative market share in a slow-growing or declining market. It is a follower in an unattractive market, so it usually earns low profits and has little prospect of improving its position. Some dogs make a small profit or a small loss; others are kept because they complete a product range or have loyal customers.
Coca-Cola’s Tab, one of the first diet colas, launched in the 1960s, had by 2020 become a small brand in a mature market, the typical position of a dog. In October 2020 Coca-Cola announced that it would stop making Tab, along with several other under-performing brands, as part of an effort to cut its weaker products during the COVID-19 pandemic.
Cash flow implications
The BCG matrix is above all a model of cash flow. It rests on two ideas. First, a high relative market share tends to generate cash, because the market leader has the highest sales and usually the lowest unit costs. Second, a high market growth rate tends to use cash, because a product in a growing market needs investment in capacity, stock and promotion just to keep its share.
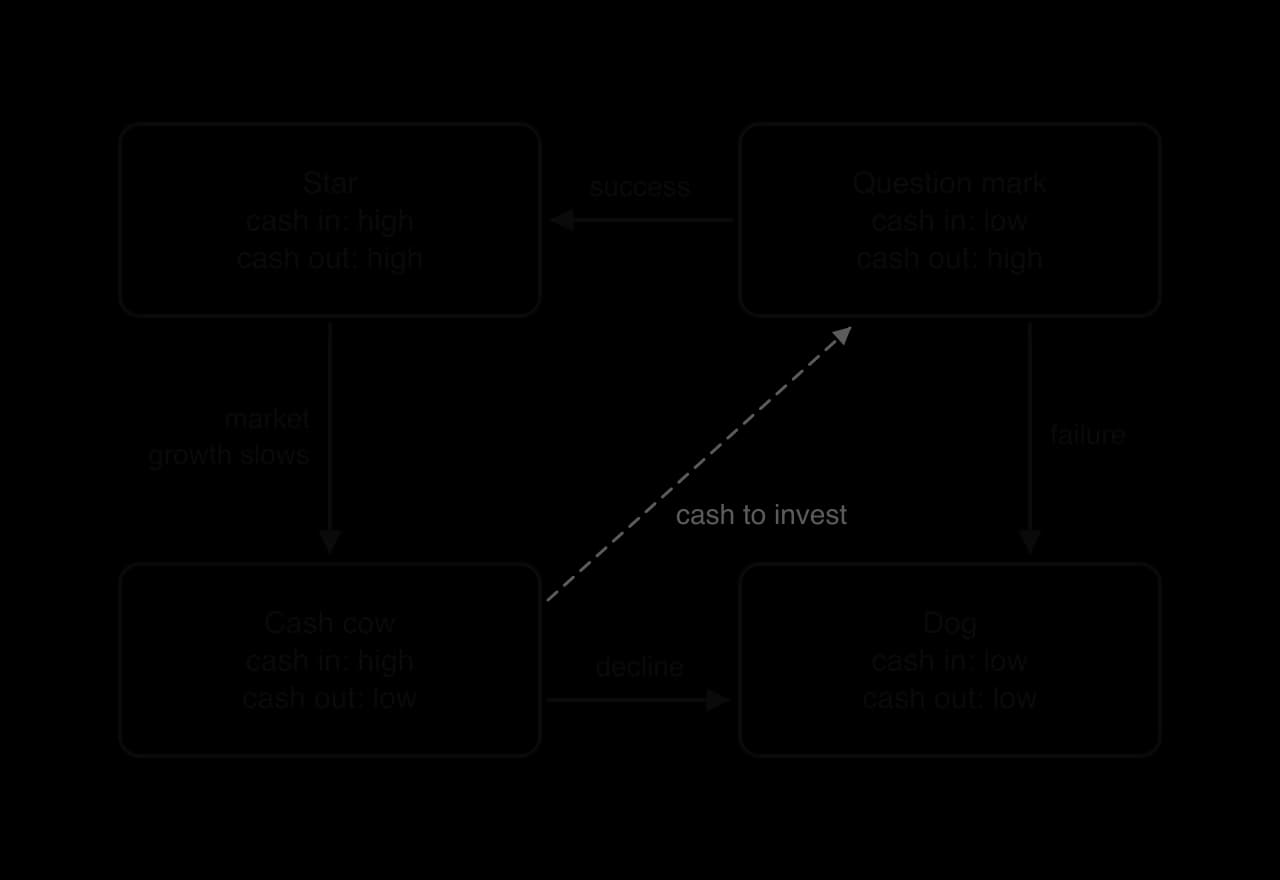
Combining the two ideas gives the cash position of each category, set out in the diagram and the table. The arrows show how products move over time. The dashed arrow is the most important: cash from cash cows is used to build selected question marks into stars, which later become the next generation of cash cows.
Category | Cash generated | Cash needed | Net cash flow | Typical strategy |
|---|---|---|---|---|
Question mark | Low (small share) | High (growing market, winning share) | Strongly negative | Build selectively, or divest |
Star | High (market leader) | High (growing market, defending share) | About zero; may be positive or negative | Hold or build |
Cash cow | High (market leader, low unit costs) | Low (mature market) | Strongly positive | Hold or harvest |
Dog | Low (small share) | Low (mature or declining market) | About zero or negative | Harvest or divest |
A balanced portfolio has enough cash cows to fund its question marks and stars, and enough question marks and stars to replace the cash cows when their markets decline. A business with only cash cows may be profitable today but has no future products. A business with many question marks and no cash cows needs cash from outside, such as loans or new shares, to fund them. A business with many dogs ties up money and management time in products with little future.
Strategies for each category
The BCG matrix suggests four strategies, one or two for each category. They describe how much investment a product should receive relative to the cash it generates.
A build strategy means spending more cash than the product earns, on promotion, lower prices, wider distribution or product improvements, accepting low profit now for a stronger position later. It suits question marks with a real chance of leadership and stars facing strong rivals.
A hold strategy protects a strong position. For a star it means matching the growth of the market; for a cash cow it means spending enough on promotion and quality to keep loyal customers and deter rivals, without large new investment.
A harvest strategy reduces spending on promotion, research and development and support, and may raise prices, so that the product releases as much cash as possible before it declines. It suits cash cows in markets that are starting to shrink and dogs that are still profitable.
A divest strategy removes products that use money and management time without a good return. Procter & Gamble, the US consumer goods company, announced in August 2014 that it would sell or discontinue about 100 brands to concentrate on a smaller core that produced most of its profit. As part of this, it sold 43 beauty brands to Coty in a deal valued at US$12.5 billion when it was agreed in 2015 and completed in October 2016.
Strategy | Usually applied to | Effect on cash now | Aim |
|---|---|---|---|
Build | Question marks (and stars under attack) | Uses cash | Raise market share to become a leader |
Hold | Stars and strong cash cows | Roughly neutral | Keep market share |
Harvest | Cash cows in maturing markets, weak dogs | Releases cash | Maximise short-term cash before decline |
Divest | Dogs and weak question marks | Releases cash from a sale | Free resources for better products |
Constructing a BCG matrix from data
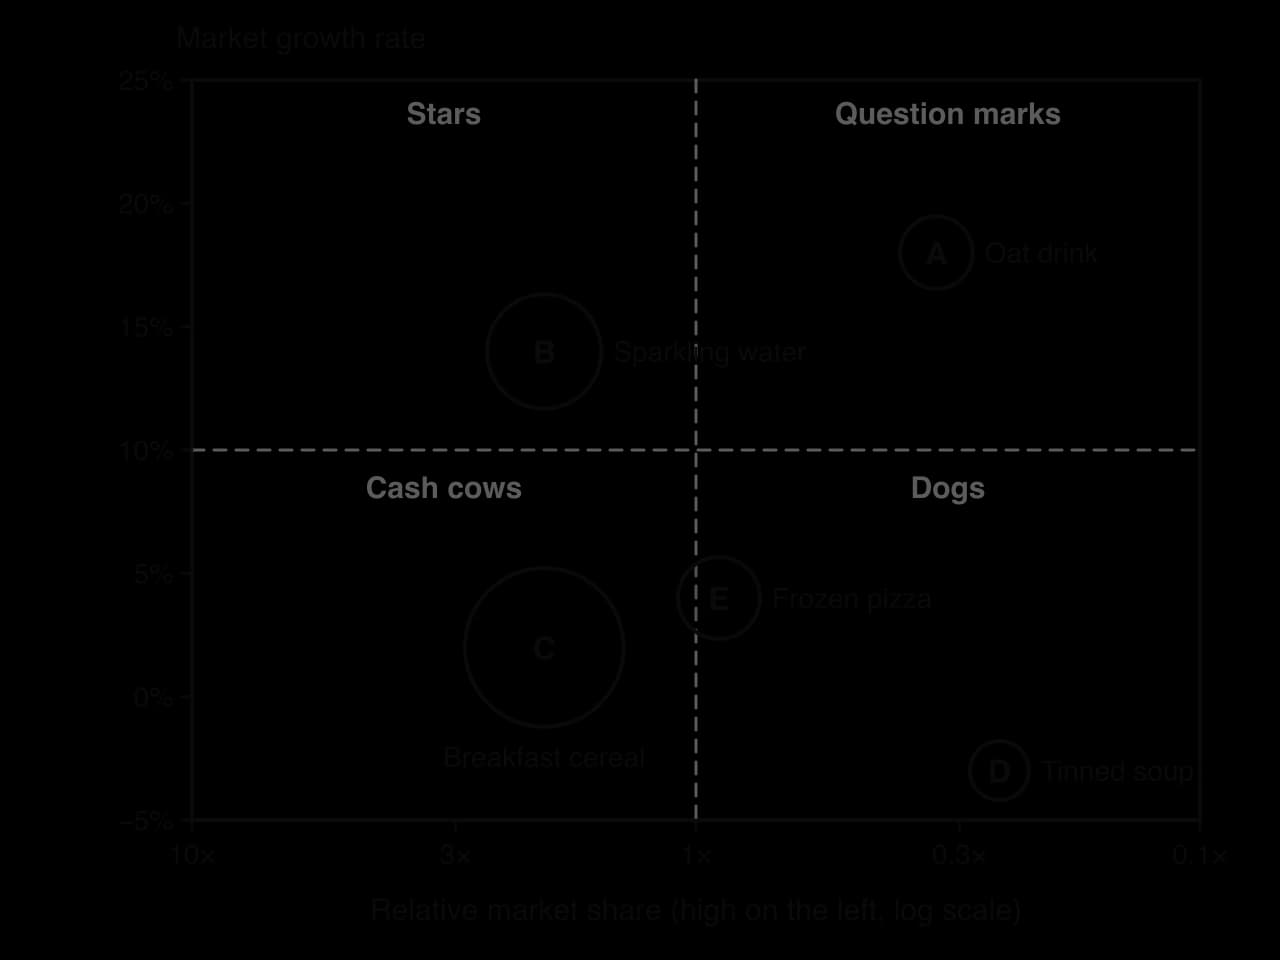
A BCG matrix can be sketched from general knowledge, but it is most useful when built from data. Each product is drawn as a circle whose position shows its relative market share and market growth rate, and whose size shows its sales revenue, so the diagram also shows which products matter most to the business.
Calculate the market growth rate of each product’s market from market sales in two years.
Calculate the relative market share of each product from its share and the share of its largest competitor.
Draw and label the axes: market growth rate vertically (high at the top) and relative market share horizontally (high on the left), with the dividing lines (for example a relative share of 1.0 and growth of 10%) and the four cells named.
Plot each product at its two values, as a circle whose area is in proportion to its sales revenue, and label it.
Interpret the portfolio: identify each product’s category, judge the balance of the portfolio and recommend a strategy for each product.
The data for a hypothetical food and drinks company, Verda Foods, are in the table. Market sizes and sales revenue are in $ million.
Product | Market sales last year ($m) | Market sales this year ($m) | Verda’s market share (%) | Largest competitor’s share (%) | Verda’s sales revenue ($m) |
|---|---|---|---|---|---|
A Oat drink | 125.0 | 147.5 | 8 | 24 | 11.8 |
B Sparkling water | 85.0 | 96.9 | 30 | 15 | 29.1 |
C Breakfast cereal | 220.0 | 224.4 | 25 | 12.5 | 56.1 |
D Tinned soup | 160.0 | 155.2 | 5 | 20 | 7.8 |
E Frozen pizza | 80.0 | 83.2 | 18 | 20 | 15.0 |
The calculation of C’s share of revenue is: 56.1 ÷ (11.8 + 29.1 + 56.1 + 7.8 + 15.0) × 100 = 56.1 ÷ 119.8 × 100 = 46.83%. Figures like this help to judge how dependent a business is on a single product.
The BCG matrix and the product life cycle
The BCG categories are closely linked to the stages of the product life cycle, because market growth is fastest in the growth stage and slowest in maturity and decline. A typical product passes through the matrix as it moves through its life cycle.

At introduction, sales and share are low and the market is new and growing, so the product is a question mark. If it wins share during the growth stage, it becomes a star. In maturity the market’s growth slows, and a product that has kept its lead becomes a cash cow. In decline, both the market and the product’s position weaken, and it becomes a dog.
Managers use extension strategies to keep cash cows in the maturity stage for longer, for example by launching new versions, finding new markets or repositioning the brand. The cash from cash cows funds the launch of new products, which start the cycle again as question marks.
Uses of the BCG matrix
The BCG matrix is used wherever a business must divide limited resources between several products or units. In marketing it guides decisions on product development, promotion budgets and when to withdraw a product. In finance it helps to plan cash flow and to decide which projects to fund. In strategy it supports decisions on growth, acquisitions and disposals, and it is often used together with the Ansoff matrix (to choose how new question marks are found) and SWOT analysis (to judge each unit’s strengths and the threats it faces).
Limitations of the BCG matrix
The BCG matrix is simple, visual and easy to communicate, and it focuses attention on the balance of a portfolio and on cash. Its usefulness depends on the quality of the data and on whether its assumptions fit the business. Its main limitations are these.
Data are hard to obtain. Accurate market sizes and competitors’ market shares are expensive to find and may not exist for new or niche markets. Defining the market (soft drinks, or only sparkling water?) changes both measures.
Only two factors are used. Profitability, competition, brand strength, the cost of entry and the product’s fit with the business are all ignored, although they may matter more than share or growth.
Market share does not always bring cash. The link between share and low costs depends on economies of scale, which are weak in some industries. A small, focused firm with a premium product can be very profitable with a low relative share.
The categories are too simple. Many products sit near the dividing lines, and where the lines are drawn (1.0 and 10%, or a market average) is a judgment that can change a product’s category.
It is a snapshot. The matrix shows one moment. Markets and shares change, so a product classified as a dog today may grow again after a change in technology or tastes.
It can lead to self-fulfilling decisions. Labelling a product a dog and cutting its support may cause the decline that the label predicted. Products also depend on each other: a dog may be needed to complete a range or to attract customers to other products.
The matrix is therefore most useful as a starting point for discussion about a portfolio, especially for large firms with many products in clearly defined markets and reliable market data. It is less useful for small businesses with one or two products, for new markets with little data, or where products are linked. Its recommendations need to be tested against the business’s objectives, finance, competitors and the views of its stakeholders before managers act on them.
Case study: Unilever’s portfolio and the Magnum demerger
Unilever is a British consumer goods company that sells brands such as Dove, Vaseline, Hellmann’s, Knorr, Domestos and Comfort around the world. In 2024 its sales revenue (which Unilever calls turnover) was €60.8 billion, earned by five business groups: Beauty & Wellbeing, Personal Care, Home Care, Foods and Ice Cream. During 2024 it prepared to separate its Ice Cream business, and on 6 December 2025 it completed the demerger, creating The Magnum Ice Cream Company as a separate company listed in Amsterdam, London and New York.
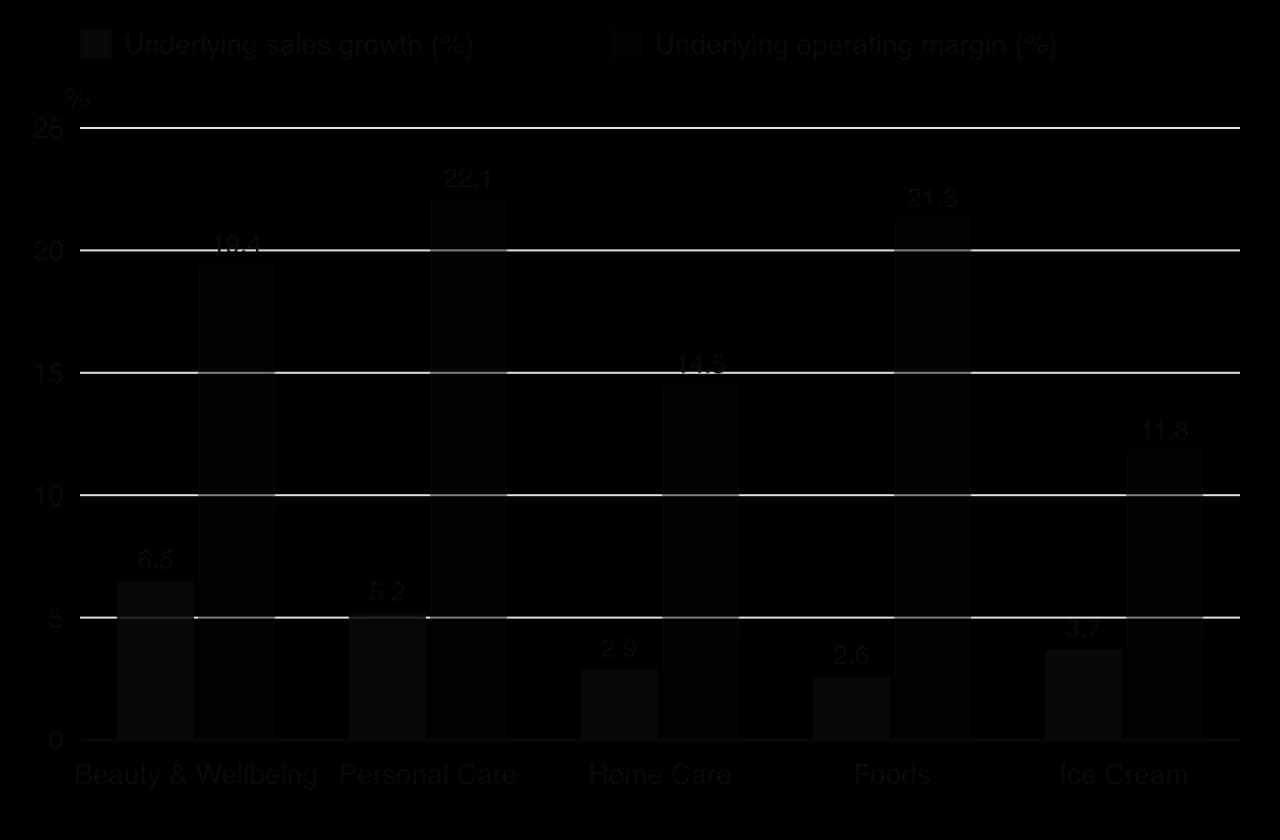
The chart shows two of the measures Unilever reports for each business group in 2024: underlying sales growth (the growth of its own sales, excluding currency changes and acquisitions) and underlying operating margin (underlying operating profit, close to profit before interest and tax, as a percentage of sales revenue). Beauty & Wellbeing grew by 6.5% and Personal Care by 5.2%, while Home Care and Foods grew by under 3%. Margins ranged from 22.1% in Personal Care to 11.8% in Ice Cream.
Business group (2024) | Sales revenue (€bn) | Share of group sales revenue | Underlying sales growth | Underlying operating margin |
|---|---|---|---|---|
Beauty & Wellbeing | 13.2 | 22% | 6.5% | 19.4% |
Personal Care | 13.6 | 22% | 5.2% | 22.1% |
Home Care | 12.3 | 20% | 2.9% | 14.5% |
Foods | 13.4 | 22% | 2.6% | 21.3% |
Ice Cream | 8.3 | 14% | 3.7% | 11.8% |
Unilever group | 60.8 | 100% | 4.2% | 18.4% |
A BCG analysis of Unilever has to be built with care, because the company does not publish relative market shares and its sales growth is not the same as market growth. With that warning, the data suggest a pattern. Foods, where Hellmann’s and Knorr made up about 60% of the group’s sales revenue, behaves like a cash cow: slow growth (2.6%) but a high margin (21.3%) from strong brands in mature markets. Within Beauty & Wellbeing, newer premium brands such as Liquid I.V. and Nutrafol grew by double digits, giving the group the character of a star or a group of promising question marks that Unilever has chosen to build.
Ice Cream is harder to classify. Unilever said the business owned five of the ten best-selling ice cream brands in the world, which suggests a high relative market share, but its margin was the lowest in the group and it warned that rising cocoa and dairy costs would put pressure on margins in 2025. Ice cream also has to be kept frozen from factory to shop, which gives it a very different supply chain from shampoo or soap. Unilever concluded that the business would do better on its own and that the rest of Unilever would be simpler without it.
Unilever’s actions since then match the BCG strategies. It has followed a build strategy in premium personal care and beauty, buying Wild (April 2025) and Dr. Squatch (September 2025) and, through Hindustan Unilever, the Indian beauty brand Minimalist (April 2025). It has divested smaller, mainly food brands, selling Conimex (April 2025), The Vegetarian Butcher (September 2025), the skincare brand Kate Somerville (November 2025) and Graze (February 2026). In 2025 its Power Brands, the largest brands that receive most of its investment, made up 78% of sales revenue. Its chief executive, Fernando Fernandez, summed up the aim in the 2025 results.
building a brand portfolio for the future, with more Beauty, Wellbeing and Personal Care
— Fernando Fernandez, Chief Executive Officer, Unilever plc 2025 Full Year Results, 12 February 2026
The matrix explains clearly why Unilever moves cash from mature, high-margin brands into faster-growing categories, and why it removes units that need large investment for low returns.
The case also shows the limits of the matrix. The data are business groups, not single products, and each group contains brands in every category; growth figures are Unilever’s own, not the market’s; and the decision to demerge Ice Cream rested on factors the matrix ignores, such as its different supply chain and margins. A BCG matrix is therefore a useful first view of Unilever’s portfolio, but the decisions also depended on profit margins, cost pressures and the views of investors.
Sources: Unilever plc, 2024 Full Year Results (13 February 2025) and 2025 Full Year Results (12 February 2026), both filed with the US Securities and Exchange Commission on Form 6-K.
Using the data, explain why Unilever’s Foods business group can be described as a cash cow.
Explain two reasons why it is difficult to construct an accurate BCG matrix for Unilever’s business groups.
Explain how Unilever’s acquisitions and disposals in 2025 illustrate the build and divest strategies.
Exam practice
The BCG matrix appears in Papers 1 and 2, often alongside the product life cycle. Questions ask students to define a category, calculate relative market share or market growth, construct or complete a matrix from data, explain the position of a product, or recommend a strategy for a product or a portfolio. In Paper 2 the data for a matrix are usually given in a table.
Calculation questions are usually short but must show the formula and the working.
Summary
The BCG matrix analyses a product portfolio by market growth rate (vertical axis) and relative market share (horizontal axis, high on the left).
Market growth rate is the percentage change in total market sales; relative market share is a product’s share divided by its largest competitor’s share.
Question marks (low share, high growth) need cash; stars (high share, high growth) roughly pay for themselves; cash cows (high share, low growth) generate surplus cash; dogs (low share, low growth) generate little.
A balanced portfolio uses cash from cash cows to build question marks into stars, which later become cash cows.
The four strategies are build, hold, harvest and divest.
Built from data, each product is a circle positioned by its two measures and sized by its revenue.
Products tend to move from question mark to star, cash cow and dog along the product life cycle.
Limitations include hard-to-find data, only two factors, a weak link between share and cash in some industries, a static snapshot and arbitrary dividing lines.
Self-check
- To do:
I can explain the purpose of portfolio analysis and the two axes of the BCG matrix.
- To do:
I can calculate market growth rate and relative market share, including for a market leader.
- To do:
I can describe question marks, stars, cash cows and dogs.
- To do:
I can explain the cash flow of each category and what makes a portfolio balanced.
- To do:
I can construct a BCG matrix from data, with circles sized by revenue.
- To do:
I can recommend build, hold, harvest or divest strategies using data from a case.
- To do:
I can explain the link with the product life cycle and the limitations of the BCG matrix.