Learning objectives
Explain why only relevant costs, including avoidable fixed costs, matter in short-term decisions.
Calculate whether a business should make or buy a component using contribution and avoidable fixed costs.
Apply contribution costing to decide whether to drop a product or accept a special order.
Calculate the full cost of a product using absorption costing, allocating overheads by floor space, labour hours or machine hours.
Distinguish between contribution costing and absorption costing.
Analyse the qualitative factors that affect make-or-buy, product and special order decisions.
Apply contribution and absorption costing to a real business decision.
Introduction
Managers often have to decide whether to keep or drop a product, whether to accept an order at a low price, or whether to make a component themselves or buy it from a supplier. The answer depends on which costs change as a result of the decision. Contribution, the difference between revenue and variable costs, is the tool that separates those costs from the ones that stay the same, while absorption costing shares out all costs to work out the full cost of each product.
These decisions are linked to the key concepts. Buying in instead of making raises questions of ethics about suppliers’ working conditions and of sustainability about long supply chains, and dropping a product can cost jobs. They also involve change, because a business that buys in a component gives up some control over its own future.
Contribution and relevant costs
Contribution is sales revenue minus variable costs. Contribution per unit is the price minus the variable cost per unit, and total contribution is the contribution from all the units sold, which pays the fixed costs first and then provides profit. In break-even analysis, contribution shows how many units a business must sell. In short-term decisions, it shows how much a decision adds to or takes away from profit.
The reason is that most fixed costs do not change when a business makes a short-term decision. Rent, insurance and managers’ salaries are paid whether a business accepts one extra order or not, so they cannot affect the choice between the options. Only costs that change as a result of the decision matter. These are called relevant costs.
Fixed costs are therefore split into two groups. Avoidable fixed costs are fixed costs that would stop if a decision were taken, for example the salary of a supervisor who works only on the product being dropped, or the lease on a machine used only for one component. Unavoidable fixed costs continue whatever is decided, for example a share of the factory rent or the managing director’s salary. Avoidable fixed costs are relevant; unavoidable fixed costs are not.
Cost | Relevant to a short-term decision? | Why |
|---|---|---|
Variable costs (materials, piece-rate labour, energy per unit) | Yes | They change with the number of units made or sold. |
Avoidable fixed costs (a dedicated machine lease, a product manager) | Yes | They stop if the activity stops. |
Unavoidable fixed costs (factory rent, head office costs) | No | They are paid whichever option is chosen. |
Sunk costs (money already spent, such as past research) | No | They cannot be recovered whatever is decided. |
Opportunity cost (income from the best alternative use of a resource) | Yes | Choosing one option gives up the income from the other. |
The opportunity cost of a resource also counts. If the space used to make a component could be rented to another firm, the rent given up is a cost of continuing to make the component, even though no money is paid out.
Contribution analysis is a short-run tool. In the long run almost every cost can be avoided: leases end, factories can be sold and staff numbers changed. Long-term decisions about whether to stay in a market therefore consider all costs, which is one reason absorption costing is also used.
Make or buy analysis
Every business decides which goods and services to produce itself and which to buy from other firms. A furniture maker can sew its own cushions or buy them; a restaurant can bake its own bread or order it from a bakery; a car maker can make its own seats or buy them from a specialist. This is the make-or-buy decision, and it is closely linked to outsourcing.
The basic comparison uses the cost to buy (CTB) and the cost to make (CTM), which are taught with production planning:
where P is the supplier’s price per unit, Q the quantity needed, FC the fixed costs of making and AVC the average variable cost per unit. If CTB is lower than CTM, the business should buy, and if CTM is lower, it should make. The contribution approach refines this comparison by asking which of the fixed costs would really disappear if the business stopped making.
The contribution approach to make or buy
The relevant cost of making is the variable cost of production plus only the avoidable fixed costs, and any opportunity cost of the space or machines used. The fixed costs that would remain if the business bought in, such as its share of rent, are left out, because they are paid in either case.
Put another way, making saves the difference between the purchase price and the variable cost on every unit, and this saving must be large enough to pay for the avoidable fixed costs. If (purchase price − variable cost per unit) × quantity is greater than the avoidable fixed costs, making is cheaper.
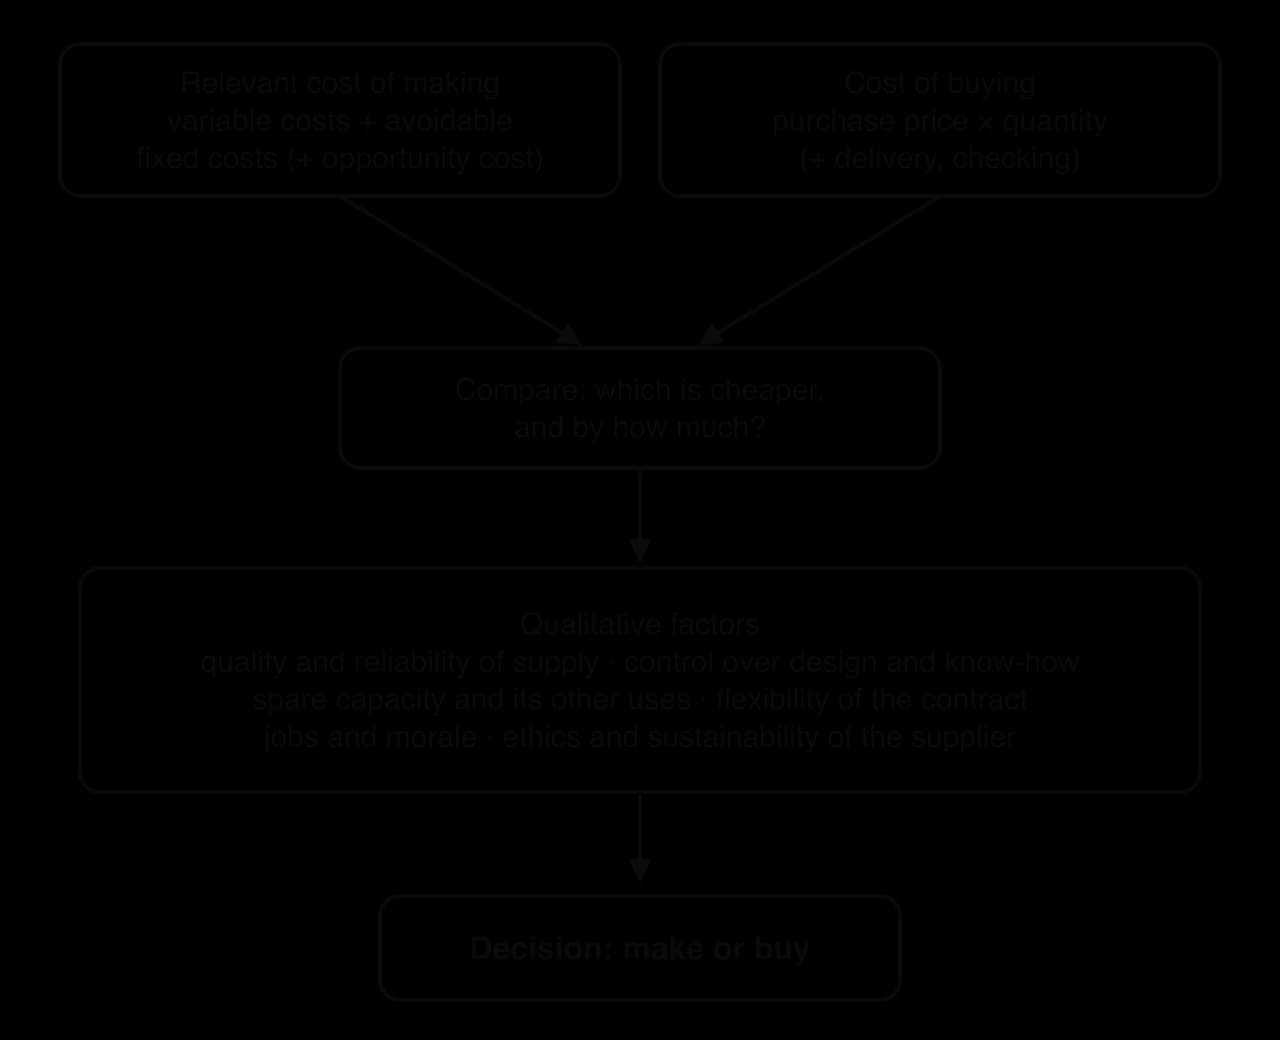
The flow diagram shows the two stages of the decision. The first stage is a calculation, and the second is a judgment about quality, control and risk that the calculation cannot capture.
The result depends on the quantity. Making saves $5 per cushion and costs $18,000 of avoidable fixed costs, so the two options cost the same at $18,000 ÷ $5 = 3,600 cushions. Below 3,600 a year, buying is cheaper; above it, making is cheaper. The chart shows this crossing point.
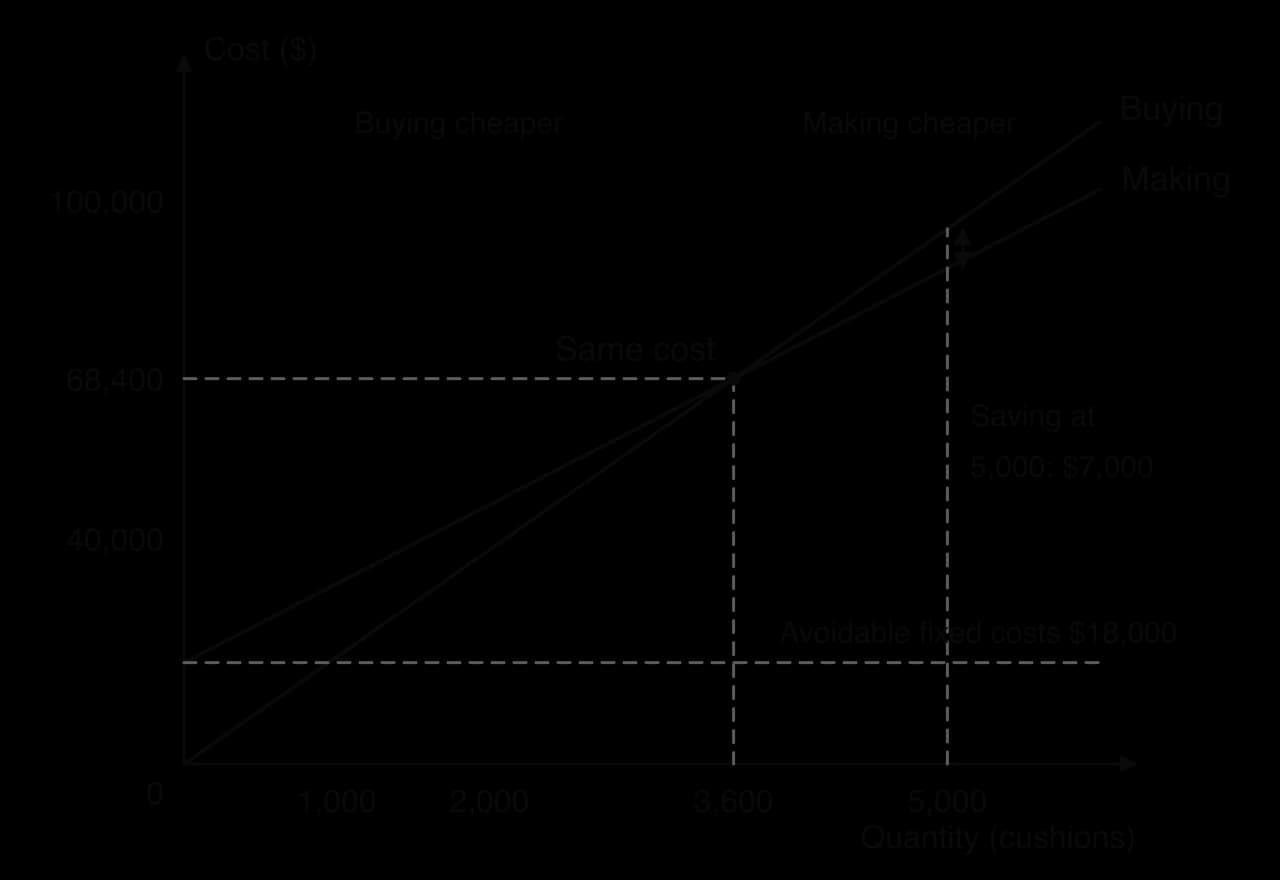
Opportunity cost can change the answer. Suppose another firm would rent the sewing department’s floor space for $10,000 a year if Tallis stopped using it. The rent forgone is a cost of making, so the relevant cost of making rises to $88,000 + $10,000 = $98,000, against $95,000 for buying. Buying would then be $3,000 cheaper.
Qualitative factors in make or buy
A small difference in cost is often outweighed by other factors. The table sets out the main ones.
Factor | Favours making when… | Favours buying when… |
|---|---|---|
Quality | the business can control quality more closely itself | a specialist supplier has better skills or equipment |
Reliability of supply | suppliers are unreliable, far away or exposed to disruption | several reliable suppliers compete for the order |
Control and know-how | the item is central to the product or uses secret technology | the item is standard and easy to source |
Capacity | the business has spare capacity that would otherwise be idle | its capacity is full and could be used for more profitable work |
Flexibility | demand is stable and long-term | demand is uncertain, so buying avoids fixed costs |
Jobs and morale | buying in would mean redundancies and damage morale | staff can be moved to other work |
Ethics and sustainability | the supplier’s working conditions or environmental record are poor | the supplier is certified and closer to the business |
Nike shows how far buying can go. The company designs, markets and distributes its products, but nearly all its footwear and clothing is made by independent contract manufacturers outside the United States. In the year to May 2025, Nike Brand footwear was made by 15 contract manufacturers operating 97 factories in 11 countries, with Vietnam, Indonesia and China making about 51%, 28% and 17% of it. Buying keeps Nike’s fixed costs low and lets it concentrate on design and brand, but it depends on suppliers’ standards, which have been a source of ethical criticism in the past.
Sources: NIKE, Inc., Form 10-K for the fiscal year ended 31 May 2025.
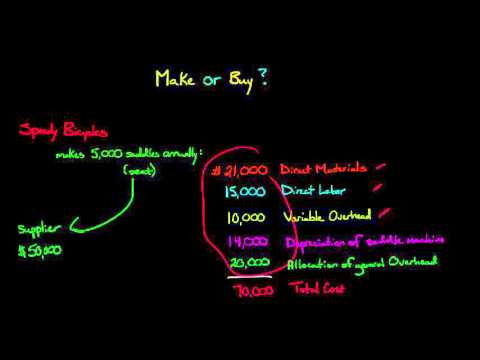
The Edspira video sets out a make-or-buy decision with relevant costs and shows why unavoidable fixed costs are left out.
 YouTube
Evaluation: make or buy analysis
Make or buy analysis gives a clear financial answer based on the costs that would really change, which avoids the mistake of counting unavoidable costs. Its weakness is that the figures are estimates: suppliers may raise prices once the business has closed its own department, and the costs of managing a supplier (checking quality, negotiating contracts, transport) are easy to underestimate. Some avoidable costs, such as redundancy payments, appear only once and must be included in the first year.
Whether to make or buy depends on how important the item is to the product, how reliable and competitive the supply market is, how much spare capacity the business has, the quantity needed and how stable demand is. A business usually buys standard items and makes those that give it a competitive advantage. A sound decision combines the calculation with these factors and reviews it as conditions change.
Contribution costing
Contribution costing judges each product, order or department by the contribution it makes, rather than by a profit figure after a share of fixed costs has been charged to it. Fixed costs are treated as a single total for the business and are not shared out between products.
The logic is that allocating fixed costs is unnecessary for short-term decisions and can be misleading. Whatever share of rent is charged to a product, the rent is paid in full whether the product is made or not. A product that covers its own variable costs and makes a positive contribution is adding to the money available to pay the fixed costs, even if it shows a “loss” after an allocation of overheads.
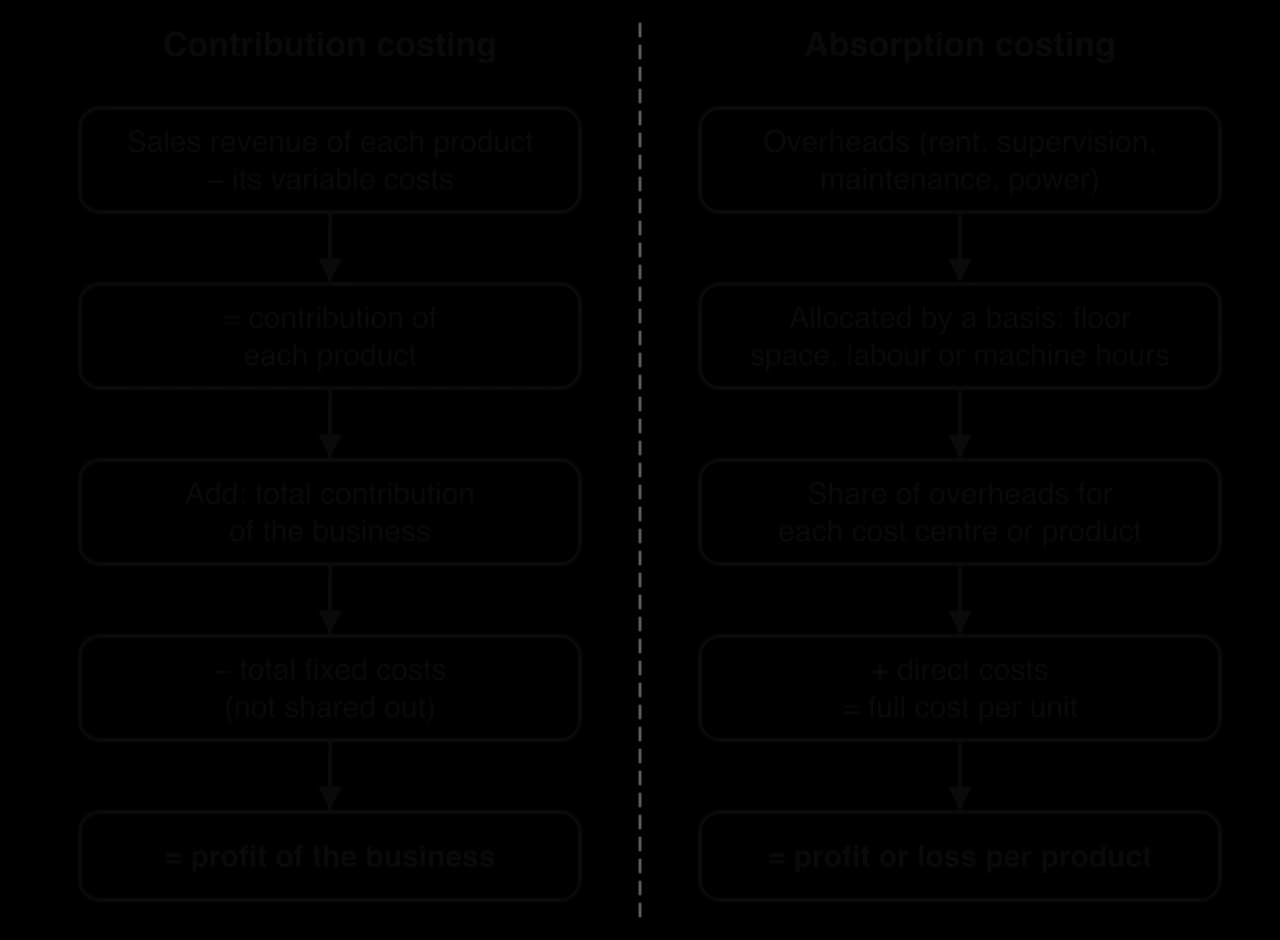
The diagram compares the two methods. The left-hand route suits short-term decisions; the right-hand route suits pricing and long-term reviews of whether products cover all their costs.
Deciding whether to drop a product
A business that allocates its fixed costs to products may find that one of them appears to make a loss. Contribution costing tests whether dropping that product would really raise profit.
Harbour Foods makes soups, sauces and snacks. Its fixed costs of $200,000 a year are shared between the products according to the floor space each uses. Its statement of product profit for last year is set out in the table (hypothetical data).
$ | Soups | Sauces | Snacks | Total |
|---|---|---|---|---|
Sales revenue | 300,000 | 200,000 | 150,000 | 650,000 |
Variable costs | (180,000) | (110,000) | (120,000) | (410,000) |
Allocated fixed costs | (90,000) | (60,000) | (50,000) | (200,000) |
Profit or (loss) | 30,000 | 30,000 | (20,000) | 40,000 |
Other factors also matter. Some products are bought together, so dropping one can reduce sales of another: a café that stops selling cakes may sell less coffee. A product in the early stages of its life cycle may make little contribution now but much more later. And dropping a product may mean redundancies, which have costs of their own and affect morale.
In the long run, fixed costs can become avoidable, which changes the decision. In April 2018 Ford announced that, because of declining demand and profitability, it would not invest in new generations of traditional sedans for North America and that its car range there would be reduced to the Mustang and a new Focus Active crossover. A decision not to replace a model is a long-run one: the factories, tooling and development spending for new sedans would be avoided, so their full costs were relevant.
Sources: Ford Motor Company, first quarter 2018 results press release, 25 April 2018 (Form 8-K).
Accepting a special order
A special order is a one-off order, often for a large quantity, at a price below the normal selling price. A hotel chain might ask a pottery for mugs printed with its logo, or a supermarket might ask a manufacturer for extra stock for a promotion. The question is whether the order adds to profit.
Using contribution costing, a special order is worth accepting financially when the price covers its variable costs and any extra costs it creates, so that it makes a positive contribution, and when the business has enough spare capacity to make it without giving up normal sales. Fixed costs are ignored because they are already covered by normal sales and do not change.
Qualitative factors can still lead a business to refuse a profitable special order. Regular customers who learn about the low price may demand the same discount. A low price can damage the image of a premium brand. On the other hand, a special order may lead to regular business with a large customer, keep staff busy in a quiet season, and spread the business’s name. A special order should not become a habit: if all sales were made at prices that only cover variable costs, the fixed costs would never be paid.
Evaluation: contribution costing
Contribution costing is simple, avoids the arbitrary sharing of fixed costs, and gives correct answers to short-term questions such as whether to drop a product, accept an order or make a component. Its weakness is its short-term focus. It can encourage managers to accept low-priced work that covers variable costs but leaves too little contribution to pay the fixed costs, and it does not show whether each product covers its full cost in the long run. Contribution costing is therefore most useful for one-off decisions with spare capacity, and least useful for setting normal prices or long-term product strategy, where absorption costing adds information.
Absorption costing
Absorption costing takes the opposite approach. It charges every product with a share of the business’s overheads, so that each product has a full cost per unit that includes both its direct costs and part of the fixed costs. The overheads are said to be “absorbed” into the cost of the products.
Direct costs, such as materials and production labour, can be traced to a product. Overheads, such as rent, supervision, maintenance and power for the whole factory, cannot. To share them out, a business first divides itself into cost centres, such as departments, product lines or machines, and then allocates each overhead between them using a basis that reflects how much of the overhead each centre causes.
Allocation basis | Suits overheads such as… | Reason |
|---|---|---|
Floor space (square metres) | Rent, business rates, heating, cleaning, building insurance | A department using more space causes more of these costs. |
Labour hours | Supervision, canteen, HR department, staff welfare | These costs rise with the number of employees and hours worked. |
Machine hours | Machine maintenance, power for machinery, depreciation of equipment | These costs rise with the use of machines. |
Number of employees or units produced | Personnel costs; general administration | A simple basis when no closer link exists. |
The method follows a fixed sequence:
Identify the total of each overhead.
Choose a basis for each overhead and find each cost centre’s share of that basis.
Allocate each overhead to the cost centres in proportion to the basis.
Add up each cost centre’s total overheads.
Divide each cost centre’s overheads by its output to find the overhead per unit, and add the direct cost per unit to get the full cost per unit.
Set a price, for example by adding a mark-up to the full cost, or compare the full cost with the current price.
Lumen Print has three departments: books, posters and packaging. Its annual overheads are rent $60,000, supervision $30,000, and machine maintenance and power $40,000. The table gives the data for each department (hypothetical data).
Books | Posters | Packaging | Total | |
|---|---|---|---|---|
Floor space (m²) | 500 | 300 | 200 | 1,000 |
Labour hours | 6,000 | 3,000 | 1,000 | 10,000 |
Machine hours | 2,000 | 1,000 | 5,000 | 8,000 |
Units produced | 20,000 | 16,000 | 8,000 | |
Direct cost per unit ($) | 4.00 | 2.00 | 6.00 |
How the choice of basis changes the answer
The full cost of a product depends on the bases chosen. If Lumen Print shared all $130,000 of overheads by floor space alone, books would receive 50% ($65,000), posters 30% ($39,000) and packaging 20% ($26,000). The overhead per unit of packaging would fall from $5.00 to $3.25 and its full cost from $11.00 to $9.25, while books would rise to $7.25 and posters to about $4.44.
Full cost per unit ($) | Books | Posters | Packaging |
|---|---|---|---|
Three bases (floor space, labour hours, machine hours) | 6.90 | 4.00 | 11.00 |
One basis (floor space only) | 7.25 | 4.44 | 9.25 |
Packaging uses most of the machine hours, so the single basis under-charges it for maintenance and power and over-charges books and posters. A business pricing on full cost could then set the price of packaging too low and the price of books too high. The more closely each basis matches what causes the overhead, the more reliable the full cost.
Evaluation: absorption costing
Absorption costing makes sure that every product carries a share of all the business’s costs, which matters for setting prices that cover all costs in the long run, for example with cost-plus pricing. It is also used in published accounts to value stock and in tenders where a client wants to see that a price covers full costs. Because it shows a full cost and a profit for each product, it helps managers identify products that, over time, do not earn enough to justify the resources they use.
Its weaknesses come from the allocation itself. The choice of basis is partly subjective, so different accountants can produce different full costs for the same product, and a product can appear to make a loss only because of the basis chosen. Using a full cost in a short-term decision, such as a special order, can lead to the wrong answer, as the Kaya Ceramics and Harbour Foods examples show. Absorption costing is most useful for normal pricing and long-term reviews in businesses whose overheads can be linked to clear causes, and least useful for one-off decisions.
Comparing contribution costing and absorption costing
Contribution costing | Absorption costing | |
|---|---|---|
Treatment of fixed costs | Kept as a total for the business; not shared out | Allocated to cost centres and products by a basis |
Result for each product | Contribution | Full cost per unit and profit or loss |
Best suited to | Short-term decisions: special orders, make or buy, dropping a product, using spare capacity | Normal pricing, long-term product reviews, valuing stock, tendering |
Main strength | Simple; avoids arbitrary allocation; gives correct short-term answers | Shows whether each product covers all its costs |
Main weakness | May lead to prices that do not cover fixed costs in the long run | Allocation is subjective and can make profitable products look loss-making |
The two methods answer different questions, so businesses often use both. Contribution costing shows how profit would change if a decision were taken. Absorption costing shows whether a product covers its share of all the business’s costs over time. A manager deciding whether to accept a one-off order should use contribution; a manager setting the standard price list or reviewing the product range for next year should look at full costs as well.
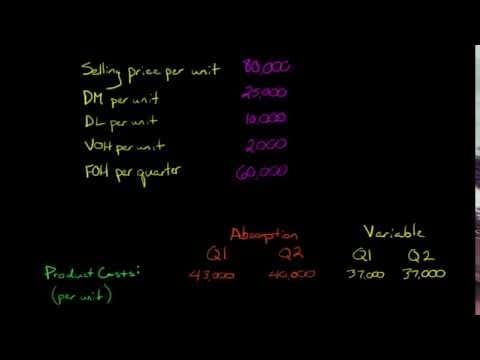
An Edspira video compares a costing method that charges only variable costs to products with absorption costing.
 YouTube
Uses and limitations of the tool
Contribution and absorption costing appear across the course. Contribution underlies break-even analysis, where fixed costs are divided by contribution per unit, and contribution pricing, where a price is set above variable cost in order to win sales. Make or buy analysis supports decisions about outsourcing and insourcing in operations, and CTB and CTM in production planning. Absorption costing links to cost centres and budgets, and to cost-plus pricing in marketing.
The tool has the same limitations as other quantitative methods:
Reliability of data. Variable costs, supplier prices and the split between avoidable and unavoidable fixed costs are estimates, and suppliers can change their prices after a business has stopped making an item.
Classification of costs. Some costs are semi-variable, and whether a fixed cost is avoidable depends on the time period and on contracts, so different managers can reach different answers.
Subjectivity of allocation. In absorption costing the choice of basis changes the full cost and the apparent profit of each product.
Short-term focus. Contribution decisions ignore fixed costs, which must be covered in the long run.
Qualitative factors. Quality, control, reliability, customer reactions, staff morale, ethics and sustainability are left out of the numbers and often decide the outcome.
Case study: Apple’s switch to its own Mac processors
Until 2020 Apple’s Mac computers used main processors bought from Intel. On 22 June 2020 it announced that the Mac would move to Apple silicon, processors that Apple designs itself, and that it expected to complete the transition in about two years. The first chip, the M1, appeared in Mac computers launched on 10 November 2020. It was built on a 5-nanometre process and contained 16 billion transistors. The transition was completed on 5 June 2023, when Apple launched a Mac Pro with Apple silicon, about three years after the announcement.
Date | Event |
|---|---|
22 June 2020 | Apple announces that the Mac will move from Intel processors to Apple silicon within about two years. |
10 November 2020 | First Macs with the M1 chip (5-nanometre process, 16 billion transistors). |
5 June 2023 | Mac Pro with Apple silicon completes the transition, about three years after the announcement. |
6 August 2025 | Apple states that TSMC’s Arizona plant produces tens of millions of chips for Apple. |
The decision was a make-or-buy decision of an unusual kind. Apple chose to “make” the design of the chip: its own engineers design the processors, building on the A-series chips it already used in iPhone and iPad, such as the A12Z Bionic that powered the development kit it lent to software developers in 2020.
Apple continued, however, to “buy” the manufacturing. It does not own chip factories; its chips are manufactured by TSMC, and in August 2025 Apple stated that TSMC’s plant in Arizona was producing tens of millions of chips for Apple and that Apple was its first and largest customer. Apple’s annual report says that most of its manufacturing is carried out by outsourcing partners, mainly in Asia.
This split follows the logic of relevant costs. Designing chips needs a large, mainly fixed investment in engineers and research, which Apple could spread across iPhone, iPad and Mac, products it sells in very large numbers. Building a leading chip factory needs a very large fixed investment in plants and equipment and specialist skills that TSMC already has and spreads across many customers, so for Apple buying fabrication is far cheaper than making it. For each Mac, Apple stopped paying Intel’s price for a processor and instead paid TSMC to manufacture a chip it had designed, adding design costs that are fixed for Apple as a whole.
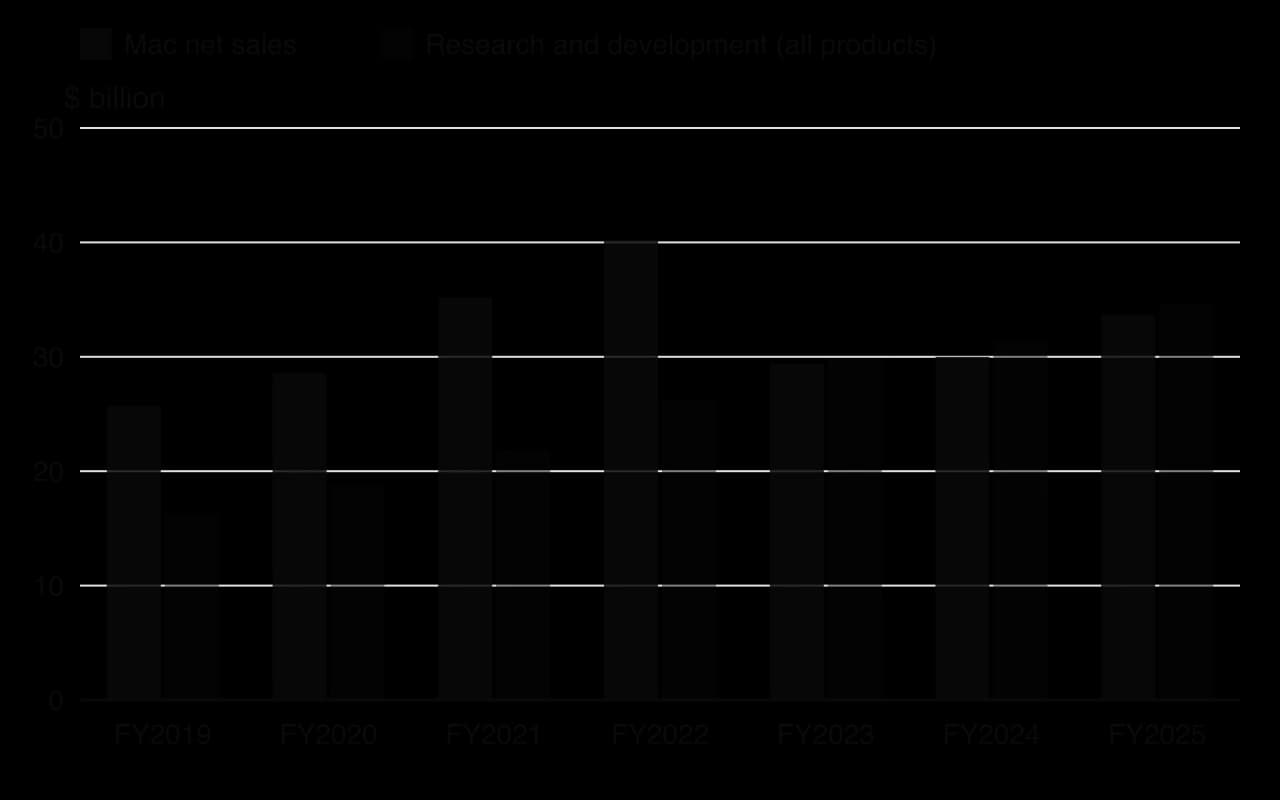
Apple’s financial reports do not show the cost of each chip, so the decision cannot be calculated precisely from outside. The chart shows that Apple’s total research and development spending rose from $16.2 billion in FY2019 to $34.6 billion in FY2025, although this covers every product, not only chips. Mac net sales rose from $25.7 billion in FY2019 to a peak of $40.2 billion in FY2022, fell to $29.4 billion in FY2023 and recovered to $33.7 billion in FY2025.
Qualitative factors were central to the decision. Apple stated that its own chips would give the Mac better performance per watt, so laptops could run faster with longer battery life, and a common architecture across all its products, which makes it easier for developers to write apps that run on iPhone, iPad and Mac. Designing its own chips also gave Apple control over its product timetable, which no longer depended on Intel’s.
Other risks lay outside the numbers: the cost and effort of moving software to a new architecture (Apple provided translation software, Rosetta 2, for older apps), and dependence on a single manufacturer in Taiwan. Apple’s annual report warns that it relies on single-source partners for many components, and the production of its chips at TSMC’s Arizona plant reduces part of that geographic risk.
The case shows both the strength and the limits of make or buy analysis. The financial logic explains why Apple designs but does not manufacture, but the decisive factors were control, differentiation and long-term capability, which are hard to put into numbers. It also shows that the choice is not always all or nothing: Apple made the part that gives it a competitive advantage and bought the part where a specialist had economies of scale.
Sources: Apple Newsroom: “Apple announces Mac transition to Apple silicon” (22 June 2020), “Apple unleashes M1” (10 November 2020), new Mac Studio and Mac Pro (5 June 2023), US manufacturing programme (6 August 2025); Apple Inc., Form 10-K annual reports FY2020, FY2022, FY2025.
Explain why Apple chose to design its own chips but to buy their manufacture from TSMC, using the terms fixed costs and relevant costs.
Analyse two qualitative factors that favoured Apple designing its own processors.
Using the data, explain why it is difficult to measure the financial effect of the decision.
Exam practice
Contribution, make or buy and costing methods are HL content and appear in Paper 2, usually as a calculation followed by a question that asks you to comment on or evaluate a decision. Paper 3 can also use them, for example when a social enterprise must decide whether to make a product itself or buy it in.
Most questions are built on a short case like the one that follows.
GreenLoop Bags is a social enterprise in Lisbon that employs refugees to make tote bags from recycled fabric. It sells 6,000 bags a year at €18 each. The variable cost of a bag is €8, and fixed costs are €42,000 a year. GreenLoop also makes the cotton straps for its bags at a variable cost of €1.20 per strap pair; the strap workshop has fixed costs of €9,000 a year, of which €4,000 (a leased machine) would end if the workshop closed. A supplier has offered to supply strap pairs at €1.60 each (hypothetical data).
A make-or-buy calculation follows.
A question about a special order tests the conditions for accepting it.
The extended response weighs the calculation against the enterprise’s aims.
Summary
Only relevant costs matter in short-term decisions: variable costs, avoidable fixed costs and opportunity costs; unavoidable fixed costs and sunk costs are ignored.
Make or buy analysis compares the cost to buy with the relevant cost of making, then weighs quality, reliability, control, capacity, jobs and ethics.
Contribution costing judges products and orders by their contribution, without allocating fixed costs.
A product with a positive contribution should normally be kept unless dropping it saves more fixed costs than its contribution.
A special order is worth accepting financially if its price exceeds its variable costs and there is spare capacity; otherwise it must also cover lost contribution on normal sales.
Absorption costing allocates overheads to cost centres by floor space, labour hours or machine hours to find a full cost per unit, but the result depends on the bases chosen.
Contribution costing suits short-term decisions; absorption costing suits normal pricing and long-term reviews.
Self-check
- To do:
I can explain the difference between relevant and irrelevant costs, including avoidable and unavoidable fixed costs.
- To do:
I can calculate a make-or-buy decision using variable costs and avoidable fixed costs.
- To do:
I can find the quantity at which making and buying cost the same.
- To do:
I can use contribution to decide whether to drop a product.
- To do:
I can decide whether to accept a special order, with and without spare capacity.
- To do:
I can allocate overheads by floor space, labour hours and machine hours and calculate a full cost per unit.
- To do:
I can distinguish between contribution costing and absorption costing and say when each is used.
- To do:
I can analyse the qualitative factors in a make-or-buy decision, using a real example.