4.6 Combined events questions for IB Maths AI
70 questions on Combined events, written by Augment in the style of IB exam papers. Six of them are below in full, to answer on paper.
- IB Mathematics: Applications and Interpretation
- Part of 4 Statistics and probability
- SL and HL
Questions by paper and level
SL and HL questions are for students at either level. HL only questions cover what only HL students study.
| Paper | SL and HL | HL only | All |
|---|---|---|---|
| Paper 1 | 25 | 2 | 27 |
| Paper 2 | 37 | 4 | 41 |
| Paper 3HL only | 0 | 2 | 2 |
| Every paper | 62 | 8 | 70 |
Counted on
Questions to try
Written by Augment in the style of IB exams, not past papers. Answer them on paper, then check each one against its markscheme with a free account.
A transport survey asked 240 commuters in Lisbon how they usually travel to work. The results, by age group, are shown in the following table.
Metro | Bus | Car | Total | |
|---|---|---|---|---|
Under 30 | 46 | 38 | 20 | 104 |
30 and over | 52 | 24 | 60 | 136 |
Total | 98 | 62 | 80 | 240 |
One commuter from the survey is chosen at random.
- (a)
Write down the probability that the commuter travels by car.
1 mark
- (b)
Find the probability that the commuter does not travel by metro.
2 marks
- (c)
Find the probability that the commuter is under 30 and travels by bus.
2 marks
- (d)
Given that the commuter travels by metro, find the probability that they are 30 or over.
2 marks
Haruto asks the 50 workers in an office how many cups of coffee they drink on a typical working day. His results are shown in the following bar chart, from which the bars for 2 cups and 3 cups are missing.
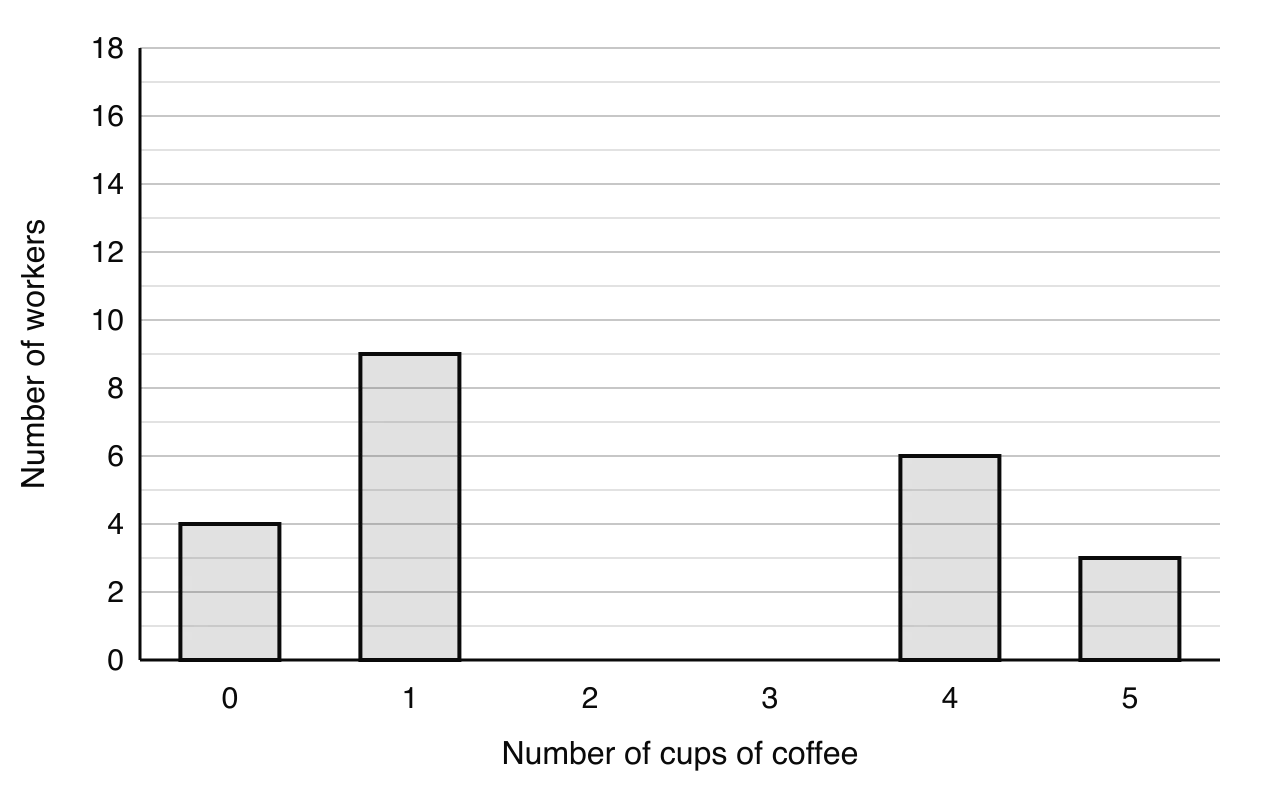
Let be the number of workers who drink 2 cups and the number who drink 3 cups.
- (a)
Show that .
1 mark
- (b)
The mean number of cups drunk is 2.4. Show that .
2 marks
- (c)
Find the value of and the value of .
2 marks
- (d)
Find
(i) the median number of cups;
(ii) the interquartile range.
3 marks
- (e)
Draw a box-and-whisker diagram to represent the data.
2 marks
- (f)
Find the standard deviation of the number of cups.
1 mark
- (g)
Two different workers are chosen at random. Find the probability that
(i) both drink no coffee;
(ii) exactly one of them drinks more than 3 cups.
3 marks
This question uses Markov chains to investigate how customers switch between mobile phone networks.
Three mobile phone networks, Aero (A), Brio (B) and Cellux (C), operate in the country of Velmora. A market researcher, Daniela, collects the following information about customers at the end of each month.
Of Aero's customers, 85 % stay with Aero, 10 % move to Brio and 5 % move to Cellux.
Of Brio's customers, 80 % stay with Brio, 5 % move to Aero and 15 % move to Cellux.
Of Cellux's customers, 90 % stay with Cellux, 4 % move to Aero and 6 % move to Brio.
Daniela assumes that these percentages stay the same every month, and that every customer is always with exactly one of the three networks.
- (a)
Write down the transition matrix such that , where gives the proportions of customers with Aero, Brio and Cellux after months.
2 marks
- (b)
Ji-ho is currently an Aero customer.
Find the probability that he is with Brio at the end of each of the next two months and with Cellux at the end of the third month.
2 marks
- (c)
At the start of January, 50 % of customers are with Aero, 30 % with Brio and 20 % with Cellux.
Find the percentage of customers with each network six months later.
3 marks
- (d)(i)
Find the exact long-term proportion of customers with each network.
4 marks
- (d)(ii)
Interpret your answer to part (d)(i) in context.
1 mark
- (e)(i)
Brio launches a loyalty scheme. Brio now keeps a proportion of its customers each month. Of the customers who leave Brio, one quarter move to Aero and three quarters move to Cellux. The other columns of do not change.
Write down the new second column of in terms of .
1 mark
- (e)(ii)
Brio wants to have the largest long-term share of the three networks.
Find the minimum value of needed, giving your answer as a percentage correct to the nearest whole number.
4 marks
- (f)(i)
Several years later Aero closes, and its customers join the other two networks. Daniela now models monthly switching between Brio and Cellux with the transition matrix
where the first row and column refer to Brio.
Find the eigenvalues of .
2 marks
- (f)(ii)
Find an eigenvector for each eigenvalue.
2 marks
- (f)(iii)
Hence write down matrices and such that , where is a diagonal matrix.
1 mark
- (f)(iv)
Immediately after Aero closes, 45 % of customers are with Brio.
Show that the proportion of customers with Brio after months is .
4 marks
- (f)(v)
Find the number of months after Aero closes until Brio's share first falls below 40 %.
2 marks
- (g)
State one reason why Daniela's Markov chain model may not be realistic.
1 mark
Ravi wants to find the probability of obtaining at least one 6 when four fair six-sided dice are rolled together. He writes a computer program that simulates rolling the four dice 500 times. In 247 of the simulations there is at least one 6.
- (a)
Write down the relative frequency of obtaining at least one 6 in Ravi's simulation.
1 mark
- (b)
Find the probability that none of the four dice shows a 6.
2 marks
- (c)
Hence find the probability of obtaining at least one 6 when the four dice are rolled.
1 mark
- (d)
Comment on the difference between your answers to part (a) and part (c).
1 mark
Two factories, X and Y, make LED light bulbs. A sample of 200 bulbs from each factory is tested to find its lifetime, in hours. The results are shown on the following cumulative frequency curves.

- (a)
Write down the median lifetime of the bulbs from
(i) factory X;
(ii) factory Y.
2 marks
- (b)
Find the interquartile range of the lifetimes of the bulbs from
(i) factory X;
(ii) factory Y.
4 marks
- (c)
Compare the lifetimes of the bulbs from the two factories.
2 marks
- (d)
Find the percentage of the bulbs from factory Y that lasted more than 1200 hours.
2 marks
- (e)
Factory X offers a refund for any bulb that fails before hours. It wants to refund no more than 5% of its bulbs. Use the curve to estimate the greatest value of it should choose.
2 marks
- (f)
A café buys three bulbs from factory Y. Assume that the lifetimes of the bulbs are independent and that the sample is representative. Find the probability that all three bulbs last more than 1200 hours.
2 marks
This question investigates whether the opening of a new marina has increased the number of boats arriving at a canal lock.
Boats on the Ellesmere Canal must pass through Hartwell Lock. The lock keeper, Ingrid, records the number of boats arriving at the lock in 40 randomly chosen one-hour periods during the summer.
Number of boats in one hour | 0 | 1 | 2 | 3 | 4 | 5 | 6 | 7 |
|---|---|---|---|---|---|---|---|---|
Frequency | 2 | 4 | 9 | 9 | 7 | 5 | 3 | 1 |
- (a)
Ingrid wants to model the number of boats arriving in one hour by a Poisson distribution.
State two conditions that must hold for this model to be appropriate.
2 marks
- (b)(i)
Calculate the mean and the variance of the number of boats arriving in one hour, according to Ingrid's data.
2 marks
- (b)(ii)
Explain how your answers to part (b)(i) support the use of a Poisson model.
1 mark
- (c)(i)
Ingrid models the number of boats arriving in one hour by a Poisson distribution with mean 3.2.
Find the probability that exactly 5 boats arrive in a one-hour period.
2 marks
- (c)(ii)
Given that at least 3 boats arrive in a two-hour period, find the probability that fewer than 6 boats arrive in that period.
3 marks
- (d)(i)
The lock operates in 30-minute cycles and can take at most 4 boats in each cycle. Any extra boats must wait for the next cycle.
Find the probability that more than 4 boats arrive during one 30-minute cycle.
2 marks
- (d)(ii)
On one day the lock operates 20 cycles. The numbers of boats arriving in different cycles are independent.
Find the probability that more than 4 boats arrive in at least two of the cycles on that day.
3 marks
- (e)(i)
The following summer a new marina opens upstream. Ingrid believes that the mean number of boats arriving per hour has increased. She will count the number of boats, , arriving during one randomly chosen five-hour period and test her belief at the 5 % significance level.
State the null and alternative hypotheses for this test.
1 mark
- (e)(ii)
Find the critical region for this test.
3 marks
- (e)(iii)
During the five-hour period, 25 boats arrive at the lock.
State the conclusion of the test, in context. Give a reason for your answer.
2 marks
- (f)
Find the probability of a Type I error for this test.
2 marks
- (g)
In fact, after the marina opens, the mean number of boats arriving is 4.4 per hour.
Find the probability of a Type II error for this test.
3 marks
- (h)
Suggest how Ingrid could reduce the probability of a Type II error without increasing the significance level of the test.
1 mark
Practice all 70 in Augment
Free with an account. Every question has its markscheme, and Augment keeps the ones you got wrong so you can come back to them.
More questions in Statistics and probability
- 4.1Collecting data and sampling
- 4.2Presenting data
- 4.3Measures of central tendency and dispersion
- 4.4Correlation and regression
- 4.5Concepts of probability
- 4.6Combined eventsThis page
- 4.7Discrete random variables
- 4.8The binomial distribution
- 4.9The normal distribution
- 4.10Spearman’s rank correlation
- 4.11Hypothesis testing
- 4.12Data collection and reliabilityHL only
- 4.13Non-linear regressionHL only
- 4.14Linear transformations of random variablesHL only
- 4.15The central limit theoremHL only
- 4.16Confidence intervalsHL only
- 4.17The Poisson distributionHL only
- 4.18Further hypothesis testingHL only
- 4.19Transition matrices and Markov chainsHL only
Check your answers in Augment
A free account opens all 70 questions on Combined events with their markschemes, and keeps a record of what you have marked.