4.2 Presenting data questions for IB Maths AI
27 questions on Presenting data, written by Augment in the style of IB exam papers. Six of them are below in full, to answer on paper.
- IB Mathematics: Applications and Interpretation
- Part of 4 Statistics and probability
- SL and HL
Questions by paper and level
SL and HL questions are for students at either level. HL only questions cover what only HL students study.
| Paper | SL and HL | HL only | All |
|---|---|---|---|
| Paper 1 | 13 | 0 | 13 |
| Paper 2 | 14 | 0 | 14 |
| Every paper | 27 | 0 | 27 |
Counted on
Questions to try
Written by Augment in the style of IB exams, not past papers. Answer them on paper, then check each one against its markscheme with a free account.
As part of a road-safety study, 40 drivers each take a computer test that measures their reaction time, in seconds. The results are summarised in the following table.
Minimum | Lower quartile | Median | Upper quartile | Maximum |
|---|---|---|---|---|
0.09 | 0.24 | 0.27 | 0.31 | 0.44 |
- (a)
Write down the interquartile range.
1 mark
- (b)
Determine whether the minimum and the maximum are outliers.
4 marks
- (c)
The researchers know that no person can genuinely react to the test in less than 0.1 seconds. Comment on whether each of the two outliers should be kept in the data.
2 marks
Lindiwe's farm has three apple orchards. The numbers of apple trees in each orchard are shown in the following table.
Orchard | Hillside | Riverbank | Valley |
|---|---|---|---|
Number of trees | 1840 | 1150 | 1010 |
Lindiwe wants to check 80 trees for disease.
- (a)
She decides to use a stratified sample. Find the number of trees she should check in each orchard.
3 marks
- (b)
Explain why a stratified sample may be more suitable than a simple random sample of 80 trees.
1 mark
- (c)
Lindiwe also weighs apples. State whether the mass of an apple is discrete or continuous data.
1 mark
- (d)
The masses, in grams, of 12 apples picked from Riverbank are:
Find
(i) the mean mass;
(ii) the standard deviation of the masses.
3 marks
- (e)
(i) Find the lower quartile, the median and the upper quartile of the masses.
(ii) Show that the mass of 236 g is an outlier.
6 marks
- (f)
Draw a box-and-whisker diagram to represent the masses of the 12 apples, using a horizontal scale from 120 g to 240 g.
3 marks
- (g)
Lindiwe checks her notebook and confirms that the 236 g apple was weighed correctly. State, with a reason, whether she should remove it from the data.
1 mark
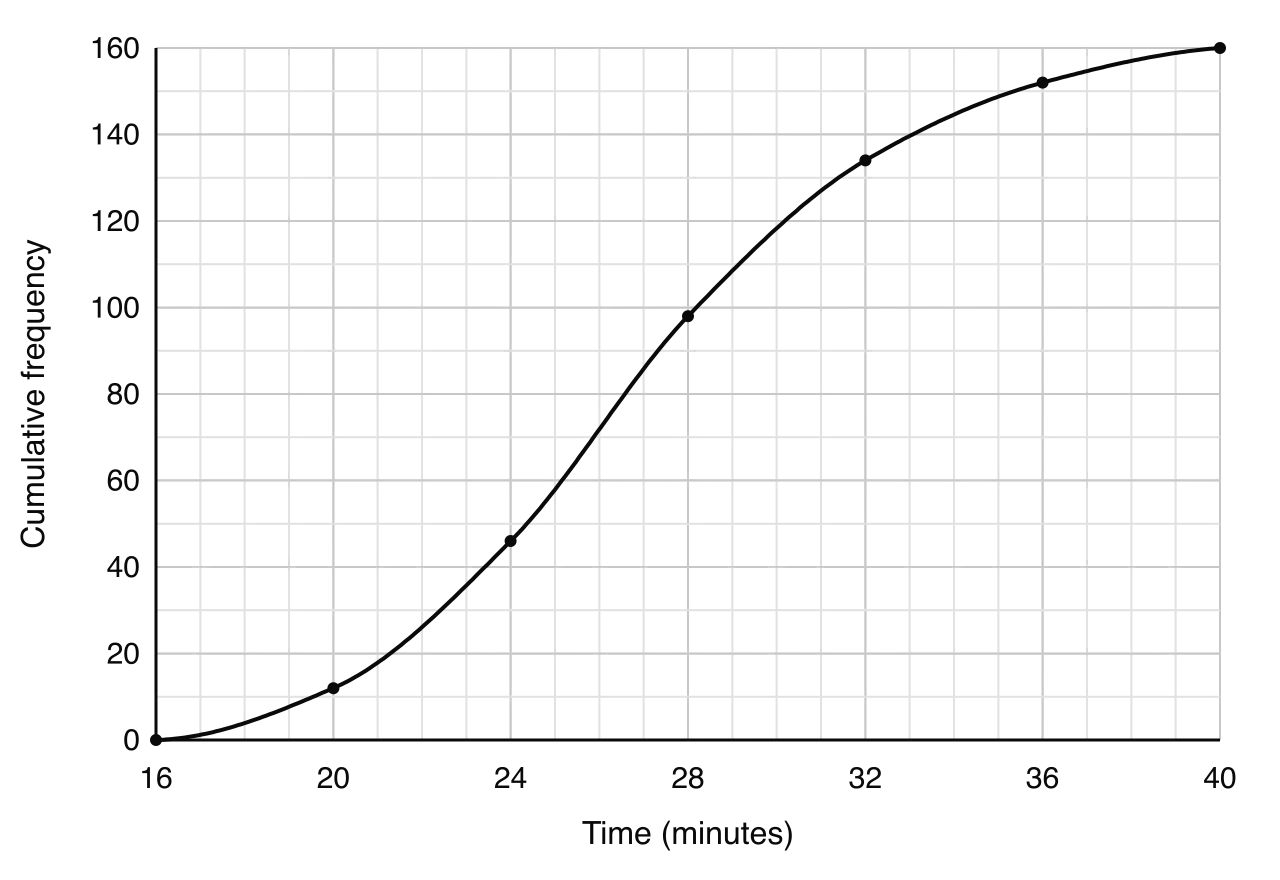
The times taken by 160 runners to complete a 5 km park run are shown on the following cumulative frequency curve.
- (a)
Use the cumulative frequency curve to estimate
(i) the median time;
(ii) the lower quartile;
(iii) the upper quartile;
(iv) the interquartile range.
4 marks
- (b)
Estimate the number of runners who took more than 30 minutes.
2 marks
- (c)
Write down the number of runners who took between 24 and 28 minutes.
1 mark
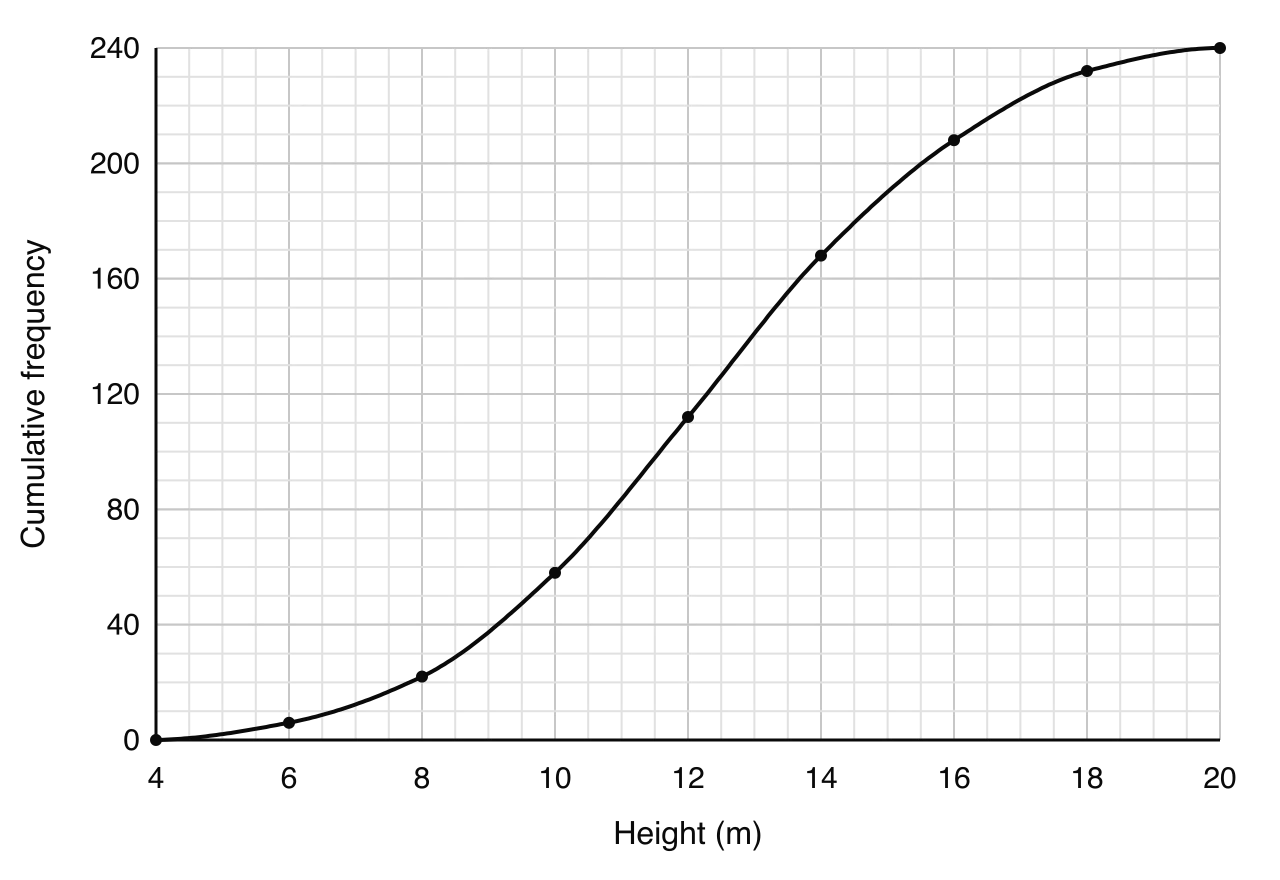
A forester measures the heights of 240 young pine trees in a plantation. The results are shown on the following cumulative frequency curve.
- (a)
Use the curve to estimate the median height.
1 mark
- (b)
Use the curve to estimate the interquartile range of the heights.
3 marks
- (c)
The shortest tree has a height of 5.2 m. Determine whether this height is an outlier.
3 marks
- (d)
Use the curve to complete the following frequency table.
Height ( m)
Frequency
6
16
56
24
8
2 marks
- (e)
Use your table to find an estimate of
(i) the mean height;
(ii) the standard deviation of the heights.
3 marks
- (f)
The forester models the height of a tree in the plantation, m, by . Use this model to estimate the number of the 240 trees that are taller than 16 m.
3 marks
- (g)
Use the cumulative frequency curve to comment on the accuracy of your answer to part (f).
1 mark
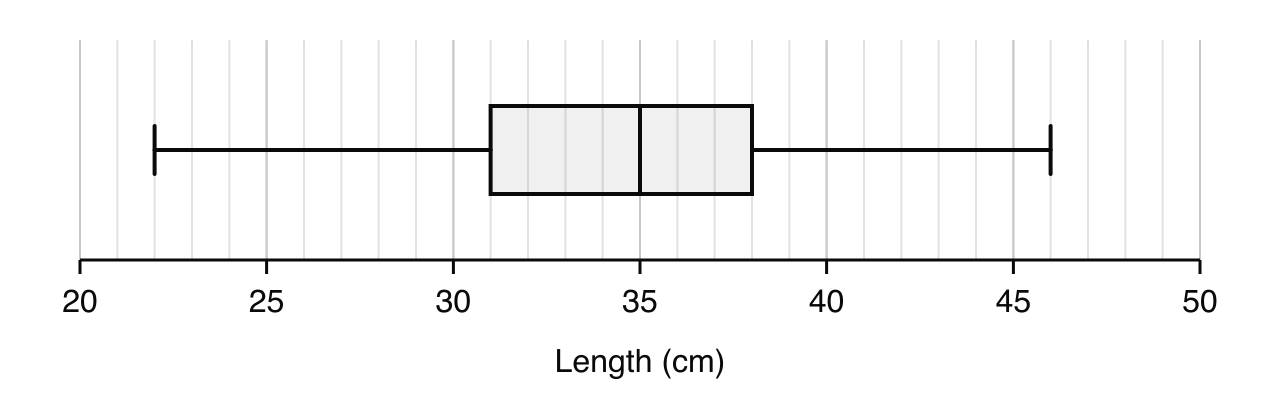
Rangi records the lengths, in cm, of the trout he catches in a lake during one season. The lengths are shown in the following box-and-whisker diagram.
- (a)
Write down the median length.
1 mark
- (b)
Find the interquartile range.
2 marks
- (c)
Find the greatest length that a trout could have without being an outlier.
2 marks
- (d)
Rangi's friend catches a trout of length 20 cm in the same lake. Assuming the quartiles do not change, determine whether this length would be an outlier.
2 marks
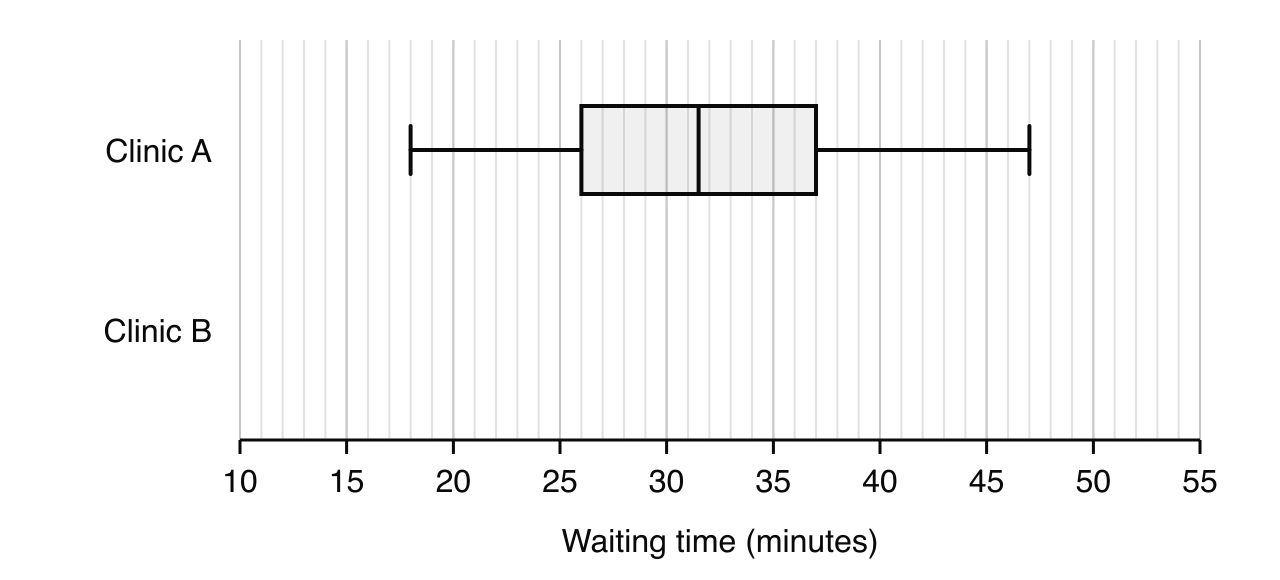
A health authority records the waiting times, in minutes, of 12 randomly chosen patients at each of two clinics, A and B.
Clinic A | 18 | 22 | 25 | 27 | 29 | 31 | 32 | 34 | 36 | 38 | 41 | 47 |
|---|---|---|---|---|---|---|---|---|---|---|---|---|
Clinic B | 12 | 15 | 17 | 19 | 20 | 22 | 23 | 24 | 26 | 28 | 31 | 52 |
The waiting times for clinic A are shown in the following box-and-whisker diagram.
- (a)
For the waiting times at clinic B, write down
(i) the median;
(ii) the lower quartile and the upper quartile.
3 marks
- (b)
Show that the waiting time of 52 minutes at clinic B is an outlier.
2 marks
- (c)
On the same scale as the diagram, draw a box-and-whisker diagram for the waiting times at clinic B.
3 marks
- (d)
Make two comparisons between the waiting times at the two clinics.
2 marks
- (e)
The health authority wants to test, at the 5% significance level, whether the mean waiting time at clinic B is less than at clinic A. It assumes that the waiting times at each clinic are normally distributed with equal variances.
Write down the null and alternative hypotheses.
2 marks
- (f)
Find the -value for the test.
2 marks
- (g)
State the conclusion of the test. Give a reason for your answer.
2 marks
- (h)
With reference to your diagram for clinic B, comment on the assumption that the waiting times at clinic B are normally distributed.
1 mark
Practice all 27 in Augment
Free with an account. Every question has its markscheme, and Augment keeps the ones you got wrong so you can come back to them.
More questions in Statistics and probability
- 4.1Collecting data and sampling
- 4.2Presenting dataThis page
- 4.3Measures of central tendency and dispersion
- 4.4Correlation and regression
- 4.5Concepts of probability
- 4.6Combined events
- 4.7Discrete random variables
- 4.8The binomial distribution
- 4.9The normal distribution
- 4.10Spearman’s rank correlation
- 4.11Hypothesis testing
- 4.12Data collection and reliabilityHL only
- 4.13Non-linear regressionHL only
- 4.14Linear transformations of random variablesHL only
- 4.15The central limit theoremHL only
- 4.16Confidence intervalsHL only
- 4.17The Poisson distributionHL only
- 4.18Further hypothesis testingHL only
- 4.19Transition matrices and Markov chainsHL only
Check your answers in Augment
A free account opens all 27 questions on Presenting data with their markschemes, and keeps a record of what you have marked.