4.3 Measures of central tendency and dispersion questions for IB Maths AI
56 questions on Measures of central tendency and dispersion, written by Augment in the style of IB exam papers. Six of them are below in full, to answer on paper.
- IB Mathematics: Applications and Interpretation
- Part of 4 Statistics and probability
- SL and HL
Questions by paper and level
SL and HL questions are for students at either level. HL only questions cover what only HL students study.
| Paper | SL and HL | HL only | All |
|---|---|---|---|
| Paper 1 | 22 | 1 | 23 |
| Paper 2 | 31 | 1 | 32 |
| Paper 3HL only | 0 | 1 | 1 |
| Every paper | 53 | 3 | 56 |
Counted on
Questions to try
Written by Augment in the style of IB exams, not past papers. Answer them on paper, then check each one against its markscheme with a free account.
A sports scientist measures the resting heart rate, in beats per minute (bpm), of 11 rowers in a university squad. The results are:
- (a)
Write down the value of
(i) the lower quartile;
(ii) the upper quartile.
2 marks
- (b)
Show that the value 82 bpm is an outlier.
3 marks
- (c)
The scientist later finds that the reading of 82 bpm was taken from a rower who had just finished a warm-up. State, with a reason, whether this value should be removed from the data.
1 mark
Lindiwe's farm has three apple orchards. The numbers of apple trees in each orchard are shown in the following table.
Orchard | Hillside | Riverbank | Valley |
|---|---|---|---|
Number of trees | 1840 | 1150 | 1010 |
Lindiwe wants to check 80 trees for disease.
- (a)
She decides to use a stratified sample. Find the number of trees she should check in each orchard.
3 marks
- (b)
Explain why a stratified sample may be more suitable than a simple random sample of 80 trees.
1 mark
- (c)
Lindiwe also weighs apples. State whether the mass of an apple is discrete or continuous data.
1 mark
- (d)
The masses, in grams, of 12 apples picked from Riverbank are:
Find
(i) the mean mass;
(ii) the standard deviation of the masses.
3 marks
- (e)
(i) Find the lower quartile, the median and the upper quartile of the masses.
(ii) Show that the mass of 236 g is an outlier.
6 marks
- (f)
Draw a box-and-whisker diagram to represent the masses of the 12 apples, using a horizontal scale from 120 g to 240 g.
3 marks
- (g)
Lindiwe checks her notebook and confirms that the 236 g apple was weighed correctly. State, with a reason, whether she should remove it from the data.
1 mark
This question investigates whether the opening of a new marina has increased the number of boats arriving at a canal lock.
Boats on the Ellesmere Canal must pass through Hartwell Lock. The lock keeper, Ingrid, records the number of boats arriving at the lock in 40 randomly chosen one-hour periods during the summer.
Number of boats in one hour | 0 | 1 | 2 | 3 | 4 | 5 | 6 | 7 |
|---|---|---|---|---|---|---|---|---|
Frequency | 2 | 4 | 9 | 9 | 7 | 5 | 3 | 1 |
- (a)
Ingrid wants to model the number of boats arriving in one hour by a Poisson distribution.
State two conditions that must hold for this model to be appropriate.
2 marks
- (b)(i)
Calculate the mean and the variance of the number of boats arriving in one hour, according to Ingrid's data.
2 marks
- (b)(ii)
Explain how your answers to part (b)(i) support the use of a Poisson model.
1 mark
- (c)(i)
Ingrid models the number of boats arriving in one hour by a Poisson distribution with mean 3.2.
Find the probability that exactly 5 boats arrive in a one-hour period.
2 marks
- (c)(ii)
Given that at least 3 boats arrive in a two-hour period, find the probability that fewer than 6 boats arrive in that period.
3 marks
- (d)(i)
The lock operates in 30-minute cycles and can take at most 4 boats in each cycle. Any extra boats must wait for the next cycle.
Find the probability that more than 4 boats arrive during one 30-minute cycle.
2 marks
- (d)(ii)
On one day the lock operates 20 cycles. The numbers of boats arriving in different cycles are independent.
Find the probability that more than 4 boats arrive in at least two of the cycles on that day.
3 marks
- (e)(i)
The following summer a new marina opens upstream. Ingrid believes that the mean number of boats arriving per hour has increased. She will count the number of boats, , arriving during one randomly chosen five-hour period and test her belief at the 5 % significance level.
State the null and alternative hypotheses for this test.
1 mark
- (e)(ii)
Find the critical region for this test.
3 marks
- (e)(iii)
During the five-hour period, 25 boats arrive at the lock.
State the conclusion of the test, in context. Give a reason for your answer.
2 marks
- (f)
Find the probability of a Type I error for this test.
2 marks
- (g)
In fact, after the marina opens, the mean number of boats arriving is 4.4 per hour.
Find the probability of a Type II error for this test.
3 marks
- (h)
Suggest how Ingrid could reduce the probability of a Type II error without increasing the significance level of the test.
1 mark
In a biology class, ten students each measure the height of one bean seedling, in cm, after three weeks of growth. Their results are recorded in a shared table.
Student | 1 | 2 | 3 | 4 | 5 | 6 | 7 | 8 | 9 | 10 |
|---|---|---|---|---|---|---|---|---|---|---|
Height (cm) | 12.4 | 11.8 | 13.1 | 12.9 | 118 | 12.2 | 13.5 | 11.9 | 12.6 |
Student 4 was absent and did not record a height.
- (a)
Identify the value that has been recorded in error. Suggest what is likely to have happened.
2 marks
- (b)
The teacher removes the value in error. Find the mean height of the remaining eight seedlings.
2 marks
- (c)
Another student suggests entering 0 for student 4. Explain why this is not appropriate.
1 mark
- (d)
The teacher checks with student 6, who confirms that the height was 11.8 cm. Find the median height of the nine recorded seedlings.
2 marks
The council of the town of Dunmore wants to find out how long residents take to travel to work. A council officer stands at the central bus station one morning and asks 50 people waiting there how long their journey to work takes.
- (a)
Name the sampling technique used by the officer.
1 mark
- (b)
Explain why this sample is likely to be biased.
1 mark
- (c)
The council has a list of all 18 400 adult residents. Describe how a simple random sample of 120 residents could be chosen from this list.
2 marks
- (d)
The council takes a simple random sample of 120 residents. The time, minutes, that each takes to travel to work is shown in the following table.
Time ( minutes)
Number of residents
14
31
38
22
11
4
Write down the modal class.
1 mark
- (e)
Use the mid-interval values to find an estimate of
(i) the mean time;
(ii) the standard deviation of the times.
4 marks
- (f)
Explain why your answer to part (e)(i) is only an estimate.
1 mark
- (g)
Find the class that contains the median time.
2 marks
- (h)
The council's target is that no more than 15% of residents travel for more than 40 minutes. Determine whether the sample suggests that the target is being met.
2 marks
The times taken by 160 runners to complete a 5 km park run are shown on the following cumulative frequency curve.
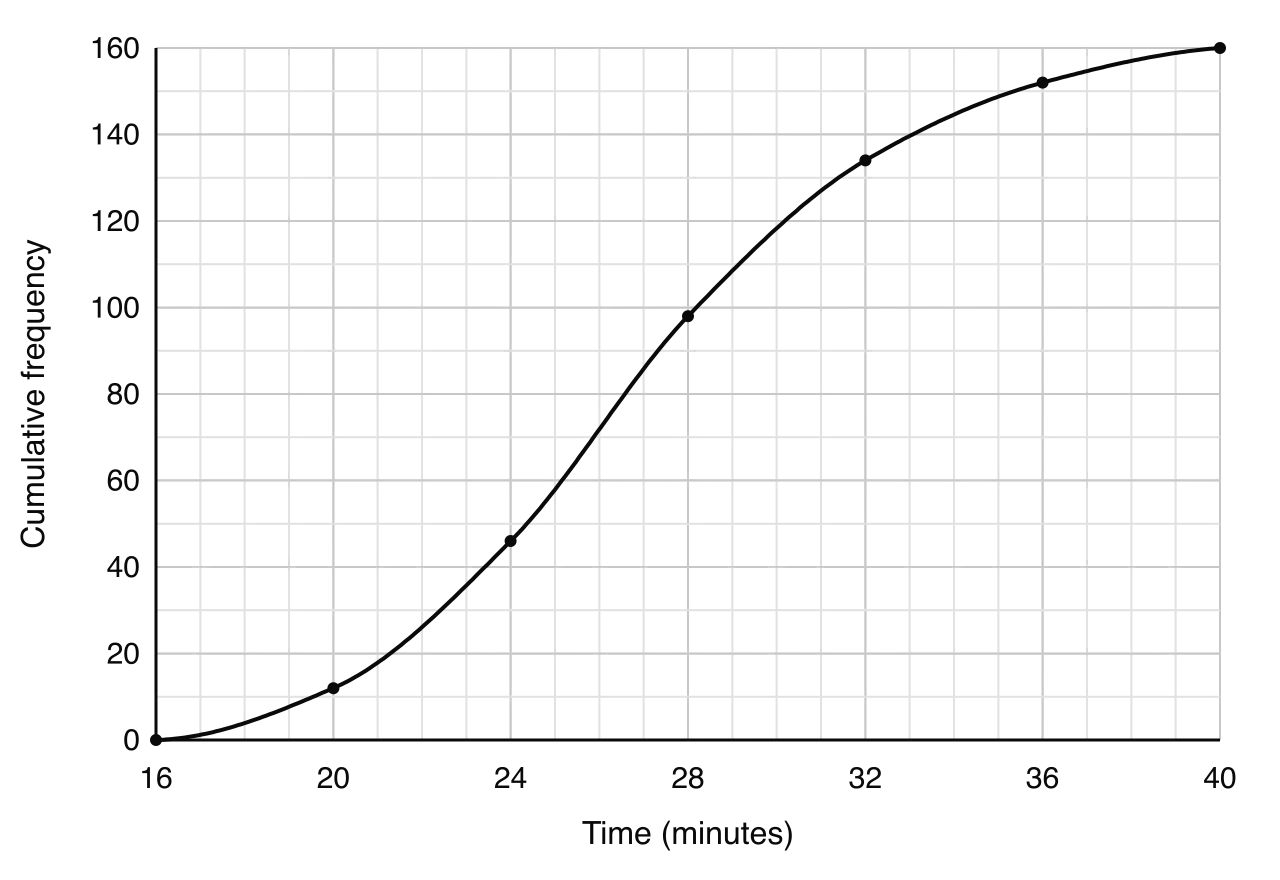
- (a)
Use the cumulative frequency curve to estimate
(i) the median time;
(ii) the lower quartile;
(iii) the upper quartile;
(iv) the interquartile range.
4 marks
- (b)
Estimate the number of runners who took more than 30 minutes.
2 marks
- (c)
Write down the number of runners who took between 24 and 28 minutes.
1 mark
Practice all 56 in Augment
Free with an account. Every question has its markscheme, and Augment keeps the ones you got wrong so you can come back to them.
The notes on 4.3 Measures of central tendency and dispersion
More questions in Statistics and probability
- 4.1Collecting data and sampling
- 4.2Presenting data
- 4.3Measures of central tendency and dispersionThis page
- 4.4Correlation and regression
- 4.5Concepts of probability
- 4.6Combined events
- 4.7Discrete random variables
- 4.8The binomial distribution
- 4.9The normal distribution
- 4.10Spearman’s rank correlation
- 4.11Hypothesis testing
- 4.12Data collection and reliabilityHL only
- 4.13Non-linear regressionHL only
- 4.14Linear transformations of random variablesHL only
- 4.15The central limit theoremHL only
- 4.16Confidence intervalsHL only
- 4.17The Poisson distributionHL only
- 4.18Further hypothesis testingHL only
- 4.19Transition matrices and Markov chainsHL only
Check your answers in Augment
A free account opens all 56 questions on Measures of central tendency and dispersion with their markschemes, and keeps a record of what you have marked.