4.11 Hypothesis testing questions for IB Maths AI
57 questions on Hypothesis testing, written by Augment in the style of IB exam papers. Six of them are below in full, to answer on paper.
- IB Mathematics: Applications and Interpretation
- Part of 4 Statistics and probability
- SL and HL
Questions by paper and level
SL and HL questions are for students at either level. HL only questions cover what only HL students study.
| Paper | SL and HL | HL only | All |
|---|---|---|---|
| Paper 1 | 17 | 3 | 20 |
| Paper 2 | 25 | 12 | 37 |
| Every paper | 42 | 15 | 57 |
Counted on
Questions to try
Written by Augment in the style of IB exams, not past papers. Answer them on paper, then check each one against its markscheme with a free account.
Kofi measures the resting heart rate, in beats per minute (bpm), of a random sample of 14 members of an athletics club. The heart rates are normally distributed. The sample mean is 72.5 bpm and bpm.
He calculates the interval and says it is a 95% confidence interval for the mean resting heart rate of the club members.
- (a)
Explain the error Kofi has made.
2 marks
- (b)
Find the correct 95% confidence interval. Give the endpoints correct to four significant figures.
2 marks
- (c)
A health website states that the mean resting heart rate of adults of this age is 69.3 bpm. Kofi concludes from his interval that the mean resting heart rate of the club members is different from 69.3 bpm.
Comment on Kofi's conclusion.
3 marks
The town of Ashbury plans to build a cycle lane along its main road. Kiran, a researcher, wants to find out whether residents' opinions about the plan depend on their age. Kiran stands in the town square and interviews people until he has 50 adults in each of three age groups.
- (a)
(i) Name the sampling technique used by Kiran.
(ii) State one disadvantage of this technique.
2 marks
- (b)
The numbers of adults in Ashbury in each age group are 9200 (18–34 years), 13 600 (35–59 years) and 7200 (60 years and over). Find the number of adults that should be chosen from each age group for a stratified sample of 150 adults.
3 marks
- (c)
The results of Kiran's survey are shown in the following table.
Age group
Support
Oppose
Undecided
18–34 years
28
14
8
35–59 years
19
21
10
60 years and over
9
30
11
Kiran carries out a test for independence at the 5% significance level.
Write down the null hypothesis.
1 mark
- (d)
Write down the number of degrees of freedom.
1 mark
- (e)
Show that the expected frequency of adults aged 60 years and over who support the plan is , correct to three significant figures.
2 marks
- (f)
Find the -value for the test.
2 marks
- (g)
State the conclusion of the test. Give a reason for your answer.
2 marks
- (h)
Kiran's report states that "most of the residents of Ashbury oppose the cycle lane". Comment on whether his data support this claim.
1 mark
A streaming service asked 300 randomly chosen subscribers which type of programme they prefer. The results, classified by age group, are shown in the following table.
Age group | Drama | Comedy | Documentary | Total |
|---|---|---|---|---|
16–29 | 32 | 30 | 18 | 80 |
30–49 | 33 | 38 | 29 | 100 |
50 and over | 30 | 40 | 50 | 120 |
Total | 95 | 108 | 97 | 300 |
A test for independence is carried out at the 5 % significance level. The critical value for this test is 9.488.
- (a)
Write down the null and alternative hypotheses.
1 mark
- (b)
Write down the number of degrees of freedom.
1 mark
- (c)
Find the statistic.
2 marks
- (d)
State the conclusion of the test. Give a reason for your answer.
2 marks
Harbourside Athletics Club has 300 members: 84 juniors, 156 seniors and 60 veterans.
- (a)
The club secretary takes a stratified sample of 25 members to ask about training times. Find the number of seniors in the sample.
2 marks
- (b)
The coach, Femi, trains two groups of sprinters with different programmes. Each sprinter chose which group to join. After eight weeks, their 100 m times, in seconds, are recorded.
Group A
12.8
13.1
12.6
13.4
12.9
13.2
12.7
13.0
Group B
12.5
12.9
12.4
12.7
13.0
12.3
12.6
12.8
12.6
Find the mean and the standard deviation of the times for
(i) group A;
(ii) group B.
4 marks
- (c)
Femi wants to test, at the 5% significance level, whether the mean 100 m time of sprinters following programme B is less than that of sprinters following programme A. He assumes that the times are normally distributed with equal population variances.
Write down the null and alternative hypotheses.
2 marks
- (d)
Find the -value for the test.
2 marks
- (e)
State the conclusion of the test. Give a reason for your answer.
2 marks
- (f)
Femi claims that the test proves programme B is the better programme. Comment on this claim, with reference to how the sprinters were placed in the groups.
2 marks
A transport researcher, Jomo, surveyed 260 commuters about how they usually travel to work. The results are shown in the table.
Car | Bus | Bicycle | Total | |
|---|---|---|---|---|
Urban | 64 | 45 | 41 | 150 |
Rural | 58 | 34 | 18 | 110 |
Total | 122 | 79 | 59 | 260 |
Jomo carries out a test for independence at the 5 % significance level to determine whether the method of travel is independent of where the commuter lives.
- (a)
Show that the expected number of urban commuters who travel by car is 70.4, correct to three significant figures.
2 marks
- (b)
Write down the number of degrees of freedom.
1 mark
- (c)
Find the -value for this test.
2 marks
- (d)
State the conclusion of the test. Give a reason for your answer.
2 marks
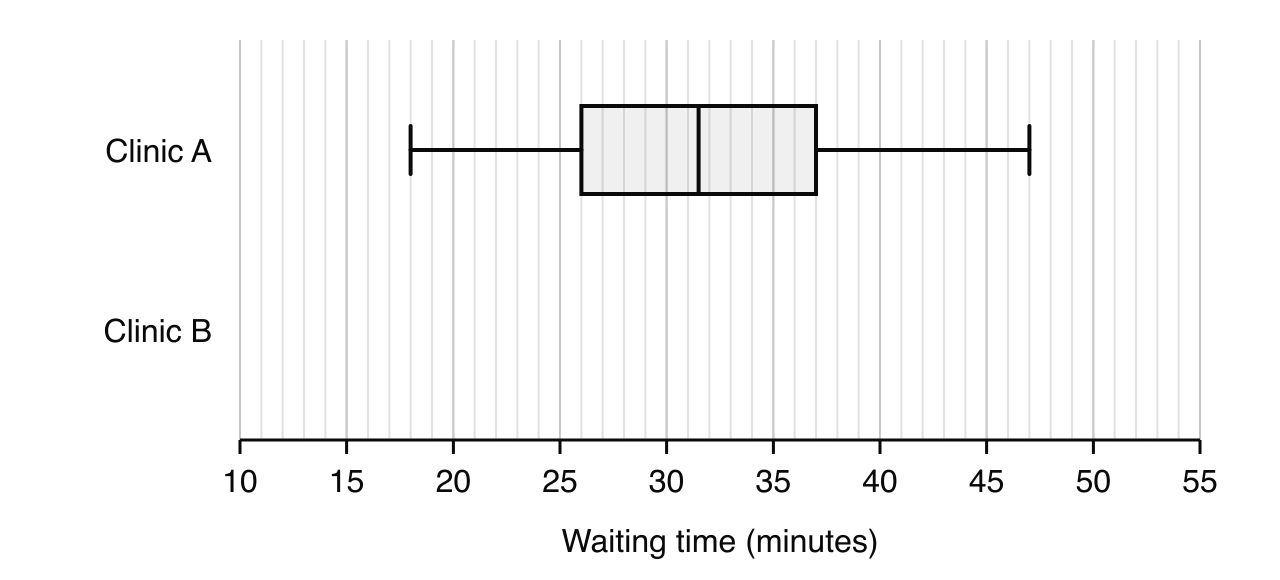
A health authority records the waiting times, in minutes, of 12 randomly chosen patients at each of two clinics, A and B.
Clinic A | 18 | 22 | 25 | 27 | 29 | 31 | 32 | 34 | 36 | 38 | 41 | 47 |
|---|---|---|---|---|---|---|---|---|---|---|---|---|
Clinic B | 12 | 15 | 17 | 19 | 20 | 22 | 23 | 24 | 26 | 28 | 31 | 52 |
The waiting times for clinic A are shown in the following box-and-whisker diagram.
- (a)
For the waiting times at clinic B, write down
(i) the median;
(ii) the lower quartile and the upper quartile.
3 marks
- (b)
Show that the waiting time of 52 minutes at clinic B is an outlier.
2 marks
- (c)
On the same scale as the diagram, draw a box-and-whisker diagram for the waiting times at clinic B.
3 marks
- (d)
Make two comparisons between the waiting times at the two clinics.
2 marks
- (e)
The health authority wants to test, at the 5% significance level, whether the mean waiting time at clinic B is less than at clinic A. It assumes that the waiting times at each clinic are normally distributed with equal variances.
Write down the null and alternative hypotheses.
2 marks
- (f)
Find the -value for the test.
2 marks
- (g)
State the conclusion of the test. Give a reason for your answer.
2 marks
- (h)
With reference to your diagram for clinic B, comment on the assumption that the waiting times at clinic B are normally distributed.
1 mark
Practice all 57 in Augment
Free with an account. Every question has its markscheme, and Augment keeps the ones you got wrong so you can come back to them.
More questions in Statistics and probability
- 4.1Collecting data and sampling
- 4.2Presenting data
- 4.3Measures of central tendency and dispersion
- 4.4Correlation and regression
- 4.5Concepts of probability
- 4.6Combined events
- 4.7Discrete random variables
- 4.8The binomial distribution
- 4.9The normal distribution
- 4.10Spearman’s rank correlation
- 4.11Hypothesis testingThis page
- 4.12Data collection and reliabilityHL only
- 4.13Non-linear regressionHL only
- 4.14Linear transformations of random variablesHL only
- 4.15The central limit theoremHL only
- 4.16Confidence intervalsHL only
- 4.17The Poisson distributionHL only
- 4.18Further hypothesis testingHL only
- 4.19Transition matrices and Markov chainsHL only
Check your answers in Augment
A free account opens all 57 questions on Hypothesis testing with their markschemes, and keeps a record of what you have marked.