Paper 3: data analysis and interpretation
Answer the four HL Paper 3 questions on a resource booklet: explain an issue limiting a source, analyse findings and conclude, judge qualitative research and weigh several sources against a claim.
- IB Psychology
- Exam skills
- HL only
Paper 3 gives you a resource booklet of several sources about one claim and asks four questions about them. The claim concerns the role of culture, motivation or technology in shaping behaviour within one of the four contexts, for example the effect of technology on students’ mental health or the role of culture in group behaviour. The sources include quantitative and qualitative research, which may be experimental or non-experimental, and the data may be real or created for the examination.
Nothing in the booklet has been seen before, so the paper tests how well knowledge and skills are applied to new material: reading graphs and tables, analysing results, judging qualitative research and weighing evidence for and against a claim. Those skills can be practised on any set of sources, and the four question types are the same in every session.
The four questions
Question | What it asks | Skill | What the top mark needs |
|---|---|---|---|
Q1 [3] | Explain one issue that limits the interpretation of the information in a given source | Interpretation of graphs | The issue is explained, not only identified or described |
Q2 [6] | Analyse the findings from a given source and state a conclusion | Data analysis | Detailed analysis of the data and a conclusion explicitly linked to the findings |
Q3 [6] | One of three fixed questions about a qualitative source: improving credibility, avoiding bias, or how far findings are transferable | Research considerations | Detailed understanding of the consideration, with explicit reference to the source |
Q4 [15] | To what extent the claim is valid, using at least three sources and your own knowledge | At least three sources interpreted effectively, different points of view evaluated, and a reasoned conclusion |
The first three questions each focus on one source; the last brings them together. Marks rise steeply through the paper, so time should follow the marks: Q4 alone is worth half the paper.
 YouTube
Reading the resource booklet
The booklet opens with the claim, usually in a sentence such as “The sources in this examination have been collated to assess the claim that …”. Every source was chosen because it bears on that claim, and every answer is judged partly by how well it connects the source to it. The claim should therefore be underlined and read first, and its key terms noted: what is the behaviour, what is supposed to shape it, and in whom.
Each source then needs a quick classification before any question is attempted. The same few features decide what a source can and cannot show.
Feature | What to note | Why it matters |
|---|---|---|
Type of data | Quantitative (numbers, graphs, statistics) or qualitative (themes, quotations) | Q1 and Q2 usually use quantitative sources, Q3 a qualitative one |
Design | Experiment (random allocation?), quasi-experiment, correlational study, survey, interview, observation | Only a true experiment supports a causal conclusion |
Sample | Who, how many, from where, how recruited | Generalisability and transferability; small or unusual samples limit conclusions |
Measures | How the variables in the claim were operationalised; self-report or behaviour | Whether the source actually measures what the claim is about |
Key results | The two or three numbers or themes that matter most | The raw material for analysis and synthesis |
Direction | Does the source support the claim, challenge it, or both? | Q4 needs different points of view |
A practice resource booklet
The four sources are invented for practice and all data are hypothetical. They are used in every worked example that follows.
The sources in this booklet have been collated to assess the claim that culture shapes young people’s willingness to seek professional help for psychological distress.
Source 1
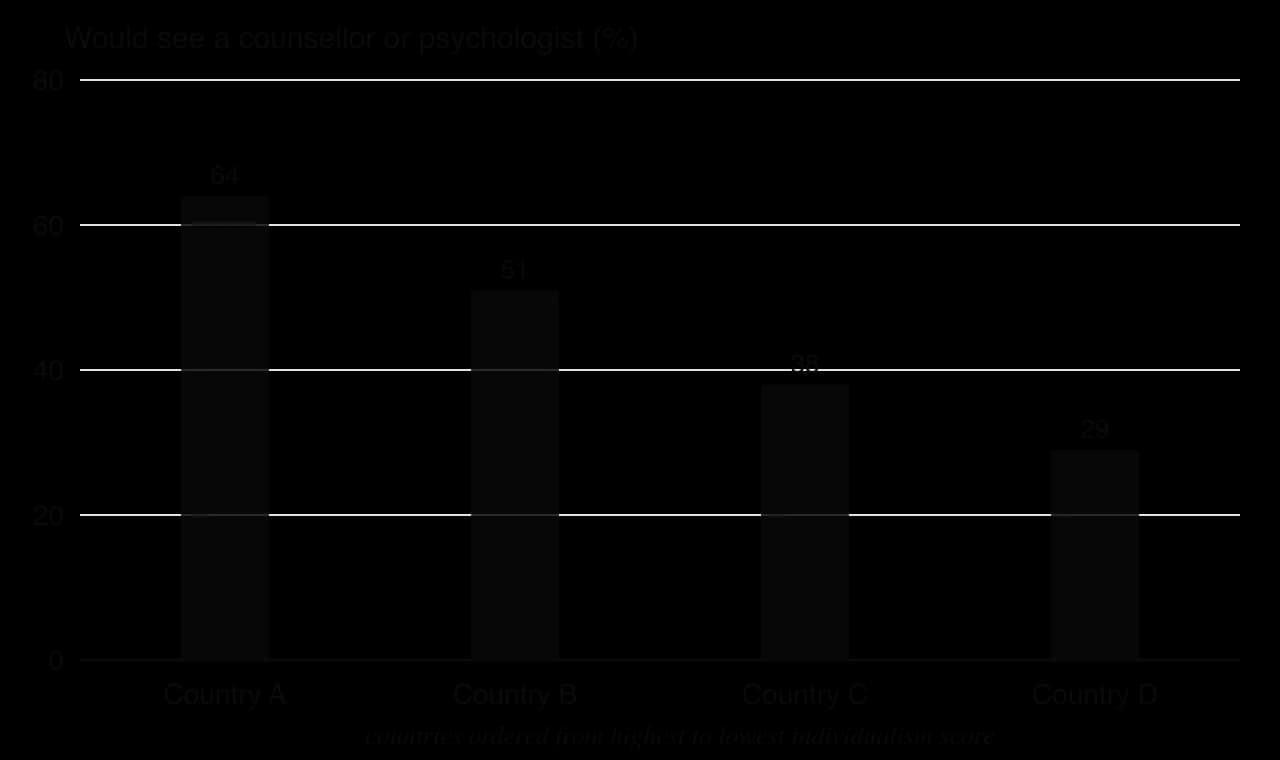
An international online survey asked university students aged 18–24 in four countries whether they would see a counsellor or psychologist “if you felt very low for two weeks or more”. The graph shows the percentage in each country who answered “probably” or “definitely”. The countries are ordered by their national individualism score.
Source 2
All students at one university in Country A were invited by email to complete an anonymous questionnaire; 420 did so. They were grouped by where they had grown up. Help-seeking attitudes were measured on a 10-item scale (0–30; higher scores mean more positive attitudes to professional help) and self-stigma on a 10-item scale (10–50; higher scores mean stronger feelings that seeking help would make a person feel weak or ashamed). Students also reported whether they had used the university counselling service in the past year and whether they knew it existed.
Grew up in Country A (n = 240) | International students from East Asia (n = 110) | International students from South Asia (n = 70) | |
|---|---|---|---|
Help-seeking attitudes, mean (SD) | 19.8 (5.1) | 15.2 (6.0) | 16.9 (5.7) |
Self-stigma, mean (SD) | 24.1 (6.2) | 29.5 (7.0) | 27.3 (6.8) |
Used counselling service in past year | 18% | 7% | 10% |
Knew the counselling service existed | 91% | 58% | 66% |
Across all 420 students, self-stigma correlated with help-seeking attitudes, r = −0.41 (p < 0.001). Group differences in help-seeking attitudes were statistically significant (p < 0.01).
Source 3
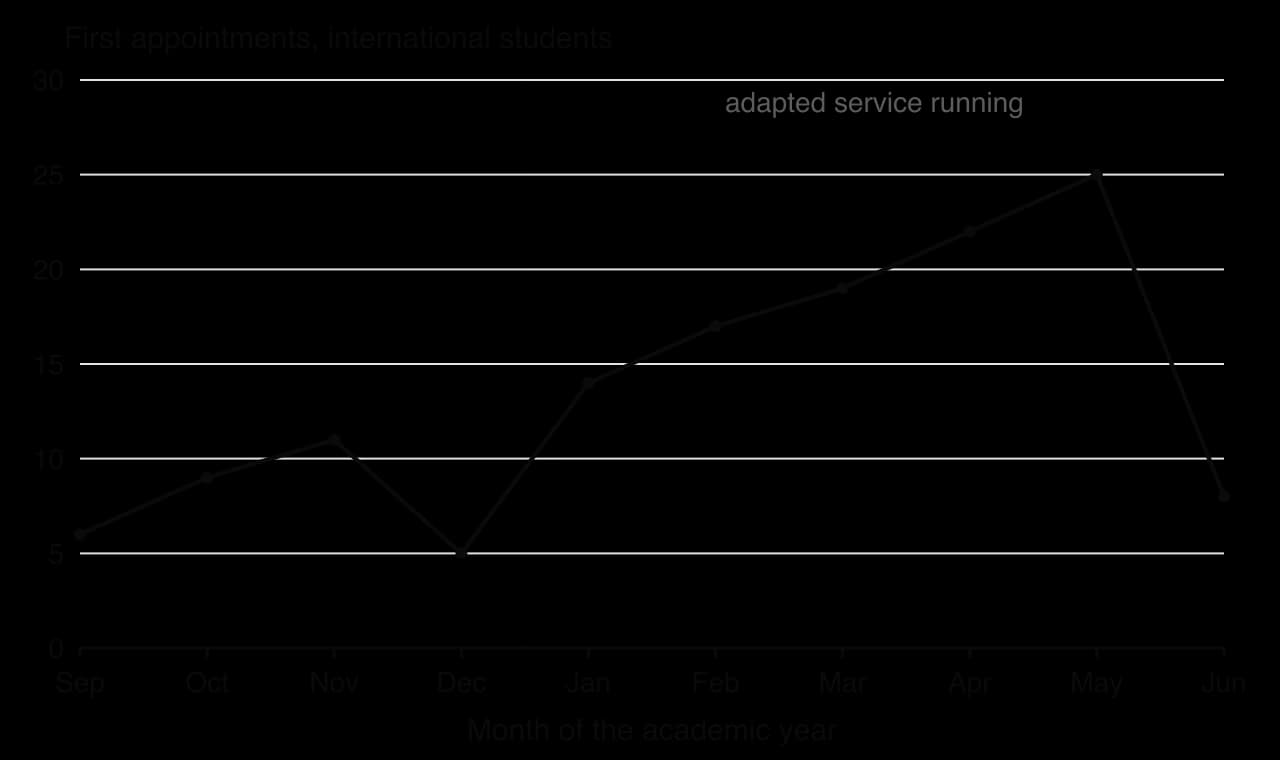
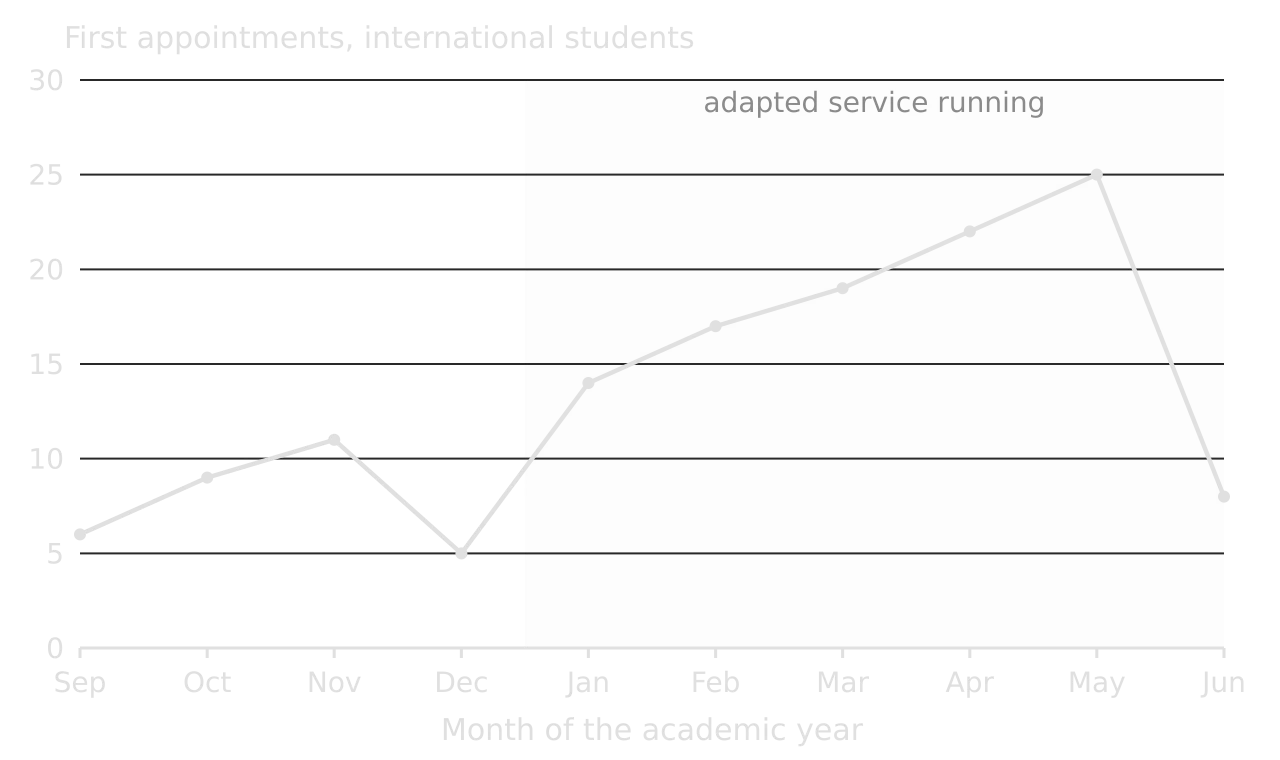
A university counselling service introduced a culturally adapted service for international students in January: a counsellor who speaks Mandarin and Hindi, and drop-in sessions advertised as “study and well-being support” rather than counselling. The graph shows the number of first appointments made by international students in each month of that academic year.
Source 4
A counsellor at the same university carried out semi-structured interviews in English with nine international students from China and India (five women, four men, aged 19–23) who had experienced a period of low mood but had not used the counselling service. Participants were recruited through a poster in the international students’ lounge. The counsellor transcribed and coded the interviews alone using thematic analysis and reported three themes.
“Keeping it in the family”: problems were to be discussed with family or solved privately. “At home, if you are sad, you talk to your mother, not a stranger. Going to a counsellor would mean my family has failed me.” (Participant 3)
“The body speaks first”: distress was experienced as tiredness, headaches or poor sleep, and taken to a doctor rather than a counsellor. “I didn’t think I was depressed. I thought I was sick, so I went to the clinic for my sleep.” (Participant 7)
“Someone who would understand”: participants said they might use a service if the counsellor shared or understood their background, and several did not know the service was free. “I would go if I knew they understand how it is for us. And I thought it costs money.” (Participant 1)
Question 1: an issue that limits interpretation
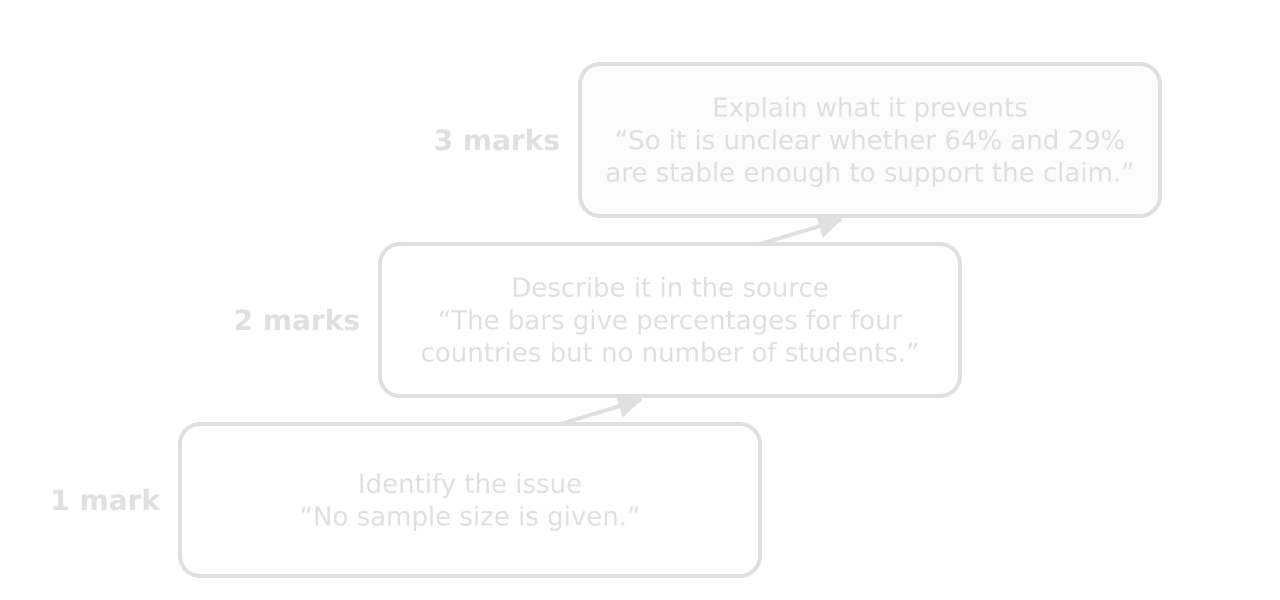
Question 1 asks you to explain one issue that limits the interpretation of the information in a given source, usually a graph or table. It is worth 3 marks, awarded in three steps: 1 for identifying a relevant issue, 2 for describing it clearly, and 3 for explaining it. The step from 2 to 3 is the one most answers miss.
Issues worth looking for
The full range of issues with graphs and tables (a truncated axis, missing spread, outliers, percentages without bases and others) is part of the HL data analysis course. In Paper 3 the most valuable issues are those that connect the source to the claim, because they explain why the source cannot fully test it.
Issue | What it looks like in a source | What it prevents |
|---|---|---|
The measure does not match the claim | The claim is about behaviour, the source measures intentions or attitudes; the claim is about culture, the source compares countries | Concluding that the source shows the claimed effect on the claimed variable |
Aggregated data | National or group averages | Concluding anything about individuals (ecological fallacy) or about culture rather than other national differences |
No sample size or spread | Percentages or means with no n, no standard deviation, no error bars | Judging whether differences are stable or meaningful |
Correlational or cross-sectional data | Groups compared without random allocation; a single correlation | Concluding that one variable causes the other |
No comparison | A trend after a change, with no control group or earlier period | Attributing the change to the intervention |
Uncontrolled confounding variables | Groups that differ in more than the variable of interest (cost, access, language) | Attributing differences to the variable in the claim |
Several other issues would also earn full marks on Source 1, as long as each is explained. The measure is an intention (“would see a counsellor”), not actual help-seeking, so the graph cannot show what students do when they are distressed. No sample sizes are given, so the stability of the percentages is unknown. The survey was online and in one wording, so the phrase “counsellor or psychologist” may not mean the same in every country.
Question 2: analyse the findings and state a conclusion
Question 2 names a source and asks you to analyse its findings and state a conclusion, usually linked to the claim. The markband has two parts: the analysis must be detailed, and the conclusion must be explicitly linked to the findings. A correct but brief summary of the numbers reaches the middle band; a conclusion that is stated without showing which findings support it does the same.
A routine for the analysis
Describe the main pattern with numbers. Quote the key values and say which way they go.
Compare. Calculate or state the size of the differences (in points, percentages or as a proportion), and compare groups or conditions with each other.
Use the spread, sample and statistics. Standard deviations show how much individuals vary and how far groups overlap; sample sizes show how much weight a result can carry; a p-value or significance statement shows whether a difference is likely to be due to chance; a correlation’s size and sign show the strength and direction of a relationship.
Look for what complicates the pattern. Subgroups, a variable that might explain the difference, a measure that does not quite match the claim.
State the conclusion, with the findings it rests on and appropriate caution (“suggests”, “is consistent with”, “provides partial support”).
The model answer describes, compares (in points and in relation to the standard deviation), uses the p-value and the correlation, finds the complication in the awareness row, and only then concludes. The conclusion names the findings it rests on and states how far they support the claim.
Question 3: credibility, bias or transferability
Question 3 is about a qualitative source and is always one of three fixed questions: how the researcher could improve the credibility of the findings, how the researcher could avoid bias, or to what extent the findings are transferable to other populations or contexts. Because the three questions are known in advance, the ideas can be prepared; the marks depend on applying them explicitly to the source.
Question | Meaning of the consideration | Ideas to apply to the source |
|---|---|---|
Improve the credibility of the findings | How far the findings give a true picture of participants’ experiences and perceptions | Triangulation (methods, data, researchers); member checking; reflexivity; a second coder and an audit trail; prolonged engagement; thick description; data saturation |
Avoid bias | Preventing the researcher, the participants or the sample from distorting the findings | Researcher bias and confirmation bias in questions and coding; participant bias, social desirability bias and the effect of who the interviewer is; sampling bias in recruitment; reflexivity, open non-leading questions, independent coders, an interviewer without a stake in the result |
To what extent are the findings transferable | How far the findings apply to other settings or groups, judged by the reader using a detailed description of the original context | Who the participants were and how they were recruited; the setting; the language and the interviewer; thick description of context; whether similar themes appear elsewhere; a judgement on where they would and would not transfer |
The bias and transferability questions draw on the same details of Source 4, but organised differently.
Question 4: synthesis
Question 4 restates the claim and asks to what extent it is valid, using your own knowledge and at least three of the sources. It is worth half the paper and is marked with a single markband for the whole answer. The top band needs detailed knowledge relevant to the claim, at least three sources interpreted (not just mentioned) to support the discussion, different points of view identified and evaluated, and a reasoned conclusion.
Synthesis means combining the sources into one argument about the claim. Each source is used for what it can show, weighed against its limitations, and set against the others: where sources agree, the evidence is stronger; where they disagree, the answer must explain why. Own knowledge adds theory, research and methodological understanding from the course that helps interpret the sources.
Weighing the sources
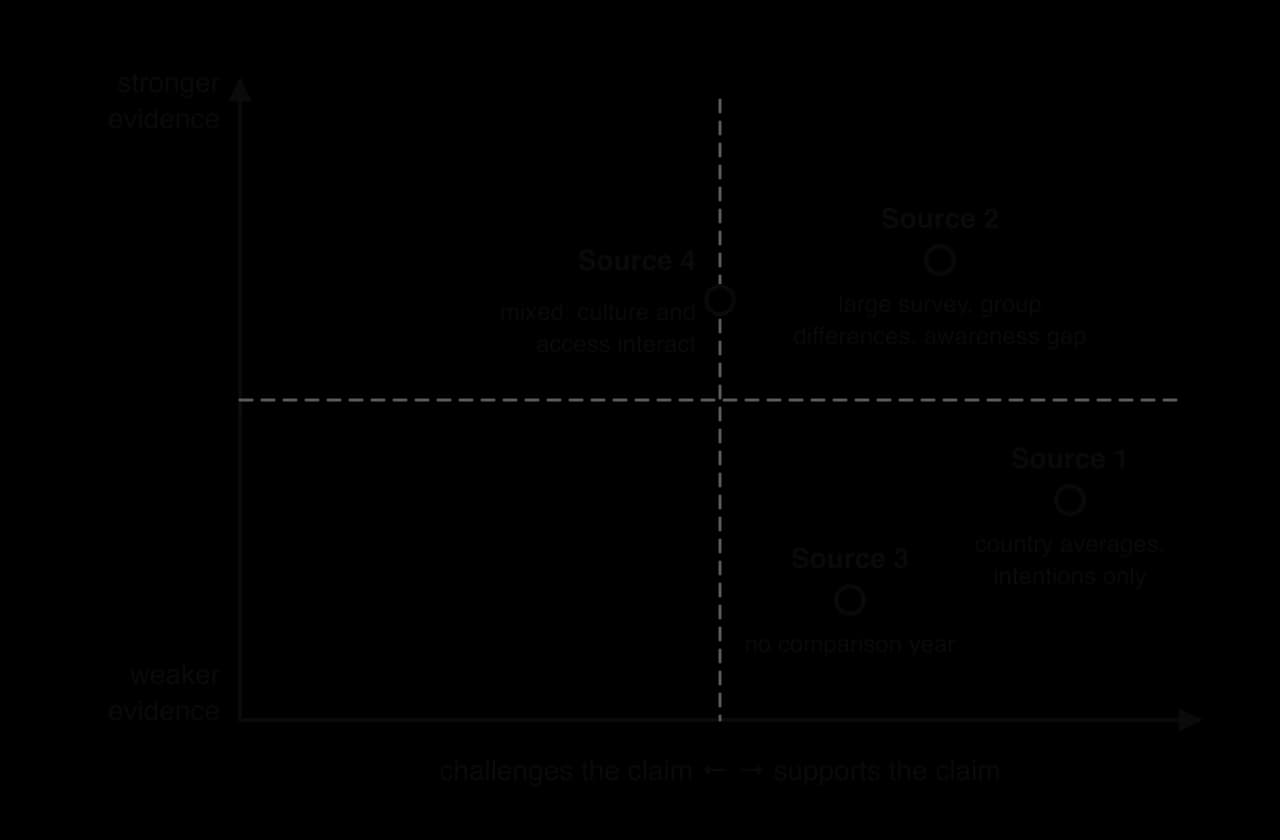
Before writing, it helps to place each source on two dimensions: whether it supports or challenges the claim, and how strong it is as evidence. Strength depends on design, sample and how well the measures match the claim.
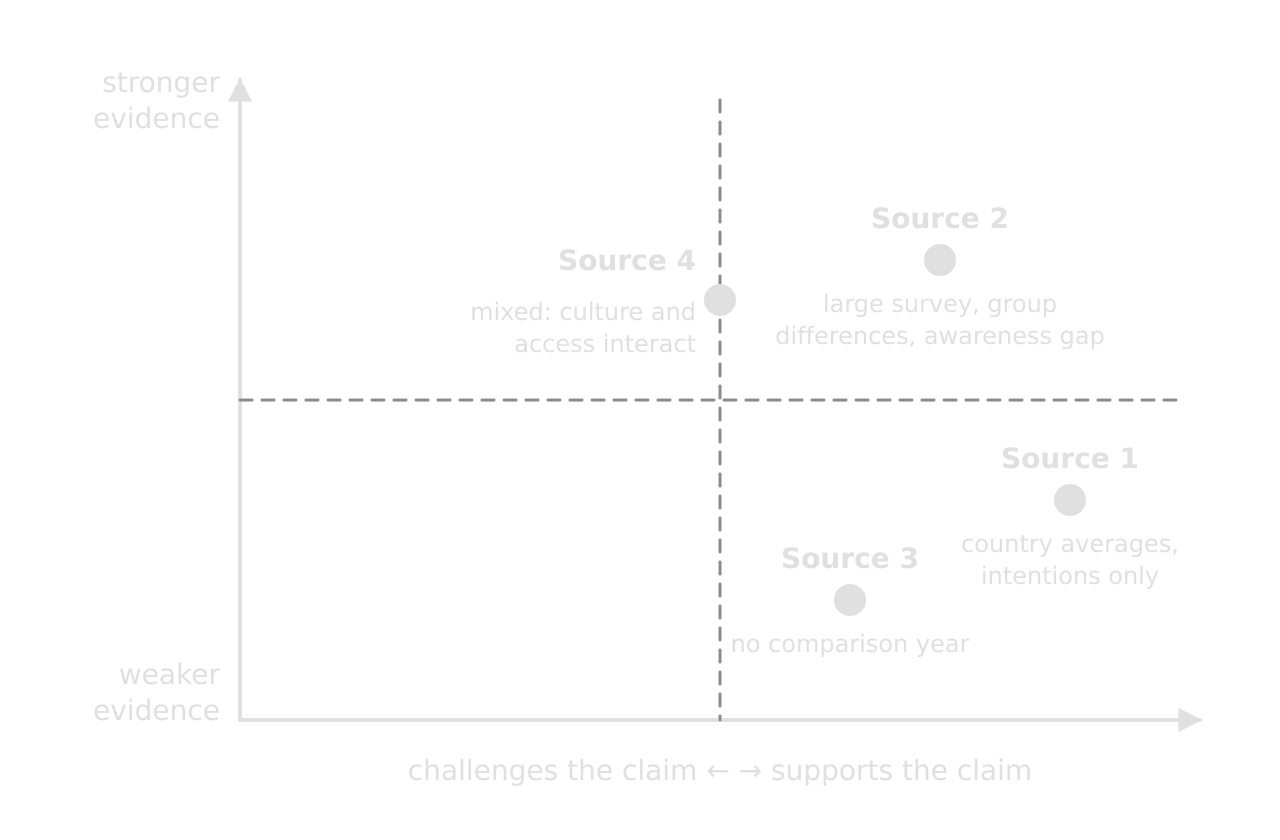
Source | What it shows about the claim | Main limitation | Direction |
|---|---|---|---|
1 | Willingness to see a counsellor falls from 64% to 29% across countries ordered by individualism | Countries, not cultures; intentions, not behaviour; no sample sizes | Supports, weakly |
2 | Significant group differences in attitudes and self-stigma; self-stigma correlates −0.41 with attitudes | Correlational; large overlap; large gap in awareness of the service | Supports, with an alternative explanation |
3 | Appointments rise after a culturally adapted service begins | No comparison year or group; exam-season pattern | Supports, weakly |
4 | Family privacy and bodily experience of distress, but also lack of information and the wish for an understanding counsellor | Nine students, one interviewer from the service, interviews in English | Mixed: culture and access interact |
Using your own knowledge
Own knowledge can come from the culture extension (and its research challenges), from the health and well-being context, and from research methodology. It is most effective when it interprets a source, not when it is added as a separate paragraph.
Methodological challenges of culture research: the ecological fallacy (Source 1), imposed etic measures that may not mean the same in every culture (a Western “help-seeking attitudes” scale in Source 2), and the difficulty of separating culture from confounding variables such as cost, language and access (Sources 1–3).
Research on cultural expression of distress: Ryder et al. (2008) found that Chinese outpatients with depression reported more somatic symptoms when speaking to a clinician, while Euro-Canadian outpatients reported more psychological symptoms on every method used. Findings like this help interpret the theme “the body speaks first” in Source 4: if distress is experienced physically, people may seek a doctor rather than a psychologist.
Research on stigma and help-seeking: a systematic review of 144 studies by Clement et al. (2015) found that stigma had a small-to-moderate negative effect on help-seeking and that ethnic minorities and young people were among the groups most deterred by it. This supports the interpretation of the negative correlation in Source 2, but it also suggests that stigma is one barrier among several.
Concepts: causality (no source is a true experiment), measurement (intentions versus behaviour; country versus culture) and perspective (emic accounts in Source 4 against etic scales in Source 2).
A structure for the answer
Introduction: restate the claim, define the key terms (what “culture” and “willingness to seek help” mean and how the sources measure them) and state the line of argument.
Evidence supporting the claim: the strongest supporting sources first, each interpreted and evaluated, with own knowledge to explain the pattern.
Evidence that challenges or qualifies the claim: alternative explanations (access, awareness, cost, language), counter-evidence in the sources, and methodological limits.
Evaluation of the evidence as a whole: where sources agree, what kinds of design are missing (no true experiment, no measure of individuals’ cultural values), how far the sources match the claim.
Conclusion: a reasoned judgement on the extent to which the claim is valid, ideally refining it into a more precise claim the evidence does support.
A plan becomes a top-band answer when each point is written out as interpretation: the numbers or themes from the source, what they suggest about the claim, why that suggestion is limited, and how own knowledge helps decide. The opening of the second paragraph shows the level of development needed.
Own knowledge is the second common weakness in synthesis answers.
Summary
Paper 3 is built around one claim about culture, motivation or technology in one context, tested by several quantitative and qualitative sources.
Reading the claim first and classifying every source (data type, design, sample, measures, key results, direction) prepares all four questions.
Question 1 rewards one issue that is identified, described with details from the source and explained in terms of what it prevents the reader concluding.
Question 2 rewards detailed analysis (numbers compared, spread, sample and statistics used, complications found) and a conclusion explicitly linked to the findings.
Question 3 is always about credibility, avoiding bias or transferability in a qualitative source, and needs explicit reference to that source.
Question 4 is a synthesis: at least three sources interpreted and weighed, own knowledge used to interpret them, different points of view evaluated and a reasoned conclusion.
In culture research, comparing countries, measuring intentions and confounds such as access and language are the issues that most often limit the evidence.
A conclusion that refines the claim into a more precise one the evidence supports is usually more convincing than a simple yes or no.
Self-check
- To do:
I can describe the resource booklet, the claim and the four Paper 3 questions with their marks.
- To do:
I can classify each source by data type, design, sample, measures and direction.
- To do:
I can explain one issue that limits the interpretation of a graph or table, to the full 3 marks.
- To do:
I can analyse a table of descriptive and inferential statistics and state a conclusion linked to the claim.
- To do:
I can discuss credibility, bias or transferability with explicit reference to a qualitative source.
- To do:
I can plan a synthesis answer that weighs at least three sources and uses my own knowledge.
- To do:
I can reach a reasoned judgement on a claim, including a refined version of it.
Carry on with Psychology in Augment
With a free account, Augment remembers where you stopped in the notes and which questions you have marked.