Augment Education
    • Question bank
    • Quick fire
    • Worksheets
    • Flashcards
    • Notes
    • Try a quick-fire round
    • All features
    • Business
    • Digital Society
    • Economics
    • Geography
    • Global Politics
    • History
    • Philosophy
    • Psychology
    • Anthropology
    • World Religions
    • Biology
    • Chemistry
    • Physics
    • Computer Science
    • Design Technology
    • ESS
    • SEHS
    • Language and literature
    • Language acquisition
    • Maths AA
    • Maths AI
    • Dance
    • Film
    • Music
    • Theatre
    • Visual Arts
    • Grade calculator
    • Grade boundaries
    • Subject checker
    • Focus timer
    • Exam countdown
    • All free tools
    • IB guide
    • All subjects
  • Blog

Search

Search subjects, the syllabus, glossary terms, the booklets, the IB guide, help and the blog

Log inStart free
augment

Augment Education

IB Diploma revision built around the syllabus.

contact@augment-education.com

Product

  • Features
  • Question bank
  • Quick fire
  • Worksheets
  • Flashcards
  • Notes
  • Subjects
  • What's new

Learn

  • IB guide
  • Booklets, explained
  • Glossary
  • Blog
  • Free tools
  • Grade calculator
  • Subject checker

Company

  • About
  • Help
  • For parents
  • For teachers
  • Comparisons

Subjects

  • English A Lit
  • English A Lang & Lit
  • Chinese A Lit
  • Chinese A Lang & Lit
  • Spanish A Lit
  • Spanish A Lang & Lit
  • English Lit & Perf
  • Spanish Lit & Perf
  • English B
  • Mandarin B
  • Spanish B
  • English ab initio
  • Mandarin ab initio
  • Spanish ab initio
  • Business
  • Digital Society
  • Economics
  • Geography
  • Global Politics
  • History
  • Philosophy
  • Psychology
  • Anthropology
  • World Religions
  • Biology
  • Chemistry
  • Physics
  • Computer Science
  • Design Technology
  • ESS
  • SEHS
  • Maths AA
  • Maths AI
  • Dance
  • Film
  • Music
  • Theatre
  • Visual Arts

Augment Education is developed independently of the International Baccalaureate Organization and is not endorsed by it. “IB” and “International Baccalaureate” are its trademarks.

© 2026 Augment Education. All rights reserved.

  • Privacy
  • Terms
  1. Subjects
  2. Geography
  3. Paper 3: the HL extension

Paper 3: the HL extension

Choose the right Paper 3 question, analyse in part (a) without evaluating, and synthesise, weigh perspectives and judge in part (b), with full model answers for units 4, 5 and 6.

  • IB Geography
  • Exam skills
  • HL only

31 min readLast reviewed 18 Oct 2026

HL only

Higher level only: Paper 3 examines the HL extension, Geographic perspectives — global interactions (units 4, 5 and 6), and is taken only by HL students.

Paper 3 is the shortest paper and the most demanding per question. It asks for one question from a choice of three, one on each HL unit: Power, places and networks; Human development and diversity; and Global risks and resilience. Each question has two parts on the same unit: part (a), worth 12 marks, asks for analysis or explanation; part (b), worth 16 marks, asks for a discussion of a quoted statement.

The two parts reward different things. Part (a) is marked on knowledge, analysis and structure, and needs no synthesis or evaluation. Part (b) requires synthesis across units and evaluation for its higher bands, as the 10-mark essays in Papers 1 and 2 do, but on a larger scale. Answering the two parts as if they were the same kind of essay is the commonest reason for an HL candidate to lose marks in Paper 3.

How Paper 3 is set out

Part

Marks

Typical command terms

What the higher bands need

(a)

[12]

“Analyse how…”, “Explain how…”, “Examine…”

Every aspect of the question addressed, with detailed evidence integrated in linked paragraphs and a conclusion that links back to the question

(b)

[16]

A quoted statement, then “Discuss this statement” or “To what extent do you agree with this statement?”

As for (a), plus synthesis with other units, an opinion linked to the evidence, and evaluation of other perspectives and of how certain the evidence is

Only one question is answered, so the whole hour goes on two answers about one unit. Part (b) is worth more marks than part (a) and is harder, so it deserves more time, but part (a) must not be rushed: its 12 marks are the easier ones to earn.
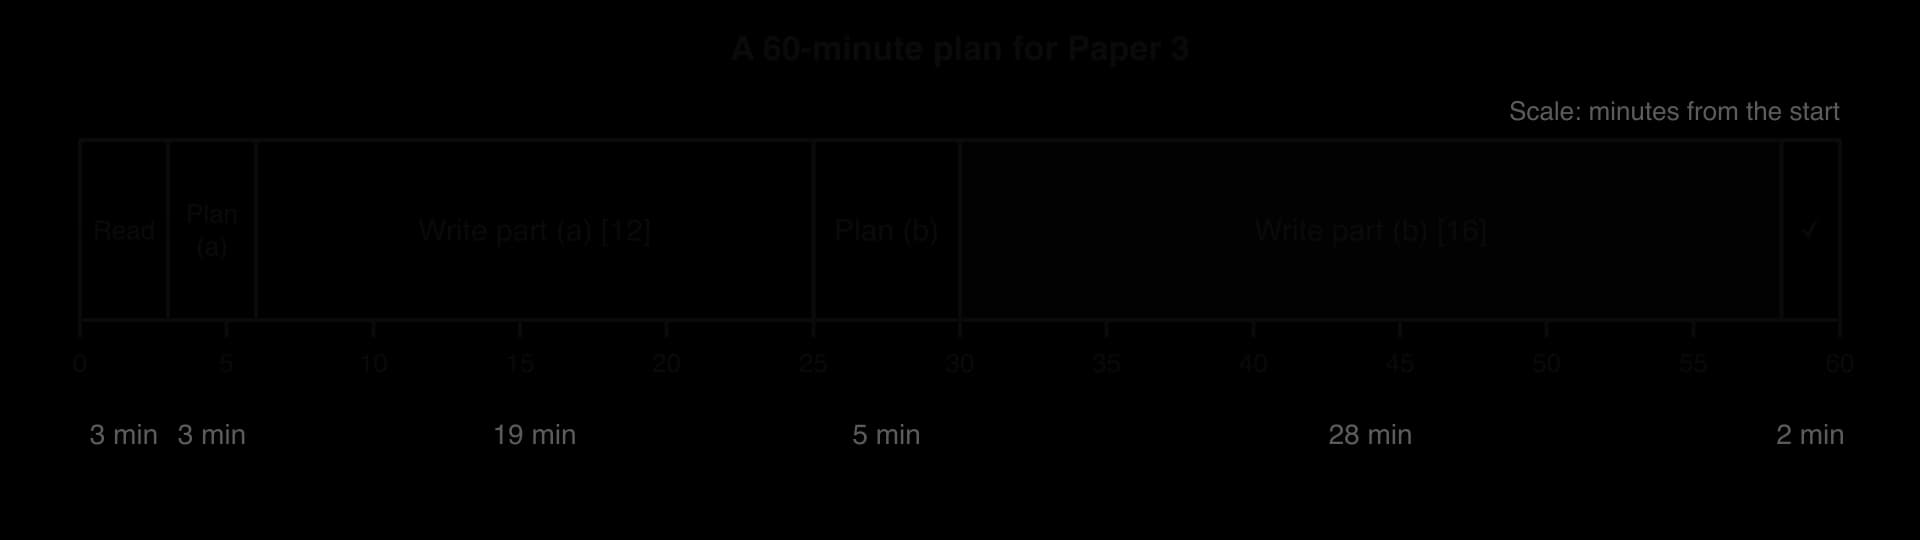
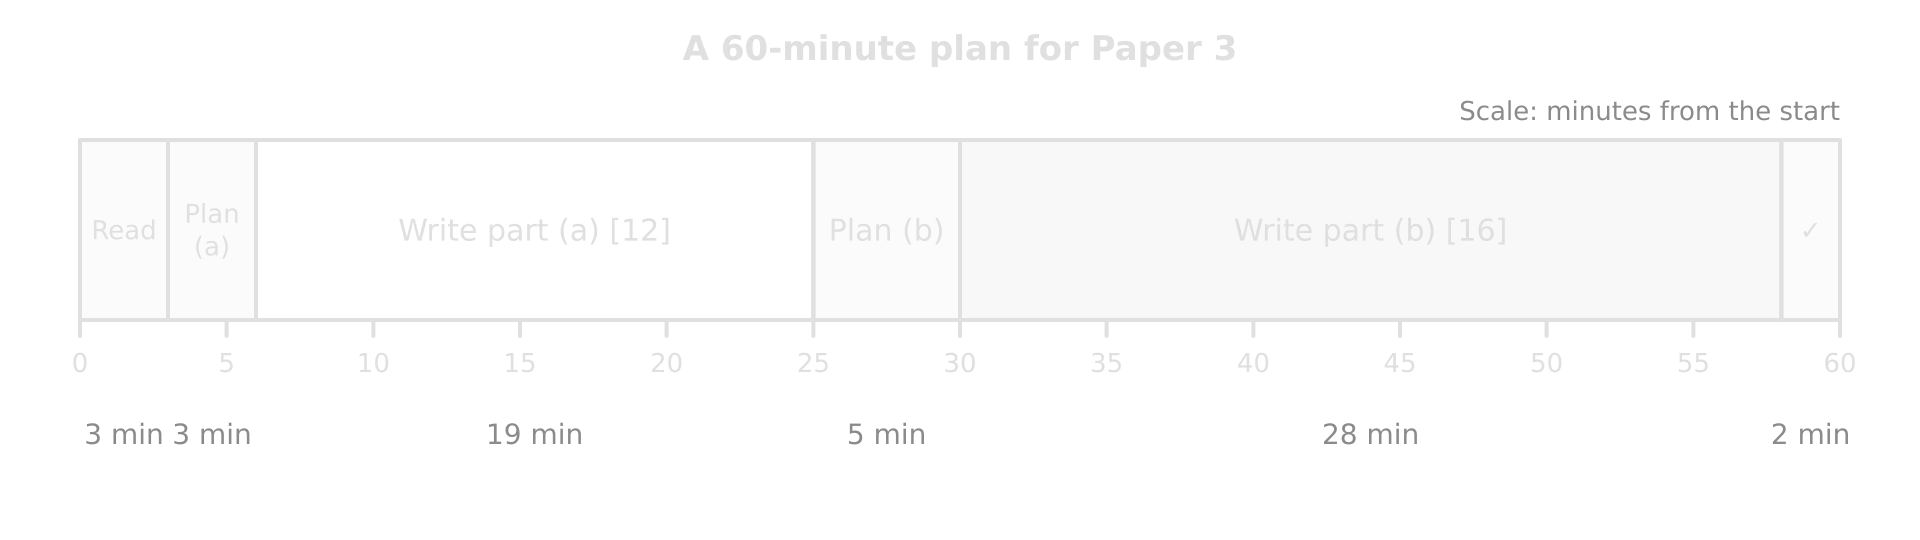
Timeline of 60 minutes for Paper 3: read and choose 3, plan (a) 3, write (a) 19, plan (b) 5, write (b) 28, check 2 minutes; about 25 minutes for part (a) and 35 for part (b).Timeline of 60 minutes for Paper 3: read and choose 3, plan (a) 3, write (a) 19, plan (b) 5, write (b) 28, check 2 minutes; about 25 minutes for part (a) and 35 for part (b).
About 25 minutes for part (a) and 35 minutes for part (b), each including reading or planning time, keeps the time in proportion to the marks.

Choosing the question

Read all three questions, both parts of each, and underline every command term before choosing. A question with an attractive part (a) can have a part (b) that you cannot argue, and part (b) carries more marks. The best choice is usually the unit where you can name the most evidence for part (b), across the widest range of themes.

Tip

Choose by part (b). Ask: can I name three themes from different HL units that bear on this statement, with a located example and a figure for each? If yes for one question and not the others, that is the question to answer, even if its part (a) looks harder.

Common mistake

Assuming that Paper 3 requires knowledge of all three HL units in one answer. Each question is set on one unit, and part (a) stays within it. Part (b) rewards links to the other units, the core and the options, but the answer is still centred on the unit of the question.

Part (a): analysis without evaluation

Part (a) is marked with a markband of four bands, three marks wide. Its strand for synthesis and evaluation reads, at every band, that none is expected. A part (a) answer reaches 10–12 by breaking the question into its parts, addressing every one of them with detailed evidence, linking its paragraphs into a coherent analysis, and ending with a conclusion that summarises the argument and links it back to the question.

Band

Headline description (paraphrased)

10–12

Addresses all aspects of the question; analysis explained with detailed evidence integrated in the paragraphs; well structured, with linked paragraphs and a conclusion that links back to the question

7–9

Addresses most parts of the question; analysis outlined with relevant evidence; paragraphs each address one element but lack links between them

4–6

Partly addresses the question; evidence a mix of relevant and irrelevant; largely unstructured

1–3

General, not focused on the question, lacking detail and structure

What moves a part (a) answer up

Markschemes for part (a) apply the bands with a consistent rule. A weakly evidenced outline of one or two points reaches 4–6. A structured, evidenced analysis of either two or more mechanisms or ways or a wider range of contexts or outcomes reaches 7–9. An answer that does both reaches 10–12.

  • Mechanisms or ways: the different routes by which the thing in the question happens (for example, power gained through finance, infrastructure and institutions).

  • Contexts or outcomes: different places, scales, groups or results, including trade-offs (what is gained by one group and lost by another).

  • Focus on the key term: if the question is about *power*, every paragraph must show power, not just trade or wealth; if it is about *diversity*, every paragraph must show diversity changing.

Exam tip

In part (a), define the key term in the question in your first two sentences and come back to it in every paragraph. Markschemes note when answers drift from the key term (writing about wealth when the question asks about power), and such answers rarely leave the middle bands.

Evaluation does no harm in part (a) where it is part of the analysis, for example a sentence on why one mechanism matters more than another. What wastes time is a long evaluative section or a balanced “for and against” structure that the question does not ask for, written at the cost of the time part (b) needs.

Part (b): synthesis, perspectives and judgment

Part (b), an extended response like part (a), is marked with four bands, four marks wide. Its knowledge, analysis and structure strands are worded as in part (a); what changes is the synthesis and evaluation strand, which becomes required from the 9–12 band upwards. That strand has three parts.

  • Synthesis: links between the answer and other topics of the course. At 9–12 links refer to several topics and are described; at 13–16 they are explained and supported by the evidence.

  • An opinion or perspective on the statement. At 13–16 it is explicitly linked to the range of evidence in the answer.

  • Evaluation of evidence and perspectives: at 13–16 the answer analyses how certain the evidence is and describes other perspectives or interpretations.
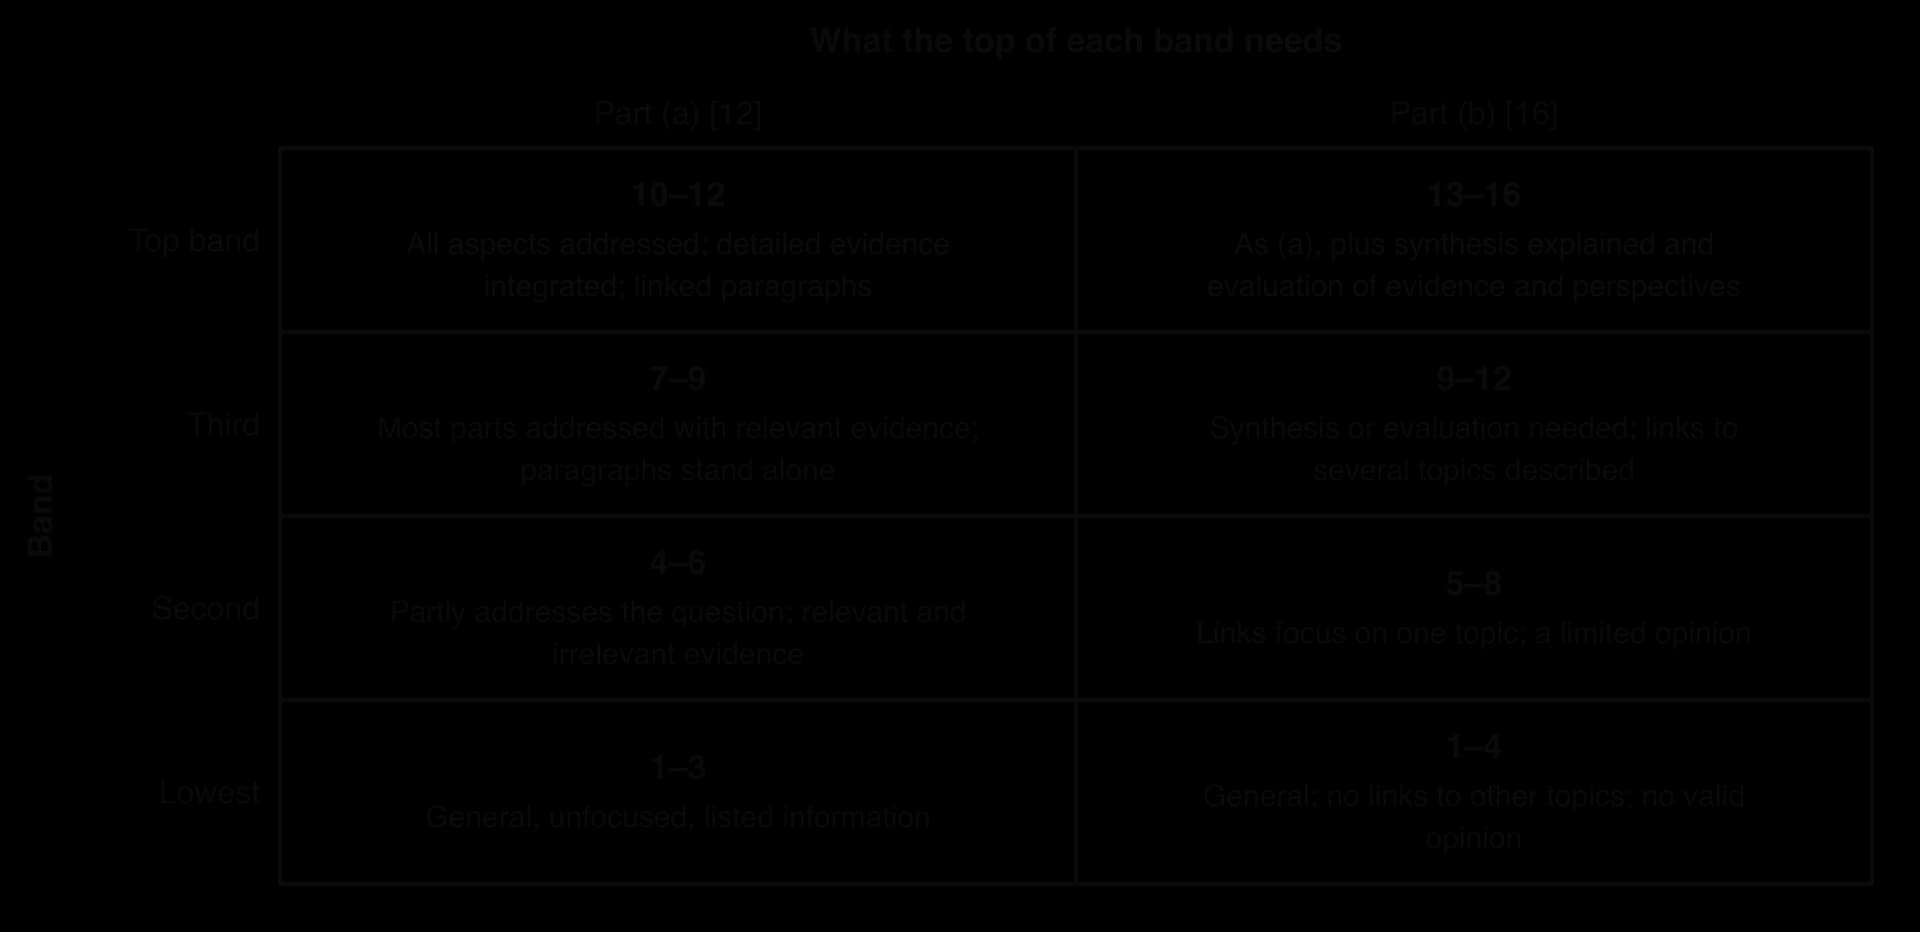
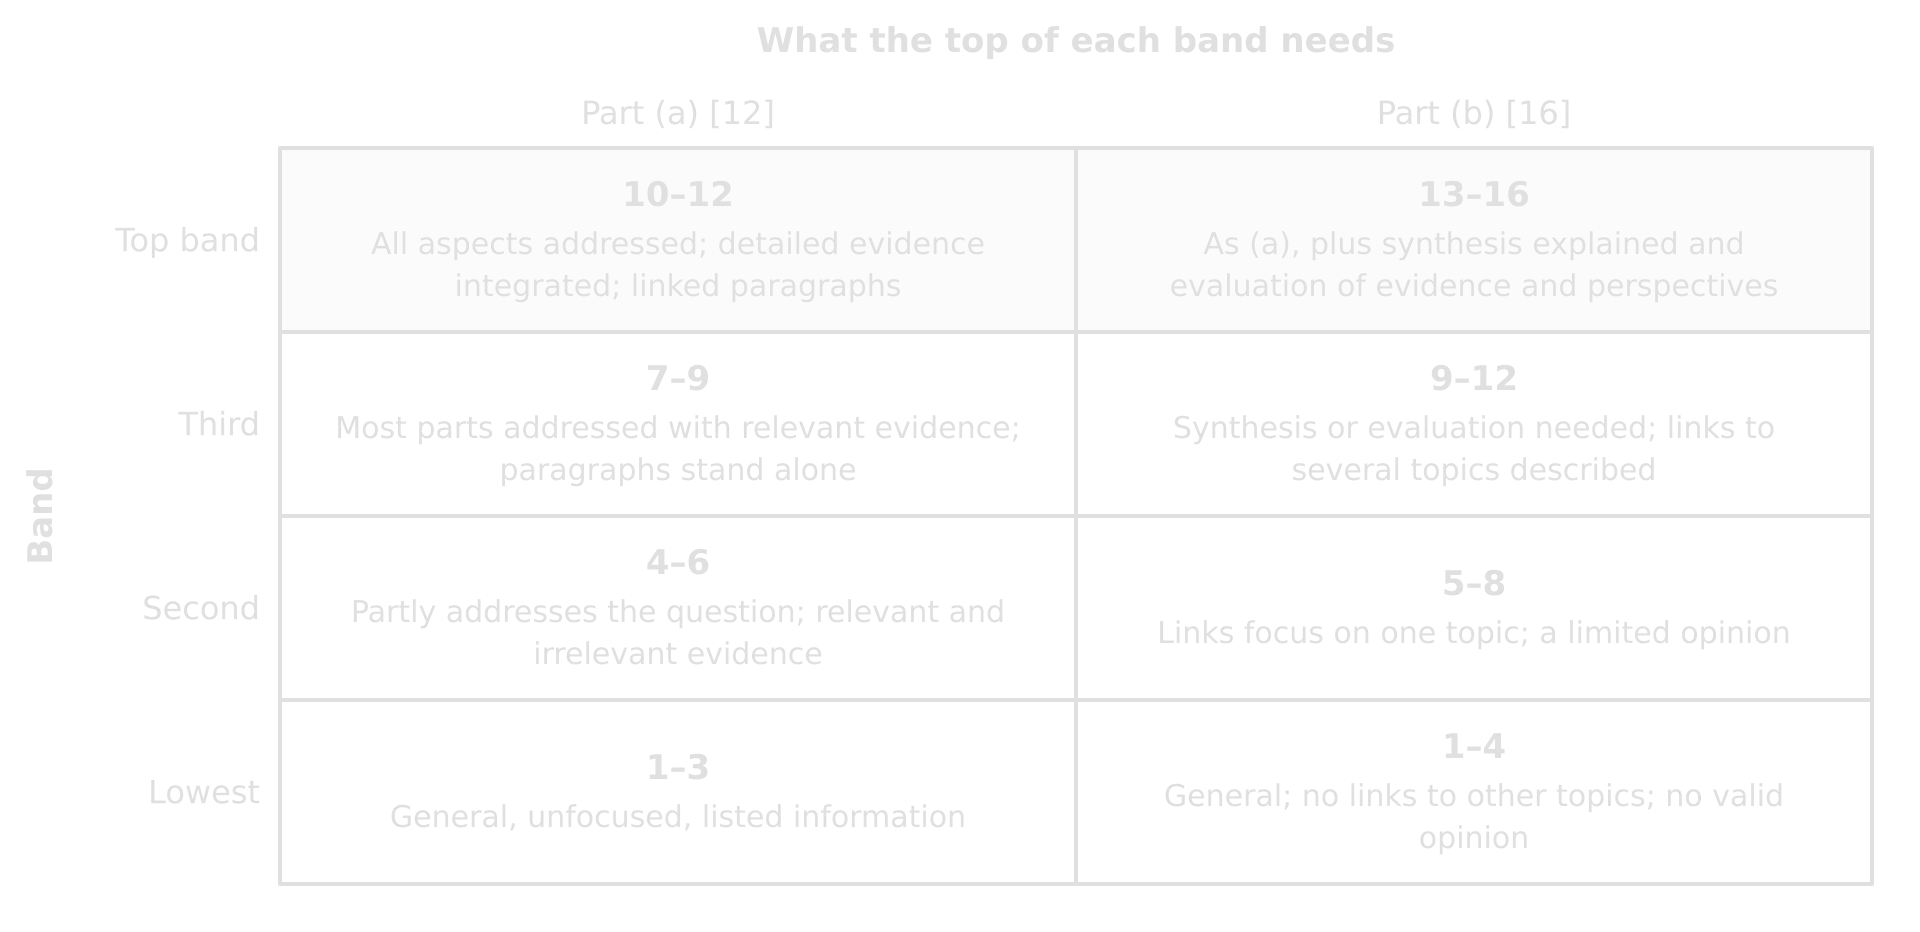
Grid comparing Paper 3 markbands: part (a) 1–3, 4–6, 7–9, 10–12 and part (b) 1–4, 5–8, 9–12, 13–16, with what each band needs; synthesis and evaluation appear only in part (b).Grid comparing Paper 3 markbands: part (a) 1–3, 4–6, 7–9, 10–12 and part (b) 1–4, 5–8, 9–12, 13–16, with what each band needs; synthesis and evaluation appear only in part (b).
The two markbands share their structure, but only part (b) asks for synthesis and evaluation, and its top band needs both, together with an opinion tied to the evidence.

Markschemes for part (b) list themes from across the HL extension that an answer might use, each with its unit, and credit answers that synthesise three or more of them. A structured synthesis that links several well-evidenced themes or a critical conclusion (or ongoing evaluation) informed by concepts and perspectives reaches 9–12; an answer with both reaches 13–16. Unexpected approaches are credited where they are relevant.

Synthesis across units

Synthesis is the link between the statement and themes from other parts of the course, explained rather than mentioned. The strongest part (b) answers draw on at least three themes from different HL units, and often a core unit or an option as well, and show how they bear on the statement.
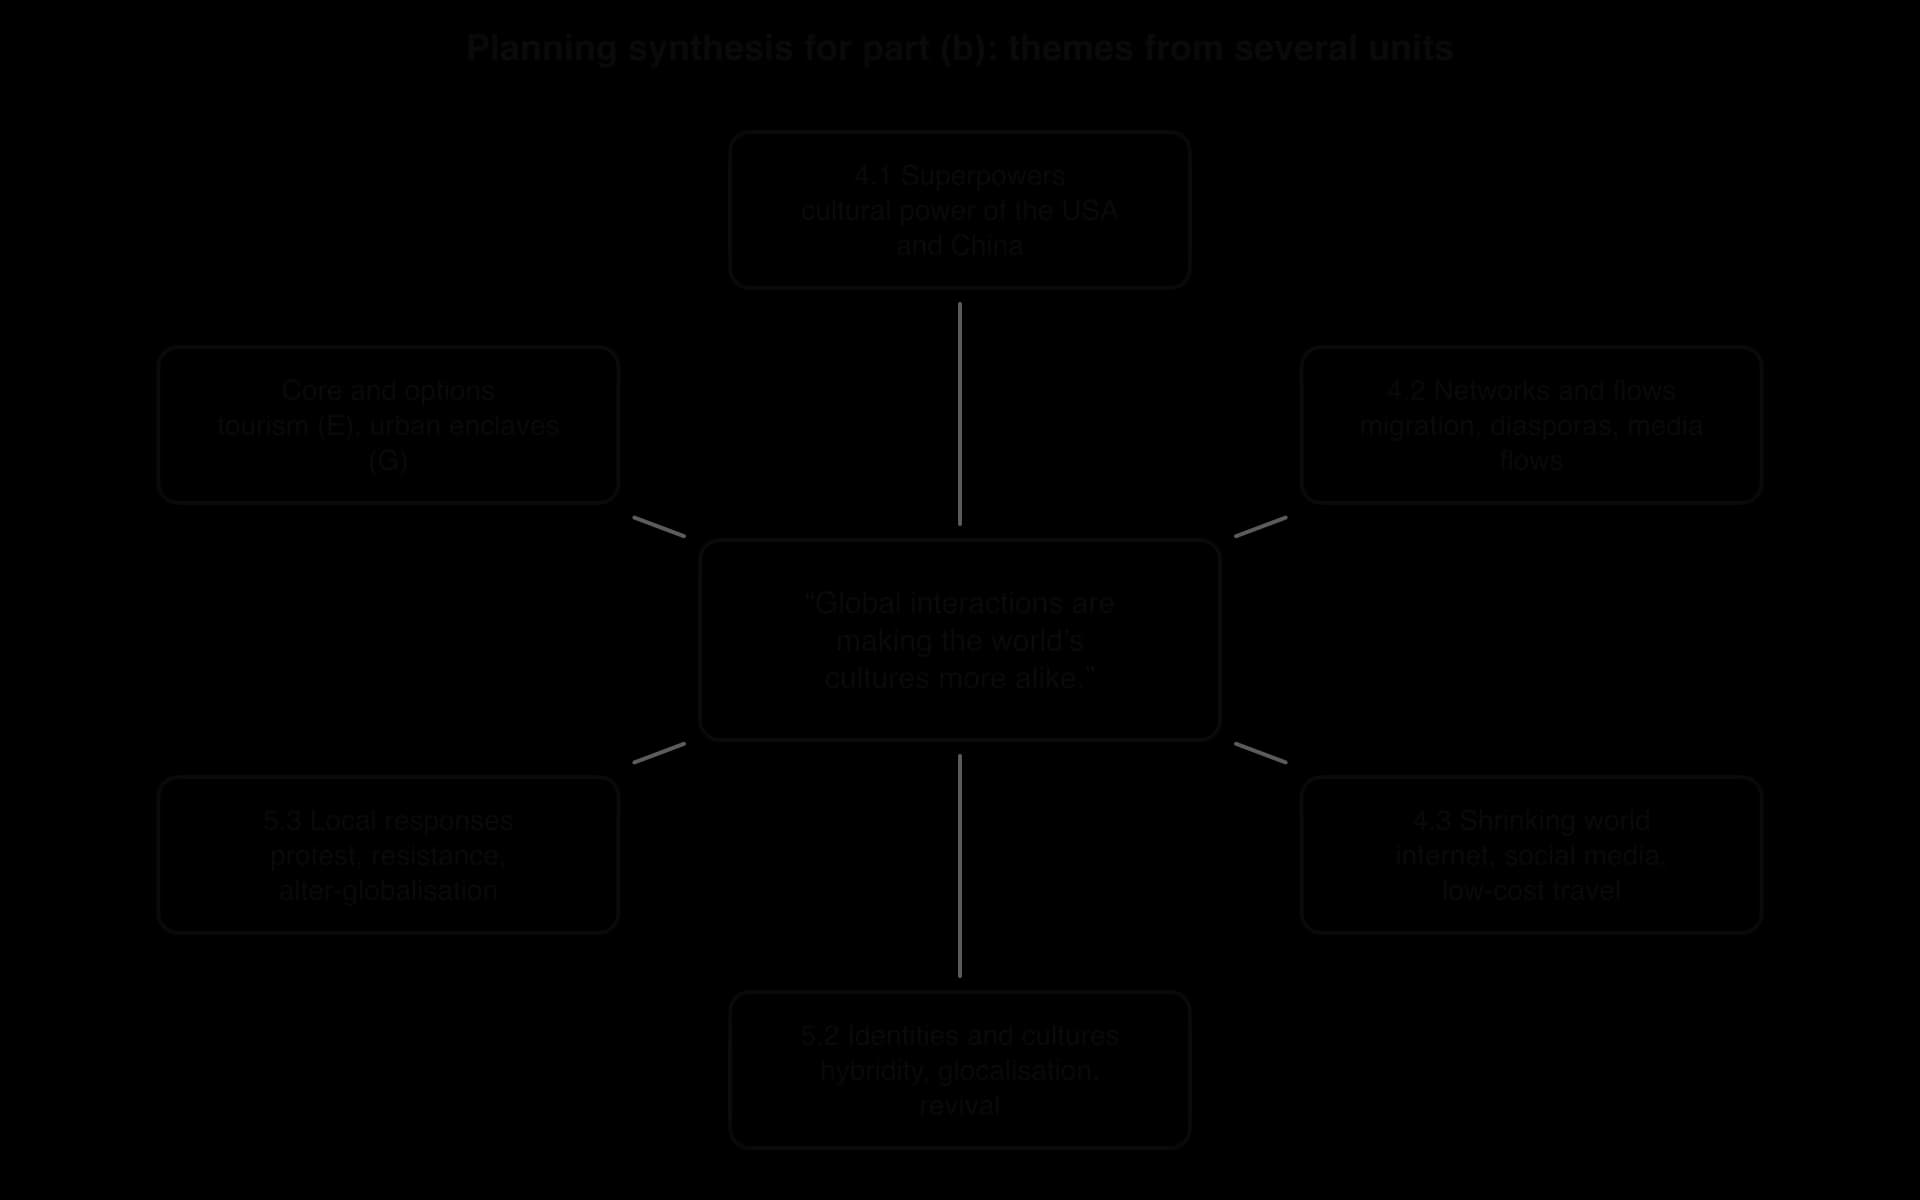
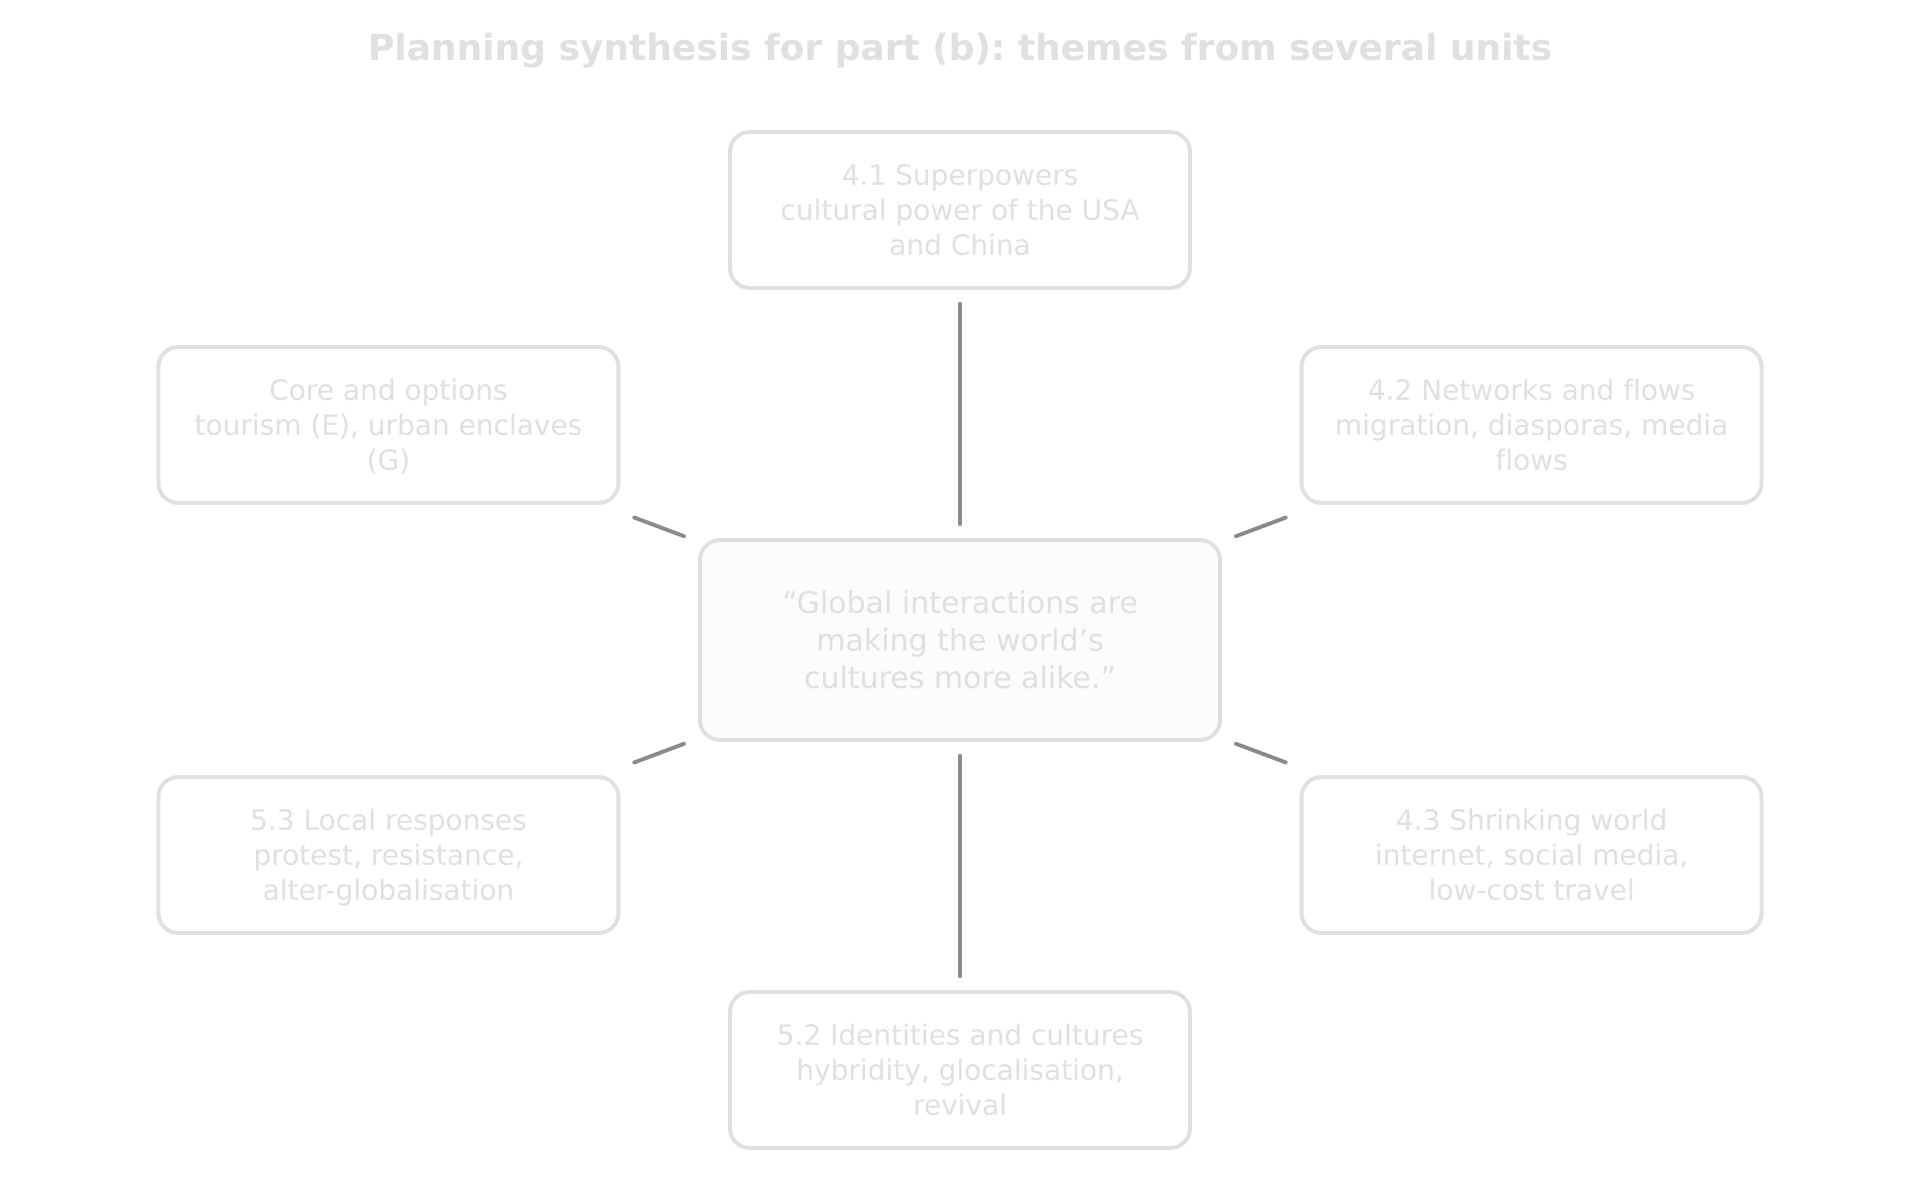
Hub diagram: a statement on cultures becoming more alike linked to six themes: superpowers, networks and flows, shrinking world, identities and cultures, local responses, and core and options.Hub diagram: a statement on cultures becoming more alike linked to six themes: superpowers, networks and flows, shrinking world, identities and cultures, local responses, and core and options.
A planning web for a Unit 5 statement: each spoke is a theme from a different unit that supplies evidence for or against the claim. Three well-evidenced spokes are enough for the top band; six named without evidence are not.

Perspectives and the certainty of evidence

The top band asks for “critical analysis of the relative certainty of evidence”. In practice this means saying how far a piece of evidence can be trusted and what it does not show: an index that measures some flows and not others, a statistic that depends on how it was collected, a case that may not be typical, a forecast with a range of outcomes. One or two such sentences, placed where the evidence is used, are enough.

Kind of evidence

A question to ask about its certainty

Example of an evaluative sentence

An index or ranking

What does it measure, and what does it leave out?

“The KOF index counts McDonald’s restaurants and IKEA stores as cultural globalisation, so it may understate the global reach of South Korean or Indian culture.”

A single case

Is it typical, or the best-known exception?

“Hambantota is the most cited case of debt-trap diplomacy, but researchers have found no case in which Chinese banks seized an asset.”

A recent event

Is it too soon to judge the long-term outcome?

“The 2026 disruption at the Strait of Hormuz is too recent to show whether supply chains will be permanently rerouted.”

A projection

What assumptions and range lie behind it?

“The projection of up to 216 million internal climate migrants by 2050 is the upper end of a range that assumes no action.”

Perspectives are the views of different stakeholders, places and scales. A statement about global interactions looks different to a government, a transnational corporation, a worker, a local community and an environmental group, and to a high-income and a low-income country. Naming whose perspective each argument represents is one of the quickest ways to show evaluation.

Common mistake

Staying inside one narrow topic in part (b). An answer that discusses a Unit 4 statement with evidence from a single subtopic can be accurate and well argued yet stay at 9–12, because the synthesis strand at 13–16 needs links to other (sub)topics explained and supported by evidence. Links to the other HL units, the core and the options are the surest way to show it.

Model answers for each unit

Each unit has a full question, part (a) and part (b), with a plan, a model answer and a note on the markband. The part (a) answers analyse without evaluating; the part (b) answers draw on themes from other units, weigh perspectives and comment on the certainty of their evidence.

Unit 4, Power, places and networks

Worked example

(a) Analyse how China has used the Belt and Road Initiative to increase its global power. [12]

Show the plan, model answer and markband note

Plan. Define power (hard, soft, economic and geopolitical) and the BRI → mechanism 1: infrastructure and trade routes (CPEC, Piraeus, railways) → mechanism 2: lending and debt (Hambantota) → mechanism 3: institutions (AIIB) → contexts: Asia, Europe, Africa; gains for borrowers and for China → conclusion linking back to power.

Model answer.

Power is the ability to influence the decisions and actions of other places, through force (hard power), attraction (soft power) or economic means such as trade and lending. The Belt and Road Initiative (BRI), announced by President Xi Jinping in Astana, Kazakhstan, on 7 September 2013 and extended to a Maritime Silk Road the following month, is China’s programme of infrastructure investment and lending abroad. It increases China’s power through three linked mechanisms: physical connections, finance and new institutions.

The first mechanism is control of routes. Projects in about 150 countries build ports, railways, roads and power stations that tie trade flows to China. The China–Pakistan Economic Corridor links Kashgar in western China to the port of Gwadar, and became partly operational in November 2016, when Chinese cargo was carried overland to Gwadar for shipment. Such routes reduce China’s dependence on the Strait of Malacca, a chokepoint whose importance President Hu Jintao called the “Malacca dilemma” in 2003, and so turn infrastructure into geopolitical security. In Europe, the Chinese-run port of Piraeus in Greece gives Chinese trade a gateway to the EU market.

Examiner’s note: a mechanism explained with located evidence and dates, and linked explicitly to power rather than to trade alone.

The second mechanism is lending. Much of the BRI is financed by Chinese lending, so borrowing governments owe repayments to China. In July 2017 Sri Lanka, struggling to repay loans for the port of Hambantota, leased a 70% stake in it to China Merchants Port for 99 years in exchange for US$1.12 billion. A 2025 study by the Lowy Institute found that for 54 developing countries, repayments to China now exceed those owed to the Paris Club of mostly Western creditors. Debt gives China influence over borrowers’ policy choices, even where, as researchers such as Deborah Brautigam argue, it has not been used to seize assets.

The third mechanism is institutional. China proposed the Asian Infrastructure Investment Bank in 2013 after arguing that the Asian Development Bank was dominated by Japan and the USA, which held about 13% of its votes each against China’s 5.5%. The AIIB began operating in December 2015 with US$100 billion of starting capital and has more than 100 members, including the United Kingdom, Germany and France, although the USA and Japan did not join. It gives China a leading voice in setting the rules of development finance.

The three mechanisms reinforce one another across contexts. Lending pays for the routes, the routes create the trade that repays the loans, and the AIIB makes China a rule-maker rather than a rule-taker. By 2025, BRI participants held nearly 75% of the world’s population and more than half of world GDP. The outcomes differ by place: Pakistan and Laos gain new ports and railways, such as the line from Boten to Vientiane, while Sri Lanka gave up control of a strategic port. Through the BRI, China has therefore increased its economic and geopolitical power by making other places depend on its routes, its money and its institutions.

Markband: 10–12. Every aspect is addressed (the question’s key term, power, is defined and kept in focus); three mechanisms are analysed with detailed, integrated evidence; a range of contexts and outcomes is covered (Asia, Europe, borrowers who gain and lose); paragraphs are linked and the conclusion links back to the question. No evaluation is needed, and the short reference to the debate over debt is part of the analysis.

Part (b) on the same unit moves from how power is gained to a judgment about how it is changing.

Worked example

(b) “Global power is shifting from established superpowers to emerging ones.” Discuss this statement. [16]

Show the plan, model answer and markband note

Plan. Define power and the two groups (USA and allies; China and others) → for: China’s economic weight and institutions (4.1); manufacturing and the global shift (4.2, Option G) → against: US financial and institutional power (4.1); US cultural and technological reach (4.3, 5.2) → complexity: power is multipolar and issue-specific; the G20 and the African Union; energy and chokepoints (3.2, 6.1) → certainty of evidence → judgment.

Model answer.

Global power is the ability to shape what happens in other places, through economic, military, political and cultural means. The established superpowers are usually taken to be the USA and its allies; the emerging superpowers are China above all, and to a lesser extent India. The statement is partly true: economic power is shifting, but financial, cultural and institutional power is shifting much more slowly, and the result is a more multipolar world rather than a simple transfer.

The strongest evidence for the statement is economic. China’s share of world manufacturing value added rose from about 18% in 2010 to 28% in 2024, a result of the global shift of production from Europe and North America to Asia. That shift gives China influence over the supply chains on which other economies depend, from electronics to solar panels: China passed 1,000 GW of installed solar capacity in May 2025. Through the Belt and Road Initiative and the AIIB, it has turned economic weight into lending and institutional power across Asia, Africa and Europe.

Examiner’s note: synthesis: the argument draws on the global shift and supply chains (Unit 4.2 and Option G) as well as on superpowers (Unit 4.1).

Against the statement, the USA’s structural power remains far greater. The US dollar made up about 58% of the world’s official foreign exchange reserves in 2022, which lets the USA borrow cheaply and use access to dollar payments as a tool of sanctions. It holds over 16% of the votes in the International Monetary Fund, where major decisions need an 85% majority, so it can block them alone. Its cultural and technological reach, through films, music, social media platforms and software, is a form of soft power that China has not matched. In these dimensions power has hardly shifted at all.

The picture is also complicated by the rise of several centres of power rather than one rival. The G20, which since 2023 includes the African Union, brings emerging economies such as India, Brazil, Indonesia and South Africa into global economic decisions; its 2025 summit in Johannesburg was the first held in Africa. Power over energy flows shows the same pattern: Qatar’s gas and the Strait of Hormuz, or Russia’s use of gas supplies to pressure Europe after 2022, show that smaller states and chokepoints can exercise power far beyond their size. Power is therefore becoming more dispersed and more dependent on the issue in question.

Examiner’s note: a third and fourth theme from different units (geopolitics and energy security, 6.1 and 3.2), explained and linked to the statement rather than listed.

The evidence itself is uncertain. Economic measures such as manufacturing share are precise, but cultural and political influence are hard to measure, and the indices that try, such as globalisation indices, carry their own assumptions about which flows count. Recent events also make trends harder to read: the USA withdrew from the Paris Agreement in 2020, rejoined in 2021 and withdrew again in 2026, and imposed new tariffs in 2025. Supporters argue that such policies defend American interests; critics argue that they weaken the alliances on which US influence rests.

Examiner’s note: evaluation of the certainty of evidence and of competing perspectives, as the 13–16 band requires.

The statement is therefore true for economic power and for influence in much of Asia and Africa, but not for financial, institutional or cultural power, where the USA remains dominant. Power is not moving from one group to another so much as spreading among more centres, including middle powers and the holders of key resources and routes. The direction of change is clear, but its speed and extent depend on choices by the USA and China that are still being made.

Markband: 13–16. The answer addresses all aspects of the statement with detailed evidence, synthesises at least four themes from different units (superpowers, the global shift and supply chains, energy and geopolitics, cultural influence), evaluates the certainty of the evidence and the perspectives of supporters and critics, and reaches an opinion explicitly linked to the evidence. Without the paragraph on uncertainty and perspectives it would be at the top of 9–12.

Unit 5, Human development and diversity

Worked example

(a) Explain how different strategies can empower women and reduce gender inequality. [12]

Show the plan, model answer and markband note

Plan. Define empowerment and gender inequality (the GII) → political strategies: quotas and reserved seats (Rwanda, India’s village councils) → legal strategies: inheritance and joint land titles (Rwanda, Ethiopia) → financial strategies: group lending (Grameen Bank) → paid work (Bangladesh’s garment industry) → contexts and outcomes: where the mechanisms have and have not changed women’s lives (Rwanda’s GII) → conclusion.

Model answer.

Gender inequality is the unequal access of women and men to resources, power and opportunities. The UNDP measures it with the Gender Inequality Index (GII), which combines reproductive health, empowerment (seats in parliament and secondary education) and participation in the labour market. Empowerment is the process by which excluded groups gain the power, resources and rights to make choices about their own lives. Strategies reduce gender inequality through four mechanisms, political voice, legal rights, access to money and paid work, which operate at scales from the nation to the household.

Political strategies change who makes decisions. Rwanda’s constitution of 2003 reserves at least 30% of posts in decision-making bodies for women, including 24 of the 80 seats in the Chamber of Deputies. The share of women deputies almost doubled at the 2003 election, and women have held more than half of the lower house since 2008, 61.3% in 2023 by the Inter-Parliamentary Union’s count. At the local scale, India reserves one-third of seats on village councils for women, so the same mechanism reaches decisions on water, schools and roads. Representation matters because those in power set the rules on land, inheritance and violence that shape the other mechanisms.

Legal strategies give women equal status in law. Rwanda’s laws give daughters and sons equal rights to inherit land, and Ethiopia and Rwanda have issued joint land titles to married couples. A title in a woman’s name gives her security if a marriage ends, collateral for a loan and bargaining power within the household, so legal rights turn household income into control over assets.

Financial strategies let women save and borrow in their own name. The Grameen Bank in Bangladesh, which became a bank in 1983, lends to groups of women who meet every week with a loan officer, so peer support and peer pressure take the place of collateral. It had nearly 9.5 million borrowers by January 2022, 96.8% of them women. The outcome depends on the borrower: randomised studies summarised in 2015 found that loans did not, on average, raise incomes or women’s decision-making power by much, and that women who already ran a business gained most.

Paid work outside the home works through income. Bangladesh’s garment industry employed about 4.2 million people in 2025, 54% of them women, many of them migrants from rural areas. A regular cash wage has been linked to later marriage, more schooling for girls and smaller families, contributing to the fall in Bangladesh’s fertility to about 2.1 in 2024.

Examiner’s note: each mechanism is explained before its evidence, and the evidence spans national, village and household scales, which is the “range of contexts” the top band rewards.

The mechanisms change some outcomes faster than others. Rwanda’s GII of 0.394 is lower than its HDI of 0.578 would predict, because of its parliamentary seats and women’s high labour force participation (58.1%). Its maternal mortality ratio of 259 deaths per 100,000 live births and the small share of women with secondary education (20.5%) show that political voice has changed the law faster than it has changed health and schooling.

Strategies therefore empower women through political voice, legal rights, access to money and paid work, and they are strongest in combination: representation changes the laws, legal titles give women control over assets, and income pays for girls’ schooling. The examples from Rwanda, India, Ethiopia and Bangladesh show these mechanisms operating at national, local and household scales, with outcomes that depend on whether gains in one dimension are matched in the others.

Markband: 10–12. Four mechanisms are explained with detailed, located evidence; a range of contexts and outcomes is covered (national, village and household scales; political, legal and economic results, including where change has been slow); definitions are clear; paragraphs are linked by the idea that the mechanisms reinforce one another; the conclusion links back to the question. The comments on modest microfinance gains and on Rwanda’s health indicators analyse outcomes rather than evaluate the strategies, which part (a) does not require.

The Unit 5 part (b) answer is planned with the web of themes shown earlier, from several units and an option.

Worked example

(b) “Global interactions are making the world’s cultures more alike.” To what extent do you agree with this statement? [16]

Show the plan, model answer and markband note

Plan. Define culture, global interactions and homogenisation → for: global brands and media, language loss (5.2, 4.3) → certainty of the evidence (KOF index, 4.1; how languages are counted) → against: reverse flows, glocalisation and hybridity (5.2), diasporas (4.2, Option E) → against: resistance by states and communities (France, Wales, New Zealand; 5.2, 5.3) → perspectives and scale (Leicester) → judgment.

Model answer.

Culture is the shared beliefs, values, customs, language and material goods of a group, learned and passed on between generations. Global interactions are the flows of goods, money, people, ideas and media between places, and the statement claims that they produce homogenisation, the convergence of cultures towards one pattern. They do spread some cultural traits everywhere, but they also produce flows in several directions, mixing and resistance, so the statement is true only to a limited extent.

The case for the statement rests on brands, media and language. The same brands, from Apple and Nike to Starbucks, appear on high streets from São Paulo to Shanghai, and platforms owned by US companies, such as Google, YouTube and Instagram, shape what billions of people see; critics call this cultural imperialism. Language loss is the clearest measured sign of convergence. UNESCO classifies 2,473 languages, about a third of the world’s total, as endangered, while the 20 most widely spoken languages are spoken by half of the world’s population. The internet and low-cost travel, which have made the world feel smaller, speed up both processes.

The evidence is less certain than it looks. The KOF Globalisation Index measures cultural globalisation partly by counting McDonald’s restaurants and IKEA stores, so it assumes that American and Swedish brands stand for global culture; a country whose own films or music reach a world audience can appear less culturally globalised than one that hosts many foreign chains. Language counts are partly political as well, because the line between a language and a dialect depends on what governments recognise. The indicators chosen shape the answer.

Examiner’s note: evaluation of the relative certainty of the evidence, built into the argument, as the 13–16 band asks.

Cultural flows also run in several directions. South Korea’s cultural exports exceeded its cultural imports for the first time in 2008, and Hallyu has reached world audiences through BTS, the Oscar-winning film Parasite (2019) and Squid Game; India produced 1,986 feature films in 2017, more than any other country. Global firms often adapt to local culture rather than replace it, which is glocalisation: McDonald’s has sold no beef in India since it opened there in 1996, offering the chicken Maharaja Mac instead. Migration produces new forms that belong fully to neither culture, cultural hybridity: descendants of Indian indentured labourers in Trinidad created chutney music from Bhojpuri folk songs and calypso, and Punjabi migrants in Britain created modern Bhangra.

Diaspora flows can strengthen identities rather than weaken them. Ghana’s Year of Return in 2019 invited people of African descent to visit 400 years after the first enslaved Africans were recorded in Virginia; international arrivals rose by 18%, and spending per tourist rose from US$1,862 in 2017 to US$2,589. Here a global flow, tourism by a diaspora, reinforced a cultural identity.

Examiner’s note: synthesis: reverse flows and hybridity (5.2), migration and diasporas (4.2) and diaspora tourism (Option E) are each linked to the statement with evidence.

Global interactions also provoke resistance, often led by governments. France argued for a “cultural exception” in world trade negotiations in 1993, subsidises French cinema and requires radio stations to play 40% French-language songs. Wales and New Zealand have used schools, broadcasting and official status to revitalise Welsh and te reo Māori, which has stopped both languages disappearing, although English remains essential for work and the internet in both countries.

The answer also depends on scale and perspective. At the local scale many places have become more diverse: Leicester’s White population fell from 97.8% in 1961 to 40.9% in 2021, and the city’s diversity index rose from 0.43 to 0.64 between 1991 and 2021. At the global scale, language loss suggests narrowing. To a global corporation, a world of similar consumers is a market; to an Indigenous community, the same trend can threaten a language; to a young person in a city, global music and local tradition may sit side by side without conflict.

Global interactions are making some aspects of culture, above all consumer goods, media habits and the languages of business, more alike. They are also creating hybrid cultures, reverse flows from Asia and Africa and renewed identities, and they provoke resistance. The statement is therefore true only to a limited extent: cultures are becoming more connected rather than more uniform, places are becoming more diverse within themselves even as some differences between them fade, and the evidence most often cited for homogenisation measures the spread of particular brands more than the convergence of beliefs and values.

Markband: 13–16. The answer defines its terms, synthesises at least four themes from different parts of the course (5.2 diversity and hybridity, 4.1 globalisation indices, 4.2 diasporas, 4.3 the shrinking world, Option E), evaluates the certainty of the KOF and language evidence, compares the perspectives of different groups and scales, and reaches a clear, evidenced opinion. Without the evaluation of the evidence and the paragraph on scale and perspectives it would reach 9–12.

Exam tip

Statements about culture invite general writing (“everyone eats the same food now”). Ground every claim in a named example with a date or figure, exactly as in a statement about trade or power: a place, a year and a number turn an opinion about culture into evidence.

Unit 6, Global risks and resilience

Worked example

(a) Analyse how dependence on global flows of energy and food exposes places to geopolitical and economic risks. [12]

Show the plan, model answer and markband note

Plan. Define dependence, geopolitical and economic risk → mechanism 1: supplier power (Russia and EU gas; Ukraine’s grain and the Black Sea) → mechanism 2: chokepoints (the Red Sea since 2023; Hormuz 2026) → mechanism 3: shocks spreading to other flows (fertiliser, food, freight costs) → contexts: importers, exporters, transit states, shipping firms → conclusion.

Model answer.

A place depends on global flows of energy or food when it imports a large share of what it uses, or relies on exporting it. Geopolitical risk is the possibility that political decisions or conflict, between states or involving armed groups, disrupt those flows; economic risk is the resulting change in prices, output and incomes. Dependence creates these risks through three mechanisms: the power of suppliers, the vulnerability of routes, and the spread of shocks into other parts of the economy.

The first mechanism is supplier power. In 2021 the European Union imported 155 billion cubic metres of gas from Russia, about 45% of its gas imports. After Russia’s full-scale invasion of Ukraine in February 2022, Russia cut supplies, starting with Poland and Bulgaria in April when they refused to pay in roubles, and reduced Nord Stream 1 to 40% of its capacity in June.

Food flows show the same mechanism. Ukraine had exported more than 45 million tonnes of grain a year, mostly through its Black Sea ports; the invasion halted shipments, about 20 million tonnes were held up in Odesa alone, and world food prices rose, threatening import-dependent countries such as Egypt. The Black Sea Grain Initiative, brokered by Türkiye and the UN in July 2022, carried nearly 33 million tonnes before Russia let it expire on 17 July 2023, so supply depended on the decisions of a party to the war.

Examiner’s note: the mechanism (dependence on one supplier or route) is explained before the evidence, and the evidence covers several contexts: a supplier, importers in Europe and the Middle East, and a third country acting as broker.

The second mechanism is the vulnerability of routes. From late 2023, attacks on merchant ships by the Houthi movement in Yemen led most large container lines to avoid the Bab-el-Mandeb Strait and the Suez Canal: transits through the strait fell from about 77 ships a day in November 2023 to about 33 in March 2024, and diverting round the Cape of Good Hope added about ten days and about US$1 million of fuel to a round voyage between Asia and northern Europe.

The Strait of Hormuz showed the same risk for energy in 2026. Before 2026, about 20% of the world’s liquefied natural gas trade and 25% of its seaborne oil trade passed through it. After the USA and Israel began air strikes on Iran on 28 February 2026, Iran warned ships that they could not pass; QatarEnergy stopped gas production on 2 March and declared force majeure on 4 March. Qatar’s gas, which cannot be piped around the strait, had no other way out, so the exporter was exposed as much as the importers.

The third mechanism is the spread of shocks through other flows. The 2026 disruption also cut supplies of helium and fertiliser from the Gulf, raising food production costs far from the region, so an energy shock became a risk to food security. Longer voyages round Africa raised costs for shipping firms and delivery times for importers far from the Red Sea. Places respond by diversifying: the EU replaced most Russian pipeline gas with LNG from the USA, Qatar and others and has agreed to phase out Russian LNG imports by the start of 2027, while the UAE’s Habshan–Fujairah pipeline, opened in 2012, carries up to about 2 million barrels of oil a day to a terminal outside Hormuz.

Dependence on global flows of energy and food therefore exposes places to risk through the power it gives suppliers and parties to a conflict, the fragility of routes through chokepoints, and the transmission of shocks to prices and to other resources. The risks fall on importers, exporters and shipping firms alike, which is why all of them seek to diversify suppliers, routes and sources of energy security.

Markband: 10–12. Three mechanisms are analysed with detailed, dated evidence, across a range of contexts and outcomes (importers, exporters, a broker state and shipping firms; energy, food and freight); the key terms are defined and held in focus; paragraphs are linked; the conclusion summarises and links back. No evaluation is required.

Part (b) on Unit 6 asks for a balance of risks and benefits, which makes synthesis with the core especially useful.

Worked example

(b) “The environmental risks of global interactions outweigh their benefits.” Discuss this statement. [16]

Show the plan, model answer and markband note

Plan. Define environmental risks and benefits of global interactions → risks: transboundary pollution (the 2015 haze, 6.2); pollution havens (Hazaribagh, shipbreaking, 6.2); waste flows (National Sword, 3.2) and plastic (brand audits, 6.3); emissions displaced through trade (2.3) → benefits: diffusion of clean technology (solar, Bangladesh electricity, 3.3); China’s clean-up (6.2); global agreements (Montreal Protocol, 3.3; Hong Kong Convention, 6.2) → perspectives and certainty → judgment.

Model answer.

Global interactions affect the environment in two directions. They create risks, by moving pollution, waste and emissions between places and by raising consumption, and they create benefits, by spreading clean technologies and making shared environmental rules possible. The statement is true for some flows and places, especially for the poorest communities that receive pollution and waste, but at the global scale the benefits of technology transfer and cooperation are large enough to balance it.

The clearest risks arise where global demand meets weak regulation. In 2015, fires lit to clear drained peatland for oil palm and pulpwood plantations in Sumatra and Kalimantan, whose products are sold worldwide, spread smoke across Indonesia, Singapore and Malaysia. A World Bank analysis put Indonesia’s losses at US$16.1 billion, about 1.9% of its GDP, and about 2.6 million hectares burned. This transboundary pollution crossed borders that the receiving states could not police: Singapore’s Transboundary Haze Pollution Act has been hard to enforce against companies whose land and records lie in Indonesia.

Global production also moves environmental costs to places with weaker rules, as the pollution haven hypothesis proposes. In the Hazaribagh district of Dhaka, about 150 tanneries, none with an effluent treatment plant, released about 21,600 m³ of untreated effluent a day into the river system while exporting about 80% of their leather. Waste follows the same path: when China had banned 24 categories of solid waste under National Sword by 1 January 2018, exporters diverted plastic to Malaysia, Vietnam, Indonesia, Türkiye and India. Brand audits by the Break Free From Plastic coalition in 84 countries found that five companies made 24% of the branded plastic items counted, which links plastic pollution in poorer places to TNCs at the top of global supply chains.

Trade also moves emissions. The Netherlands emitted 6.3 t of CO₂ per person on its own territory in 2024, but about 8.3 t per person in 2023 once the emissions embedded in imported goods are counted. Consumption-based emissions show that global trade lets wealthy importers appear cleaner than they are, while the risk of a warming climate is shared by all.

Examiner’s note: synthesis: transboundary pollution and pollution havens (6.2), waste flows (Unit 3), civil society evidence (6.3) and emissions accounting (Unit 2), each explained and tied to the statement.

Against the statement, global interactions spread the technologies and rules that reduce environmental harm. China’s solar capacity passed 1,000 GW in May 2025, and Bangladesh raised the share of its population with electricity from 32% in 2000 to 99.5% in 2023, partly through millions of solar home systems in rural areas. The Montreal Protocol of 1987 phased out ozone-depleting chemicals worldwide, and the IMO’s Hong Kong Convention on ship recycling entered into force in June 2025. Pollution havens can also be temporary: China declared a “war on pollution” in 2014, and its population-weighted exposure to PM2.5 fell from 51.75 µg m⁻³ in 2013 to 31.99 µg m⁻³ in 2023 as rising incomes raised public demands for clean air.

The balance depends on perspective and scale. For a tannery worker in Hazaribagh or a family breathing haze in Riau, the risks are immediate and the benefits remote; for a rural household in Bangladesh, global trade brought light and power. Governments of exporting countries see manufacturing as development; environmental groups see displaced pollution.

The evidence is uncertain on both sides. A modelling study estimated more than 100,000 extra deaths from the 2015 haze, a figure the governments of Indonesia, Singapore and Malaysia rejected; the evidence for pollution havens is mixed, because wages and market access usually matter more than environmental rules in where industry locates; and half the items in the brand audits carried no brand at all. Some benefits are still potential: talks on a global plastics treaty collapsed in Geneva in August 2025.

Examiner’s note: perspectives of named groups and a comment on the certainty of evidence for both sides; the opinion that follows is explicitly linked to them.

The environmental risks of global interactions outweigh their benefits for particular places and groups, above all poorer communities that receive smoke, effluent and waste with little power to refuse them. At the global scale, the spread of cheap clean technology, the record of agreements such as the Montreal Protocol and China’s clean-up show that global interactions are also a main route to reducing environmental harm. The statement is therefore only partly true: whether risks or benefits dominate depends on how fairly global interactions are governed, which is a question of equity and power more than of technology.

Markband: 13–16. The answer addresses both sides of the statement with detailed evidence, synthesises themes from Units 6, 3 and 2 (transboundary pollution, pollution havens, waste flows, civil society, emissions accounting, clean technology), evaluates the certainty of evidence on both sides (the disputed haze death toll, the mixed evidence for pollution havens, unbranded plastic), compares the perspectives of named groups and scales, and gives an opinion explicitly linked to the evidence. A version that listed environmental problems caused by globalisation, without the benefits, would be one-sided and stay at 9–12 at best.

What the six answers share

Part (a) answers

Part (b) answers

Opening

The key term defined; the mechanisms named

The statement’s terms defined; a line of argument stating how far it holds

Body

Three or four mechanisms, each explained with located evidence, across several contexts

Arguments on both sides, each from a different theme or unit, with located evidence

Evaluation

Not needed

Perspectives of named groups and scales; the certainty of the evidence

Conclusion

Summarises the analysis and links back to the question

An opinion on the statement, at the extent asked, tied to the evidence

Tip

Keep a “synthesis bank” of ten or twelve facts that serve many part (b) statements: one each on superpowers, global institutions, supply chains, migration and remittances, cultural diffusion, resistance, geopolitical risk, transboundary pollution and resilience, each with a place, a date and a figure. The same fact can support statements on power, culture or risk.

Add to your notes: a one-page Paper 3 plan for each HL unit: the four or five likeliest part (a) mechanisms with an example each, and a synthesis web for one likely part (b) statement, with at least three spokes to other units, the core or your options, and one note on the certainty of each piece of evidence.

Common mistake

Writing part (a) as a balanced essay with an evaluative conclusion. It uses time that part (b) needs and earns nothing extra, because part (a) is marked without synthesis or evaluation. Analyse fully, conclude briefly, and move on.

Steps for Paper 3

  • To do:

    Read all three questions, both parts, and choose the one whose part (b) you can argue with the widest evidence.

  • To do:

    For part (a), define the key term, plan three or four mechanisms with located evidence, and cover several contexts or outcomes.

  • To do:

    Finish part (a) about 25 minutes into the hour, keeping every paragraph on the key term and linking each to the next.

  • To do:

    Plan part (b) for five minutes: define the statement’s terms, list at least three themes from different units, and decide your opinion.

  • To do:

    In part (b), give evidence on both sides, name the perspectives behind each argument, and comment on how certain the evidence is.

  • To do:

    End part (b) with an opinion at the extent asked, explicitly linked to the evidence, and leave two minutes to check.

Keep your place

In Augment the notes remember where you stopped and which pages you have finished.

Open in Augment

More IB Geography notes

  • Paper 2: the coreThe page before this.
  • Geographic skills: maps, graphs and dataThe next page.
  • Geography assessmentEach Geography paper, the internal assessment and grade boundaries.
  • IB GeographyThe Geography syllabus, how it is assessed and every notes page.

Carry on with Geography in Augment

With a free account, Augment remembers where you stopped in the notes and which questions you have marked.

Start free