Augment Education
    • Question bank
    • Quick fire
    • Worksheets
    • Flashcards
    • Notes
    • Try a quick-fire round
    • All features
    • Business
    • Digital Society
    • Economics
    • Geography
    • Global Politics
    • History
    • Philosophy
    • Psychology
    • Anthropology
    • World Religions
    • Biology
    • Chemistry
    • Physics
    • Computer Science
    • Design Technology
    • ESS
    • SEHS
    • Language and literature
    • Language acquisition
    • Maths AA
    • Maths AI
    • Dance
    • Film
    • Music
    • Theatre
    • Visual Arts
    • Grade calculator
    • Grade boundaries
    • Subject checker
    • Focus timer
    • Exam countdown
    • All free tools
    • IB guide
    • All subjects
  • Blog

Search

Search subjects, the syllabus, glossary terms, the booklets, the IB guide, help and the blog

Log inStart free
augment

Augment Education

IB Diploma revision built around the syllabus.

contact@augment-education.com

Product

  • Features
  • Question bank
  • Quick fire
  • Worksheets
  • Flashcards
  • Notes
  • Subjects
  • What's new

Learn

  • IB guide
  • Booklets, explained
  • Glossary
  • Blog
  • Free tools
  • Grade calculator
  • Subject checker

Company

  • About
  • Help
  • For parents
  • For teachers
  • Comparisons

Subjects

  • English A Lit
  • English A Lang & Lit
  • Chinese A Lit
  • Chinese A Lang & Lit
  • Spanish A Lit
  • Spanish A Lang & Lit
  • English Lit & Perf
  • Spanish Lit & Perf
  • English B
  • Mandarin B
  • Spanish B
  • English ab initio
  • Mandarin ab initio
  • Spanish ab initio
  • Business
  • Digital Society
  • Economics
  • Geography
  • Global Politics
  • History
  • Philosophy
  • Psychology
  • Anthropology
  • World Religions
  • Biology
  • Chemistry
  • Physics
  • Computer Science
  • Design Technology
  • ESS
  • SEHS
  • Maths AA
  • Maths AI
  • Dance
  • Film
  • Music
  • Theatre
  • Visual Arts

Augment Education is developed independently of the International Baccalaureate Organization and is not endorsed by it. “IB” and “International Baccalaureate” are its trademarks.

© 2026 Augment Education. All rights reserved.

  • Privacy
  • Terms
  1. Subjects
  2. Geography
  3. Paper 2: the core

Paper 2: the core

Answer Section A structured questions concisely, read and evaluate a Section B infographic, and write a Section C essay that synthesises the core units, with worked questions and a full model answer.

  • IB Geography
  • Exam skills
  • SL and HL

28 min readLast reviewed 18 Oct 2026

Paper 2 examines the core, Geographic perspectives — global change: changing population, global climate, and global resource consumption and security. It is the same paper, with the same questions, at SL and HL. Every student answers all of Sections A and B and one essay from Section C, so there is no choice of topic until the very end.

The paper moves from short, stimulus-based questions to a single extended argument. Section A has three structured questions, one on each core unit. Section B is built on an infographic or another visual stimulus. Section C asks for one extended response from a choice of two, marked with the same 10-mark markband as Paper 1, but rewarding synthesis across the whole core.

How Paper 2 is set out

Section

What it contains

Main skills

A

Three structured questions of 10 marks each, one per core unit, each on its own stimulus

Describing patterns with figures; suggesting and explaining with concise, developed points

B

One infographic or visual stimulus with structured questions worth 10 marks, ending in a 6-mark evaluation

Reading a complex visual; using its evidence on both sides of a view; judging the evidence

C

One extended answer from two titles, 10 marks

Argument, synthesis across the core, evaluation and a justified conclusion

Paper 2 gives less time per mark than the other papers, about a minute and a half. The structured parts therefore need short, exact answers, so that enough time is left for the essay, which is worth as many marks as one whole Section A question.
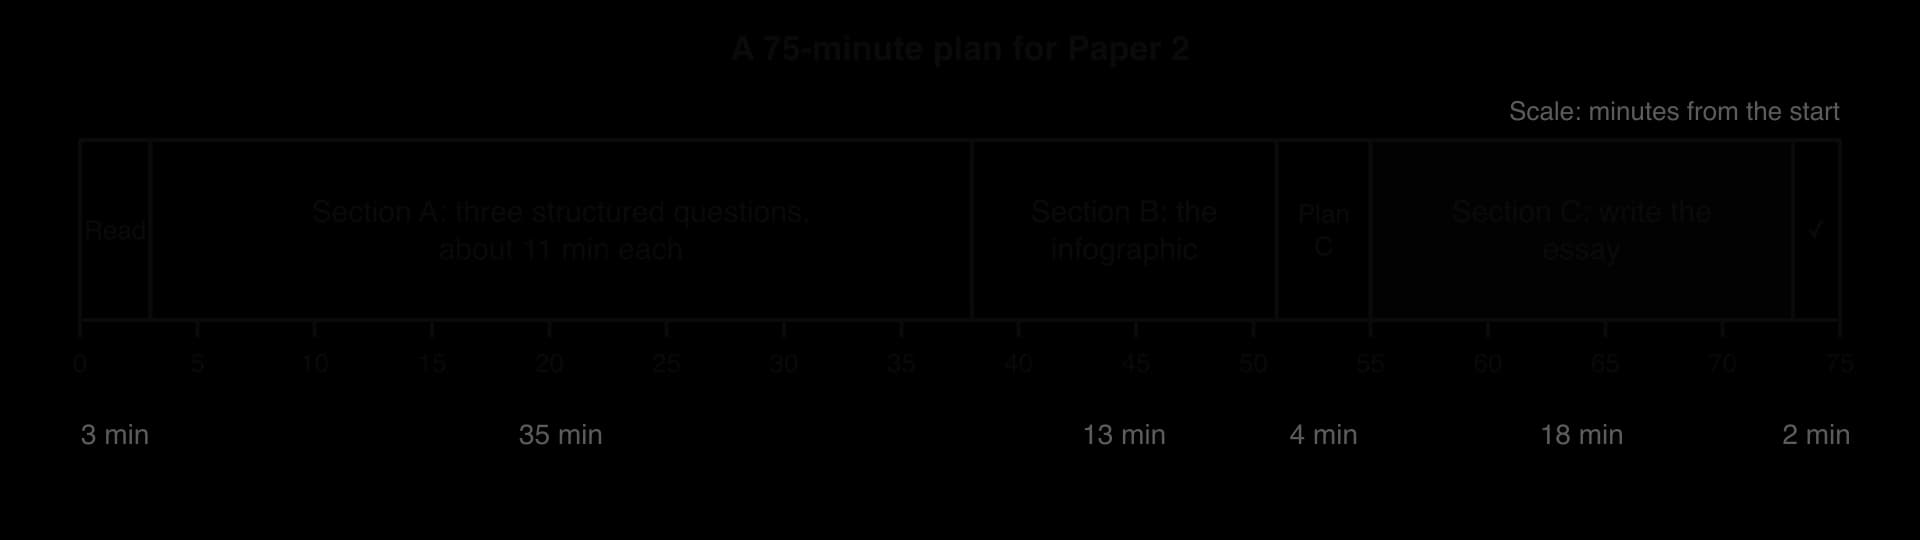
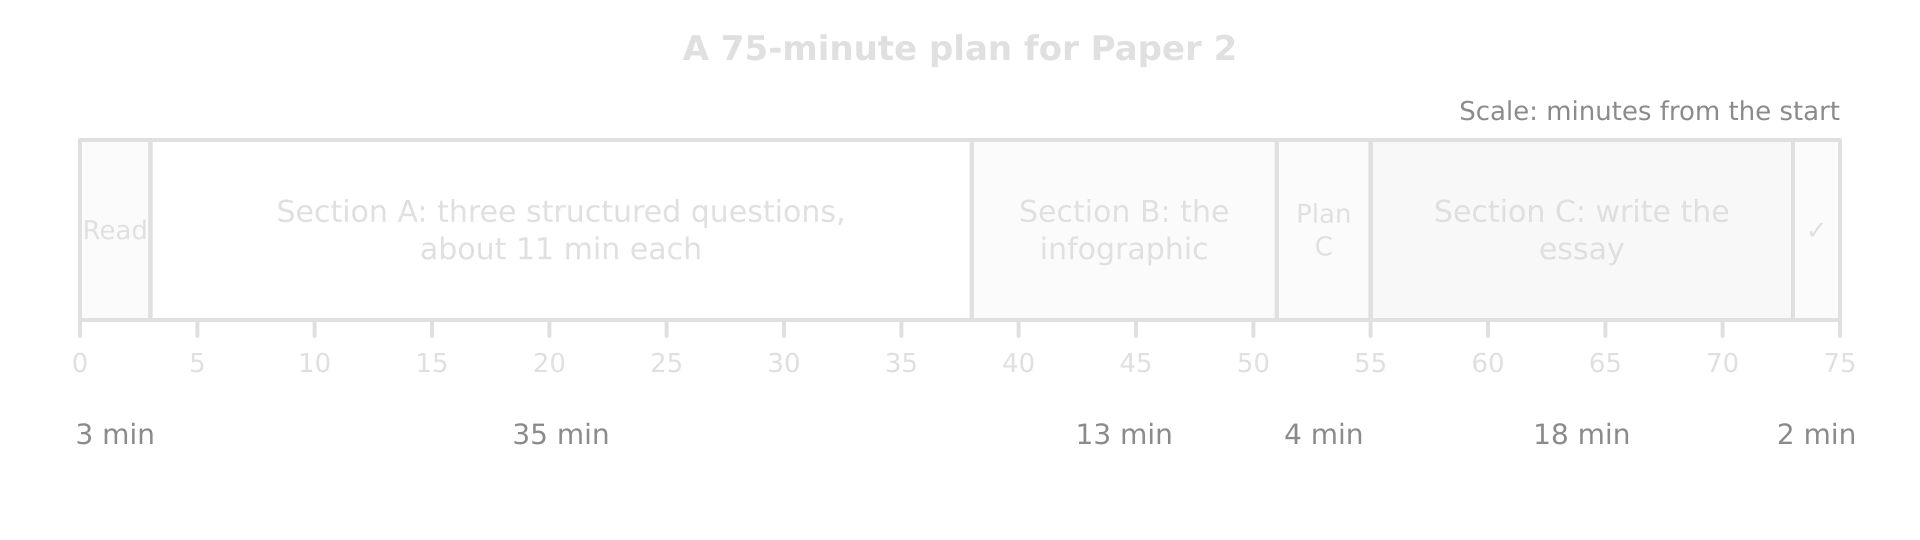
Timeline of 75 minutes for Paper 2: read 3, Section A 35, Section B 13, plan Section C 4, write Section C 18, check 2 minutes.Timeline of 75 minutes for Paper 2: read 3, Section A 35, Section B 13, plan Section C 4, write Section C 18, check 2 minutes.
Section A takes almost half the time; keeping each of its three questions to about 11 minutes protects the 13 minutes for the infographic and over 20 for the essay.

Exam tip

Read both Section C titles at the very start. Deciding early lets you collect evidence in your head while answering Sections A and B, and some Section A stimuli may remind you of examples you can use in the essay.

Section A: structured questions on the core

Each Section A question follows a similar shape, although the exact wording varies. The important difference from Paper 1 is the size of each development: in a [2+2] part each reason is worth one mark and its development only one more, so every point must be short and exact.

Part

Marks

Typical command

How it is marked

(a)

[2]

Describe the pattern, trend or relationship shown…

[1] per valid point, maximum [2]; figures from the stimulus needed for full marks

(b)

[2+2]

Suggest two reasons or ways…

For each: [1] for the reason, [1] for its development or a supporting example

(c)

[2+2]

Explain two ways or reasons…

For each: [1] for the way, [1] for the explanation that links it to the question

Describing patterns, trends and relationships

Part (a) usually asks for a description of something in the stimulus: a pattern on a map, a trend on a graph, or a relationship between two variables on a scatter graph. The markscheme rewards accurate, quantified points, so a strong answer has a fixed shape.

  • Pattern on a map: where the highest and lowest values are (regions, continents), with values from the key, and one exception.

  • Trend on a graph: the direction, the start and end values with dates, the rate or size of the change, and any fluctuation or turning point.

  • Relationship on a scatter graph: positive or negative, strong or weak, with two plotted points quoted as evidence, and an anomaly.

Tip

The acronym TEA, for Trend, Evidence, Anomaly, covers the three things a description of a stimulus needs. Two marks rarely need all three, but having all three in mind prevents an unquantified answer.

A full Section A question on Unit 1

The table is the stimulus for a Unit 1 question. It shows the total fertility rate (TFR) and the share of the population aged 65 and over in eight countries (hypothetical data).

Country

P

Q

R

S

T

U

V

W

Total fertility rate (children per woman)

6.1

4.5

3.2

2.4

1.8

1.6

1.4

1.2

Population aged 65 and over (%)

2.6

3.4

5.1

7.8

16.5

21.0

2.0

29.0

Worked example

(a) Describe the relationship between the total fertility rate and the share of the population aged 65 and over shown in the table. [2]

(b) Suggest two reasons why country V has a very small share of people aged 65 and over, despite its low fertility rate. [2+2]

(c) Explain two ways in which an ageing population can create challenges for a country. [2+2]

Show the markscheme and model answers

(a) There is a negative relationship: as fertility falls, the share aged 65 and over rises, from 2.6% in country P (TFR 6.1) to 29.0% in country W (TFR 1.2) ✓. Country V is an anomaly, with a low TFR of 1.4 but only 2.0% of its people aged 65 and over ✓.

(b) Reason 1: V may receive large numbers of young adult migrant workers ✓, who swell the working-age population and so reduce the share of older people, as in the Gulf states ✓.

Reason 2: V’s fertility may have fallen only recently ✓, so the large generations born when fertility was high are still of working age and have not yet reached 65 ✓.

Other creditable suggestions: low life expectancy, so fewer people survive to 65; emigration of older people, or return migration of retired migrants to their home countries. A suggestion that applies to every country with low fertility, such as “people have fewer children”, does not explain why V differs and earns nothing.

(c) Way 1: rising pension costs ✓: as the share of people over 65 grows, fewer workers pay the taxes that fund each pensioner, so governments must raise taxes, cut benefits or raise the retirement age ✓.

Way 2: greater demand for health and social care ✓: older people need more medical treatment and long-term care, so spending on health rises while the labour force that provides care shrinks ✓.

In (a) the answer names the direction of the relationship, supports it with two pairs of figures and identifies the anomaly. In (b) both suggestions are about V specifically, and each comes from a different part of the population equation, migration and the timing of fertility decline.

Common mistake

Explaining the relationship in part (a). “Ageing happens because people have fewer children and live longer” is an explanation, so it earns nothing in a “Describe” part however true it is. Save the reasons for the part that asks for them.

A full Section A question on Unit 2

The table is the stimulus for a Unit 2 question. It shows the average number of days a year with a maximum temperature above 35 °C in a large city (hypothetical data).

Period

1991–2000

2001–2010

2011–2020

2021–2025

Days a year above 35 °C (average)

4

7

12

19

Worked example

(a) Describe the trend in the number of very hot days shown in the table. [2]

(b) Suggest two reasons why deaths during heatwaves are higher among older people. [2+2]

(c) Explain two ways in which cities can reduce the impacts of more frequent heatwaves. [2+2]

Show the markscheme and model answers

(a) The number of days above 35 °C rose in every period, from an average of 4 a year in 1991–2000 to 19 a year in 2021–2025, almost five times as many ✓. The increase accelerated: it rose by 3 days between the first two decades but by 7 days between 2011–2020 and 2021–2025 ✓.

(b) Reason 1: the body’s ability to regulate its temperature declines with age ✓, so older people overheat and dehydrate more quickly, especially if they have heart or lung conditions ✓.

Reason 2: many older people live alone or have limited mobility ✓, so they may not reach cooler places or get help in time, as in Europe’s hot summers of 2022–2024, when heat-related deaths numbered tens of thousands each year ✓.

(c) Way 1: a heat action plan with early warnings ✓: colour-coded alerts, cooling centres and changes to working hours protect the most exposed people during the hottest days, as in Ahmedabad, India, which launched South Asia’s first plan in 2013 ✓.

Way 2: cool roofs and more green space ✓: reflective surfaces raise albedo and trees and parks provide shade and evaporative cooling, so less heat is stored in the city and the urban heat island is weaker ✓.

The description in (a) earns its second mark by manipulating the data (the almost fivefold rise and the accelerating rate), not by repeating the values. In (c) one way protects people (adaptation of behaviour) and one changes the city itself (adaptation of the built environment), which keeps the two ways clearly separate.

Exam tip

In Section A, if a part asks for two ways, choose them from different categories: short-term and long-term, people and infrastructure, government and individual. Two different categories make it obvious to the examiner that the second way is not a repeat of the first.

A full Section A question on Unit 3

The table is the stimulus for a Unit 3 question. It shows gross national income (GNI) per capita and ecological footprint per person for eight countries (hypothetical data).

Country

A

B

C

D

E

F

G

H

GNI per capita (US$ thousand)

1.2

2.5

4.8

9.5

14

28

45

60

Ecological footprint (global hectares per person)

1.1

1.4

2.0

2.9

3.6

4.8

7.9

5.2

Worked example

(a) Describe the relationship between GNI per capita and ecological footprint shown in the table. [2]

(b) Suggest two reasons why country H has a smaller ecological footprint than country G, despite its higher GNI per capita. [2+2]

(c) Explain two ways in which a circular economy can reduce a country’s ecological footprint. [2+2]

Show the markscheme and model answers

(a) There is a positive relationship: the footprint rises with income, from 1.1 gha per person in country A (US$1,200) to 7.9 gha in country G (US$45,000) ✓. Country H is an anomaly: it has the highest GNI per capita (US$60,000) but a footprint of 5.2 gha, lower than G’s ✓.

(b) Reason 1: H may generate most of its electricity from renewable or nuclear sources ✓, so its carbon footprint, the largest part of the ecological footprint in high-income countries, is smaller ✓.

Reason 2: H may have dense cities with good public transport ✓, so fewer journeys are made by car and less fuel is burned per person ✓.

Other creditable suggestions: a smaller share of meat in diets; a service-based economy with little heavy industry; strict building standards for insulation; a cooler or milder climate needing less air conditioning.

(c) Way 1: reusing waste materials as inputs ✓, as in the Kalundborg industrial symbiosis in Denmark, where one firm’s waste heat, steam and by-products become another’s raw materials, reducing the land and energy needed to supply new resources ✓.

Way 2: designing products to last and be repaired ✓, so fewer new goods are made and less carbon dioxide has to be absorbed, the component that makes up most of a high-income country’s footprint ✓.

The model answer to (a) uses three figures in two sentences and names the anomaly; it does not explain the relationship, because “Describe” does not ask why. In (b) each reason is linked to country H, as the question requires; a reason that applied to every country would not answer “why H has a smaller footprint than G”.

Common mistake

Spending three or four sentences on each point in a [2+2] part. Each reason earns one mark and its development one more, so a single sentence with “so” or “because” in the middle is enough. Extra writing in Section A costs time that the essay needs.

More Section A practice

The table gives further questions in the Section A shape, one set per unit, with the points a full-mark answer would make. Write the answers in timed conditions, about 4 minutes per [2+2] part, before checking the points.

Unit and question

Points that would earn the marks

Unit 1 (b) Suggest two reasons why some governments have introduced pro-natalist policies. [2+2]

Fertility below the replacement level of about 2.1 ✓ → a shrinking workforce and tax base ✓; an ageing population ✓ → rising pension and care costs ✓; national security or identity concerns about a falling population

Unit 1 (c) Explain two ways in which forced migration can affect the areas that receive refugees. [2+2]

Pressure on services and land ✓ → crowded camps and schools, as in Chad receiving refugees from Sudan ✓; labour and skills ✓ → refugees can fill jobs and start businesses where they are allowed to work ✓

Unit 2 (b) Suggest two reasons why melting sea ice can create a positive feedback loop. [2+2]

Lower albedo ✓ → the dark ocean absorbs more solar radiation, warming the water and melting more ice ✓; open water releases heat to the air in autumn ✓ → the sea freezes later, so the ice is thinner and melts more easily the next summer ✓

Unit 2 (c) Explain two ways in which climate change may affect crop yields. [2+2]

Heat stress ✓ → temperatures above crops’ tolerance during flowering reduce grain yields ✓; changing rainfall ✓ → longer droughts or heavier floods damage crops where farming is rain-fed ✓

Unit 3 (b) Suggest two reasons why the demand for water is rising faster than population. [2+2]

Rising incomes ✓ → diets with more meat, which has a large water footprint ✓; urbanisation and industry ✓ → piped supplies, manufacturing and power stations use more water per person ✓

Unit 3 (c) Explain two ways in which recycling can improve resource security. [2+2]

Reduces demand for new raw materials ✓ → less dependence on imports or on a few supplying countries ✓; recovers scarce materials such as metals from electronics ✓ → secures supplies for manufacturing when prices or politics disrupt mining ✓

Tip

Make a deck of Section A cards: a stimulus type (choropleth, scatter graph, line graph, table) on one side and a likely (a), (b) and (c) on the other, one deck per unit. Practising the shape until it is automatic leaves more thinking time for the content.

Section A stimuli often use real data from agencies such as the UN, the World Bank or the IPCC. A question may ask you to describe what the data show, but the reliability of the source itself (how a figure was measured, what it leaves out) is the kind of judgment that earns credit in Sections B and C.

Section B: the infographic

Definition

Infographic: a visual summary of information that combines headline figures, charts, maps, icons and short text to communicate a message about an issue quickly.

Section B is built on one infographic or another visual stimulus, such as an annotated photograph. Infographics are designed to persuade as well as inform: they select some facts, leave out others, and use size, colour and wording to push the reader towards a view. The questions test both skills, reading the evidence and judging how far it supports a claim.

Part

Marks

Typical command

What it asks for

(a)(i), (a)(ii)

[1] each

State, identify

A value, a difference or a category read from the infographic

(b)

[2]

Suggest one way in which the infographic shows…

A point linked to the infographic [1] and its development [1]

(c)

[6]

To what extent does the evidence in the infographic support the view that…?

Evidence from the infographic on both sides, then an overall judgment

How to read an infographic

An infographic packs many separate pieces of evidence into one image, so it pays to read it in a fixed order before answering anything. Five steps take about two minutes and supply most of the evidence for part (c).
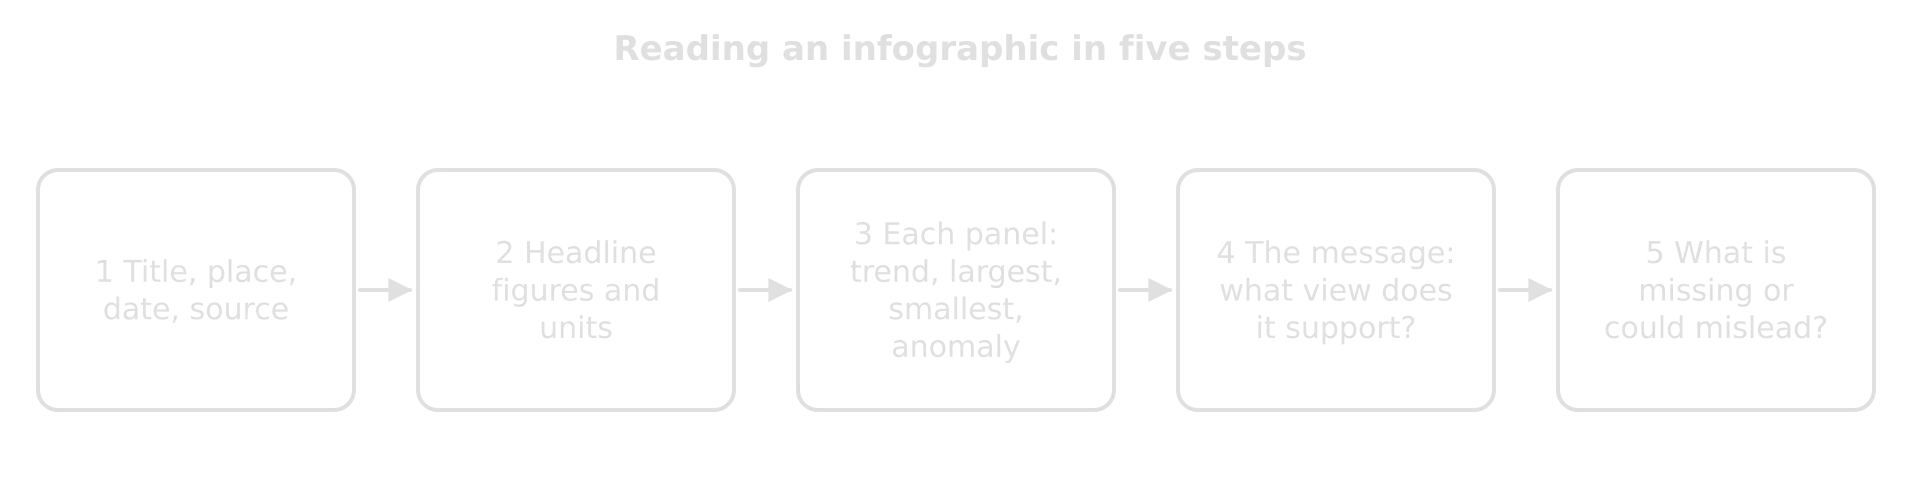
Five-step flow for reading an infographic: title, place, date and source; headline figures; each panel; the message; what is missing or misleading.Five-step flow for reading an infographic: title, place, date and source; headline figures; each panel; the message; what is missing or misleading.
Steps 1–3 gather the evidence; steps 4 and 5 judge it. Part (c) needs both, because its last mark goes to an overall appraisal of the infographic as evidence.

Step

Questions to ask

What to note

1 Title, place, date, source

What issue, where, when? Who made it, and why?

The scale (city, country, world) and any interest the producer may have

2 Headline figures

What are the largest, boldest numbers, and in what units?

Totals, per person values and percentages, kept separate

3 Each panel

What does each chart, map or quotation show?

The trend, the largest and smallest, any anomaly

4 The message

What view does the design push the reader towards?

Which panels support it, and which complicate it

5 What is missing

What would be needed to test the view? Could anything mislead?

Missing years or places, no source, a truncated axis, emotive images or a single quotation

Common mistake

Treating a quotation in an infographic as data. A single resident’s or volunteer’s view is evidence of one perspective, not of a trend. It can support a point, but a strong answer says what kind of evidence it is (“one volunteer’s observation, not a measurement”).

A worked infographic question

The infographic is the stimulus for a question on Unit 3, global resource consumption and security (hypothetical data).
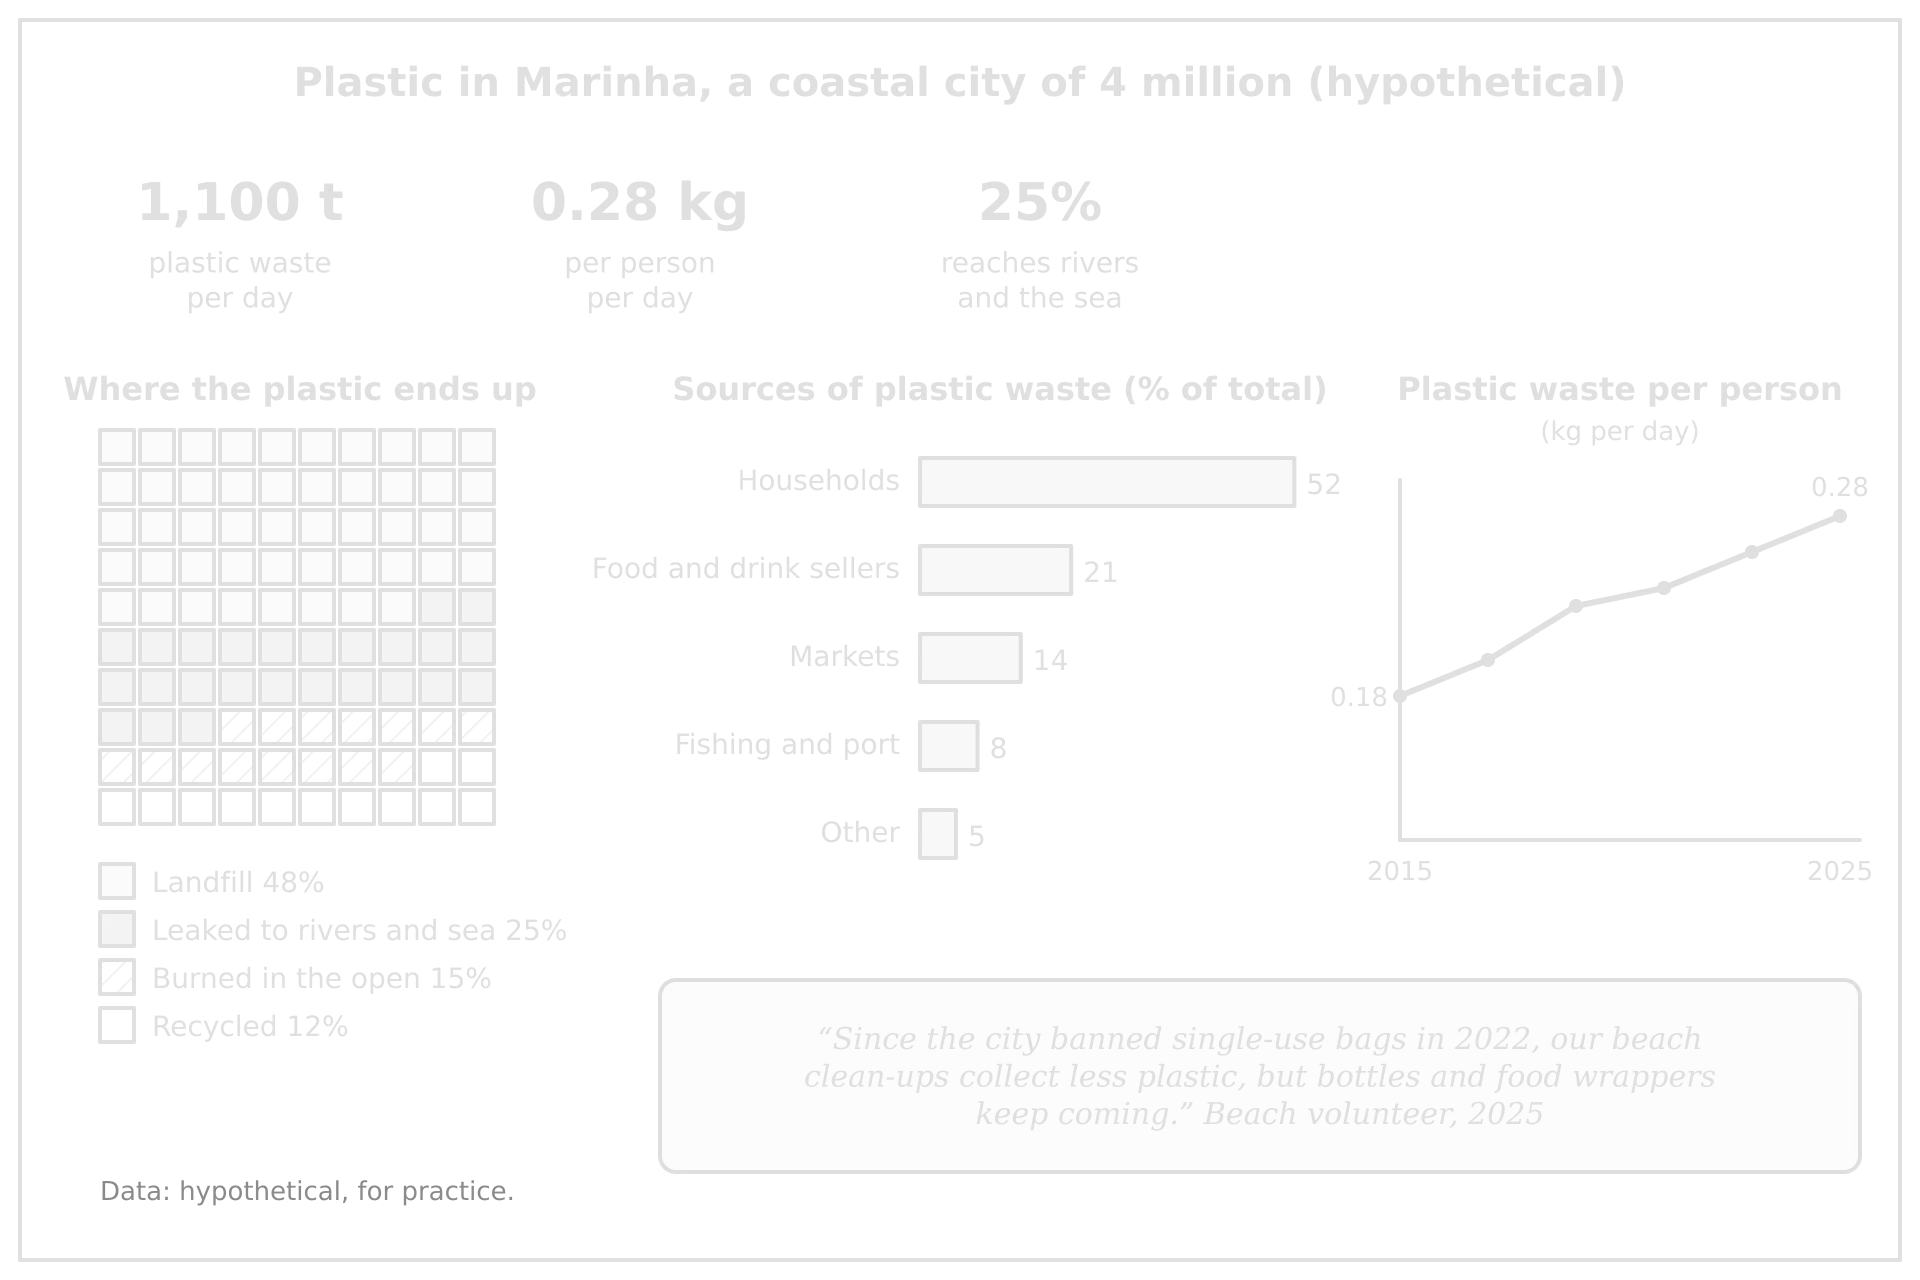
Hypothetical infographic of plastic in Marinha: 1,100 t a day, 0.28 kg per person, 25% reaches rivers and sea; landfill 48%, leaked 25%, burned 15%, recycled 12%; households 52% of sources; per person rising 0.18 to 0.28 kg 2015–2025.Hypothetical infographic of plastic in Marinha: 1,100 t a day, 0.28 kg per person, 25% reaches rivers and sea; landfill 48%, leaked 25%, burned 15%, recycled 12%; households 52% of sources; per person rising 0.18 to 0.28 kg 2015–2025.
A practice infographic: headline figures, a waffle chart of where plastic ends up, a bar chart of its sources, a ten-year trend and one quotation. Each panel offers evidence for a different side of an argument.

Worked example

(a)(i) State the percentage of Marinha’s plastic waste that is recycled. [1]

(a)(ii) State the change in plastic waste per person between 2015 and 2025. [1]

(b) Suggest one way in which the infographic shows that households should be the main target of policies to reduce plastic waste. [2]

Show the answers

(a)(i) 12% ✓.

(a)(ii) An increase of 0.10 kg per person per day, from 0.18 kg to 0.28 kg ✓ (or about 56%).

(b) Households produce 52% of the city’s plastic waste ✓, more than twice the next largest source (food and drink sellers, 21%), so a policy that changed household use, such as a deposit scheme for bottles, would act on the largest share of the waste ✓.

Part (c) is the most demanding part of Section B. It is marked with one mark for each valid point supported by evidence from the infographic, up to five; an answer that argues only one side is capped at four; and the final mark is for an overall appraisal that weighs up the infographic as a whole.

Worked example

(c) To what extent does the evidence in the infographic support the view that Marinha’s plastic problem is caused mainly by poor waste management rather than by rising consumption? [6]

Show the model answer and marking

Evidence for the view (poor management):

  • Only 12% of plastic waste is recycled, while 15% is burned in the open and 25% leaks into rivers and the sea, so 40% of the waste escapes any controlled system ✓.

  • Landfill takes 48% of the waste, so a controlled destination already exists for about half of it; the 25% that reaches rivers and the sea points to gaps in collection, which better management could close without any change in consumption ✓.

  • The volunteer reports that bottles and wrappers “keep coming” even after the 2022 bag ban, which suggests that collection, not only use, is the weak point ✓.

Evidence against the view (rising consumption):

  • Plastic waste per person rose from 0.18 kg to 0.28 kg a day between 2015 and 2025, an increase of about 56% in ten years ✓.

  • At 0.28 kg per person, a city of 4 million produces about 1,100 t of plastic a day, a volume that would strain any waste system ✓.

Appraisal: the evidence partly supports the view. The harm shown, plastic in rivers, the sea and open fires, results from management failures, but the rising trend per person shows that consumption is increasing the pressure on that system, so the two causes interact. The infographic cannot settle the question, because it gives the fates of plastic for one year only, says nothing about how much of the city has waste collection, and relies on one volunteer’s view ✓.

Five evidenced points across both sides earn five marks, and the appraisal, which weighs the evidence and comments on its limits, earns the sixth. Without the two points against the view, the answer would be capped at four.

Exam tip

In part (c), quote a figure from the infographic in every point and label which side each point supports. Points from your own knowledge are not credited unless the question asks for them: the question asks what the evidence in the infographic shows.

Tip

Some part (c) questions ask whether an infographic gives a “flawed” or “misleading” picture. The design matters as well as the data: a pictogram where a larger icon is used for a larger number exaggerates the difference by area; a bar chart whose axis does not start at zero makes small changes look large; a map without a key or date cannot be checked.

The same infographic can be used for a question about the representation itself, which asks how complete and trustworthy the evidence is rather than what it shows.

Worked example

(c) To what extent does the infographic give a complete and reliable picture of plastic waste in Marinha? [6]

Show the model answer and marking

Evidence that the picture is complete and reliable:

  • It shows the whole chain, from where plastic comes from (five sources adding up to 100%) to where it ends up (four destinations adding up to 100%), so no waste is unaccounted for ✓.

  • Its figures are consistent with each other: 4 million people producing 0.28 kg each is about 1,120 t a day, close to the headline 1,100 t ✓.

  • The line graph shows change over ten years, from 0.18 kg to 0.28 kg per person a day, so the picture is not a single snapshot ✓.

Evidence that it is incomplete or unreliable:

  • No source or method is given for any figure, and the line graph has no scale on its vertical axis, so the values between 2015 and 2025 cannot be read or checked ✓.

  • The destinations are shown for one year only, and nothing is said about how much of the city has waste collection or how much informal waste pickers recycle, so the 12% recycled may understate reality ✓.

  • The quotation is one volunteer’s view, chosen to support a message, not a measurement ✓.

Appraisal: the infographic gives a fairly complete picture of the scale and fate of the waste at one moment, but it is only partly reliable, because its figures have no stated source and it leaves out the collection system that would explain why so much plastic leaks ✓.

Six evidenced points are made, but a maximum of five can be credited for points; the appraisal earns the sixth mark. Each point is taken from the infographic itself, including the features of its design (the missing scale) as well as its data.

Section C: the extended answer

Section C offers a choice of two essay titles. They are often a quotation followed by “To what extent do you agree with this statement?”, and are marked with the same five-band, 10-mark markband as the Paper 1 essays. The difference lies in what the markscheme rewards for the 7–8 and 9–10 bands: either a well-evidenced synthesis that links several themes from across the core and addresses both sides of the statement, or a critical conclusion informed by concepts and perspectives; the top band needs both. Both routes depend on evaluation and a justified conclusion.

Definition

Synthesis: the skill of linking ideas, evidence and concepts from different parts of the course, or different places and scales, into one coherent argument.

Synthesis in Section C means drawing on more than one core unit. A question on climate change can be answered better with evidence on population (where people live, who migrates) and on resources (food, water, energy), because the core units describe one connected system. Linking them shows the conceptual understanding the top band asks for.
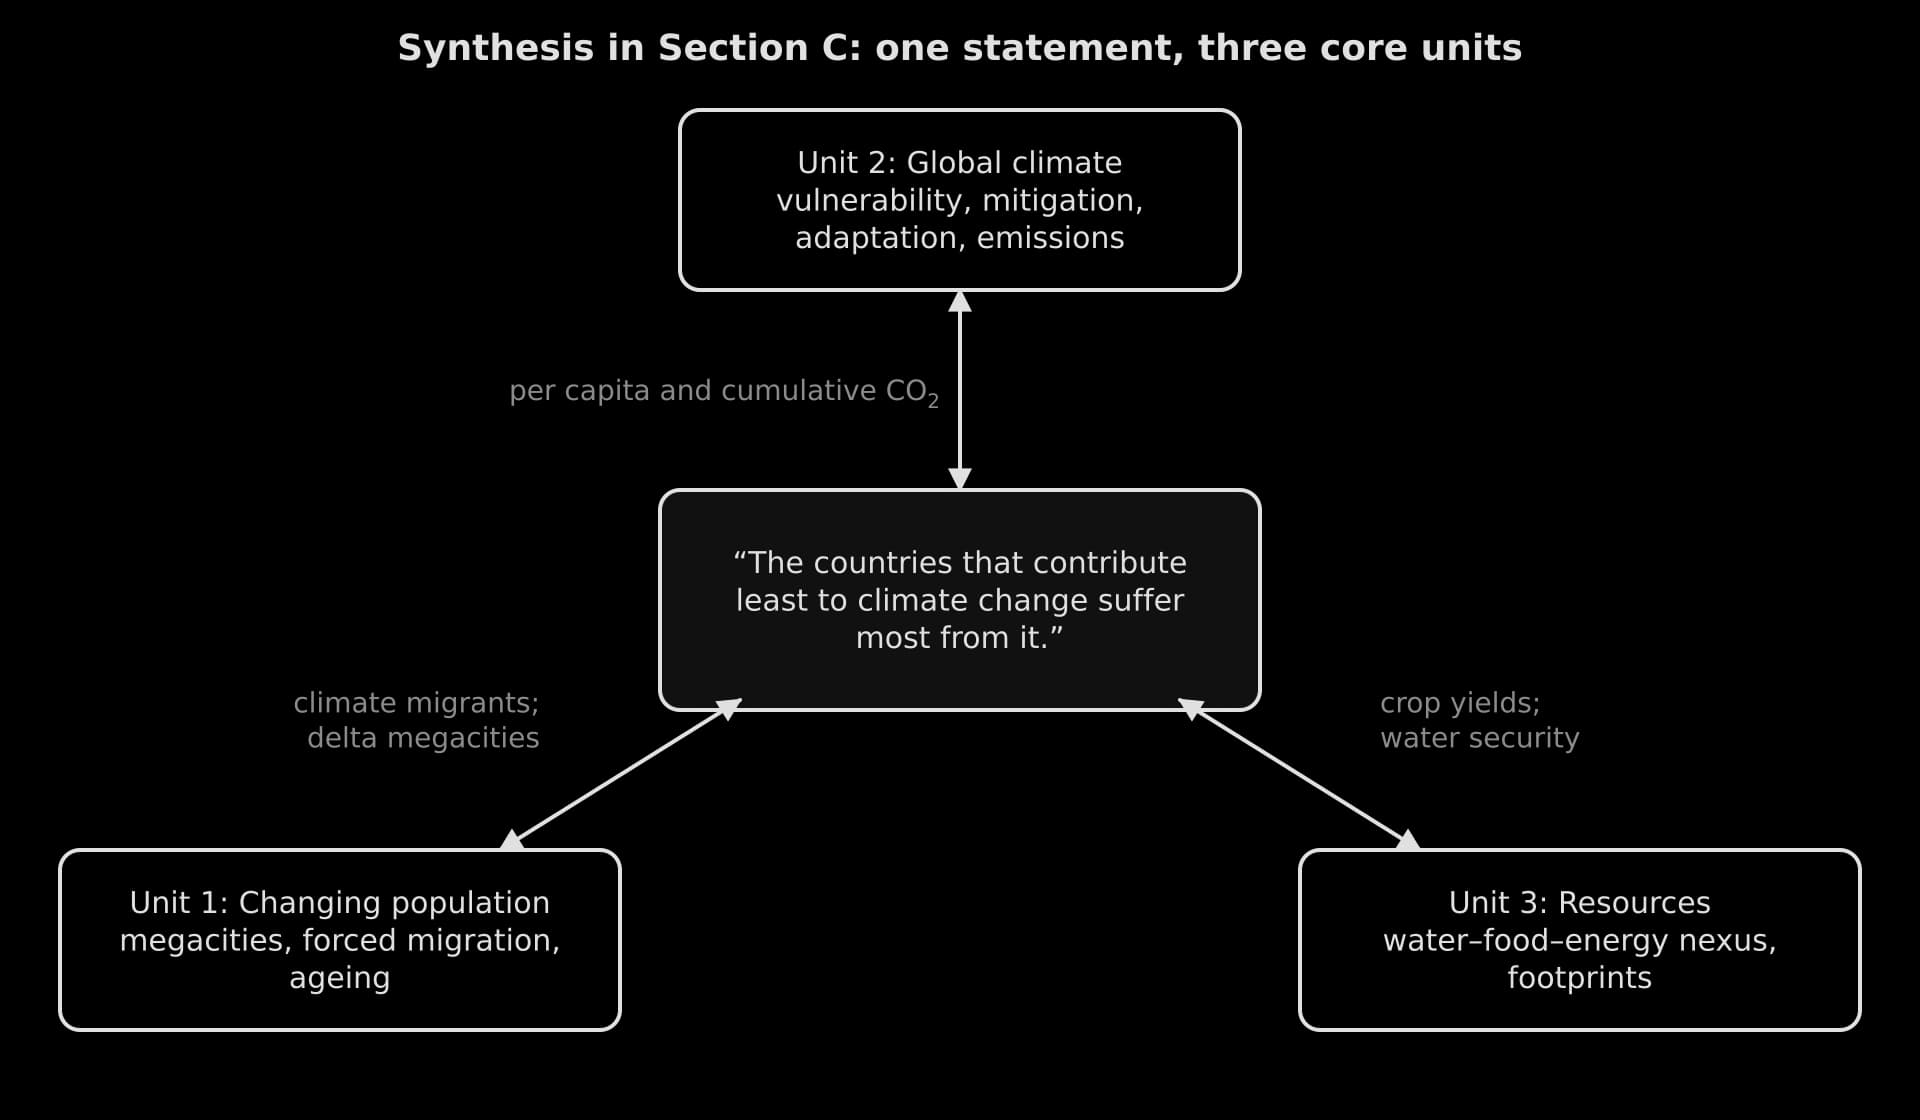
Triangle diagram: a Section C statement on climate change linked to Unit 1 population, Unit 2 climate and Unit 3 resources, with link themes such as cumulative emissions, climate migrants and crop yields.Triangle diagram: a Section C statement on climate change linked to Unit 1 population, Unit 2 climate and Unit 3 resources, with link themes such as cumulative emissions, climate migrants and crop yields.
A Section C statement usually belongs to one unit, but its strongest evidence comes from the links: emissions and responsibility from Unit 2, migration and megacities from Unit 1, food and water security from Unit 3.

Reading the statement

A quoted statement is a claim to be tested, often deliberately one-sided. Before planning, identify the key words that can be challenged, because defining them sets up the argument.

  • Absolute or comparative words (“most”, “always”, “the main”, “more than”): the claim may be true in part but not in full.

  • Vague groups (“countries”, “people”, “the poor”): are they countries, groups within countries, or individuals?

  • Measures (“contribute”, “suffer”, “benefit”): by what measure, at what scale, over what time?

Common mistake

Agreeing or disagreeing completely with the statement. A one-sided Section C essay, however well evidenced, reaches 7–8 at most. The highest marks go to answers that show where the claim holds, where it does not and why, and then state how far they agree.

A full model answer

Worked example

“The countries that contribute least to climate change suffer most from its consequences.” To what extent do you agree with this statement? [10]

Show the plan, model answer and markband note

Plan. Define contribution (per capita, total, cumulative) and suffering (deaths, losses, threat to existence) → for: Bangladesh, Tuvalu, Pakistan 2022 (Unit 2), linked to delta megacities and migration (Unit 1) and food security (Unit 3) → against: high-income countries also suffer (Europe’s heat deaths, Canada’s 2023 fires); suffering depends on vulnerability, not only on hazard (Netherlands vs Bangladesh) → within countries: the poorest suffer most everywhere → judgment: largely true at the national scale, more true still for people than for countries.

Model answer.

The statement links two things that are measured in different ways. A country’s contribution to climate change can be measured by its total emissions, its emissions per person, or its cumulative emissions since industrialisation; suffering can be measured in deaths, economic losses, or the threat to whether a place can remain habitable. On most of these measures the statement is largely true, but its truth depends on the scale at which it is judged and on vulnerability as much as on exposure.

Examiner’s note: key terms defined and the line of argument stated, with a hint of the complexity to come.

Measured by responsibility, the contrast is stark. In 2024 an average person in the USA emitted 14.20 t of carbon dioxide, about 23 times the 0.62 t emitted by an average person in Bangladesh, and the USA accounts for about 23.5% of all CO₂ emitted since 1750, against about 0.1% for Bangladesh. Yet Bangladesh is among the most exposed countries on Earth: its delta faces cyclones, storm surges, river floods and salt water moving into soils. The argument of climate justice rests on this mismatch, and countries such as Bangladesh have used it in negotiations for loss and damage finance.

The mismatch is most extreme for small island states. Tuvalu emits about 1.18 t of CO₂ per person, and 39.3% of its people live below 5 m. Its adaptation options are so limited that it has begun raising land on Funafuti and has signed the Falepili Union treaty with Australia, in force since August 2024, which allows up to 280 Tuvaluans a year to migrate. Here suffering is not only loss but the possibility that a nation may have to move.

Pakistan shows the same pattern. Its 2022 monsoon floods covered about 9% of the country and killed 1,739 people, and a rapid attribution study found the heaviest five-day rainfall about 75% more intense than it would have been without warming.

Examiner’s note: detailed, located evidence with figures and dates; the concept of possibility is used where it sharpens the point.

The consequences also travel through the other core units, which strengthens the statement. Delta megacities such as Dhaka, where tens of millions live on low, flood-prone land, concentrate exposure, and the World Bank projects that up to 216 million people could become internal climate migrants by 2050 without action, most of them in low- and middle-income regions. Droughts threaten food security where farming depends on rain: the Horn of Africa drought of 2020–2023 killed about 9.5 million livestock, leaving millions of pastoralists without food or income.

Examiner’s note: synthesis: the argument links Unit 2 to population (Unit 1) and resources (Unit 3), as the 9–10 band for Section C expects.

However, high emitters suffer too, and in some measures they suffer more. Heatwaves caused an estimated 62,775 heat-related deaths in Europe in summer 2024, and Canada’s 2023 wildfire season, in a high-income country, released more carbon than the country’s fossil fuels did that year. In absolute economic losses, wealthy countries usually lose most, because they have the most assets to destroy. The statement is therefore truer for deaths and for the threat to existence than for money.

Suffering also depends on vulnerability, which wealth and organisation can reduce. The Netherlands has a larger share of its people below 5 m (53.7%) than Bangladesh or Tuvalu, yet ranks 21st of 190 countries in the ND-GAIN climate adaptation index, against Bangladesh’s 160th, because it can afford engineered defences. Bangladesh itself has cut deaths through organisation: its Cyclone Preparedness Programme helped to evacuate about 2.2 million people before Cyclone Amphan in May 2020. At the scale of people rather than countries, the poorest suffer most everywhere, from informal settlements in Dhaka to elderly people living alone during European heatwaves.

Examiner’s note: the counter-argument is as well evidenced as the argument, and the evaluation questions the statement’s unit of analysis (countries or people).

The statement is therefore largely true. The countries that have contributed least, such as Bangladesh, Tuvalu and Pakistan, face the greatest loss of life and, for atoll states, of land itself, while having the least power over global emissions. It is less true for economic losses, which are greatest in wealthy countries, and it hides the more important fact that within every country the poorest people suffer most. Climate change is thus a question of equity at every scale, and whether the injustice grows depends on whether high emitters cut emissions and fund adaptation in the places most at risk.

Markband: 9–10. The answer defines the contested terms, uses detailed evidence from several countries at different levels of development, synthesises Units 1, 2 and 3, gives the counter-argument real weight, considers scale (countries and people) and reaches a conclusion that states the extent of agreement and is framed by power and equity. A version that only listed vulnerable countries and their disasters would be one-sided, at 7–8 if well evidenced, 5–6 if not.

The answer turns the statement’s vague word “countries” into an argument: by the end, a more precise claim about poor people within every country has replaced the original one. Questioning a statement’s terms in this way is one of the most reliable routes to the top band.

Exam tip

In Section C, aim for at least one explicit link to each of the other two core units, even when the title belongs to one of them. A single well-evidenced sentence linking climate change to migration, or population growth to water security, is enough to show synthesis.

Lifting a Section C paragraph to the top band

The difference between a 5–6 essay and a 9–10 essay is clearest at the level of a single paragraph. The two versions use the same idea for the same statement; the second adds figures, a link to another unit, a perspective and a judgment.

Worked example

Two paragraphs for “The countries that contribute least to climate change suffer most from its consequences.” Which would help an essay reach the top band, and why?

A: “Poor countries suffer more from climate change. For example, Pakistan had big floods and Bangladesh has cyclones. These countries do not cause much pollution, so the statement is true.”

B: “Pakistan’s 2022 monsoon floods covered about 9% of the country and killed 1,739 people, and an attribution study found the heaviest five-day rainfall about 75% more intense than it would have been without warming. Bangladesh, whose average resident emitted 0.62 t of CO₂ in 2024 against 14.20 t in the USA, faces cyclones and salt water entering its farmland, which threatens the food security of millions of farming households. From the perspective of these countries, the costs of warming fall on people who did little to cause it, which is the basis of their claim for loss and damage finance. The evidence supports the statement for deaths and livelihoods, although it says less about economic losses, which are largest in wealthy countries.”

Show the commentary

B would help the essay reach the top band. It gives located, dated evidence with figures, measures “contribute least” precisely (emissions per person), links climate to food security from Unit 3, names whose perspective the argument represents, and ends with a judgment that limits the claim. A is relevant but unquantified, vague (“big floods”) and one-sided, the “weakly-evidenced outlining” of the 5–6 band.

A plan for the second title

Worked example

“Population growth is the main threat to global resource security.” To what extent do you agree with this statement? [10]

Show an answer plan
  • Define: resource security (reliable, affordable access to water, food and energy); population growth (natural increase and its global distribution).

  • For: more people raise total demand for food, water and energy; fast-growing regions such as sub-Saharan Africa face the largest increases in demand where access is already lowest.

  • Against (Unit 3): consumption per person, not numbers, drives most demand: the ecological footprint of a high-income country is several times that of a low-income one; the new global middle class adds demand faster than population.

  • Against (Unit 2): climate change threatens supply through drought and lower crop yields; geopolitical shocks (Europe’s loss of Russian gas after 2022) show that resource security can fail suddenly for political reasons.

  • Perspectives: Malthus (population outruns resources) against Boserup (pressure drives innovation); the Green Revolution as evidence for Boserup.

  • Conclusion: population growth is one threat but rarely the main one; consumption, climate change and politics matter more at the global scale, while population growth matters most locally where it meets poverty and scarcity.

Add to your notes: a Section C synthesis grid: one row for each likely theme (vulnerability, mitigation, migration, ageing, the nexus, consumption, stewardship) and one column for each core unit, with a located example in every cell where two units meet. Each filled cell is a ready-made synthesis sentence.

Where marks are lost in Paper 2

Most marks lost in Paper 2 come from a few habits, and most of those come from time pressure: answers that are too long in Section A, too general in Section B, or unfinished in Section C.

Section

Common loss

The fix

A (a)

A description with no figures, or one that explains instead of describing

Quote two values with units and dates; leave reasons for (b) and (c)

A (b)

Suggestions that ignore the place or group named in the question

Name the country, city or group in each suggestion and say why it applies there

A (c)

Two versions of the same reason, or a list of four reasons with no development

Choose reasons from different categories and add “so…” to each

B (c)

Points from general knowledge instead of the infographic; only one side; no appraisal

Quote the infographic in every point, cover both sides, end with a judgment on the evidence

C

A one-sided essay, evidence from one unit only, or no conclusion

Test the statement, link at least two units, and leave four minutes for a conclusion that states the extent

The pattern behind the table is that Paper 2 rewards precision over length. A Section A answer of four exact sentences earns more than a page of general writing, and the time saved is what allows a Section C essay to reach its conclusion.

Steps for Paper 2

  • To do:

    Read both Section C titles first and choose one before starting Section A.

  • To do:

    In each Section A question, describe with figures in (a), and give two short, developed points in (b) and (c); keep each question to about 11 minutes.

  • To do:

    Read the infographic in five steps: title and source, headline figures, each panel, the message, what is missing.

  • To do:

    In Section B (c), quote evidence from the infographic on both sides and finish with an appraisal of the evidence.

  • To do:

    In Section C, define the statement’s key words and decide how far you agree before writing.

  • To do:

    Use evidence from at least two core units, with named places, dates and figures.

  • To do:

    Give the counter-argument real evidence, and finish with a conclusion that states the extent of your agreement and why.

Keep your place

In Augment the notes remember where you stopped and which pages you have finished.

Open in Augment

More IB Geography notes

  • Paper 1: the optionsThe page before this.
  • Paper 3: the HL extensionThe next page. HL only.
  • Geography assessmentEach Geography paper, the internal assessment and grade boundaries.
  • IB GeographyThe Geography syllabus, how it is assessed and every notes page.

Carry on with Geography in Augment

With a free account, Augment remembers where you stopped in the notes and which questions you have marked.

Start free