2.5 Elasticity of demand questions for IB Economics
137 questions on Elasticity of demand, written by Augment in the style of IB exam papers. Six of them are below in full, to answer on paper.
- IB Economics
- Part of 2 Microeconomics
- SL and HL
Questions by paper and level
SL and HL questions are for students at either level. HL only questions cover what only HL students study.
| Paper | SL and HL | HL only | All |
|---|---|---|---|
| Paper 1 | 25 | 10 | 35 |
| Paper 2 | 64 | 7 | 71 |
| Paper 3HL only | 0 | 31 | 31 |
| Every paper | 89 | 48 | 137 |
Counted on
Questions to try
Written by Augment in the style of IB exams, not past papers. Answer them on paper, then check each one against its markscheme with a free account.
Economists use simplified models to predict how markets will respond to changes in government policy.
- (a)
Explain the role of economic models and the ceteris paribus assumption in predicting the effect of an indirect tax on a market.
10 marks
- (b)
Using real-world examples, evaluate the importance of price elasticity of demand (PED) for governments when deciding which goods to tax.
15 marks
The diagram shows the market for bus tickets in a city, in equilibrium at price and quantity .
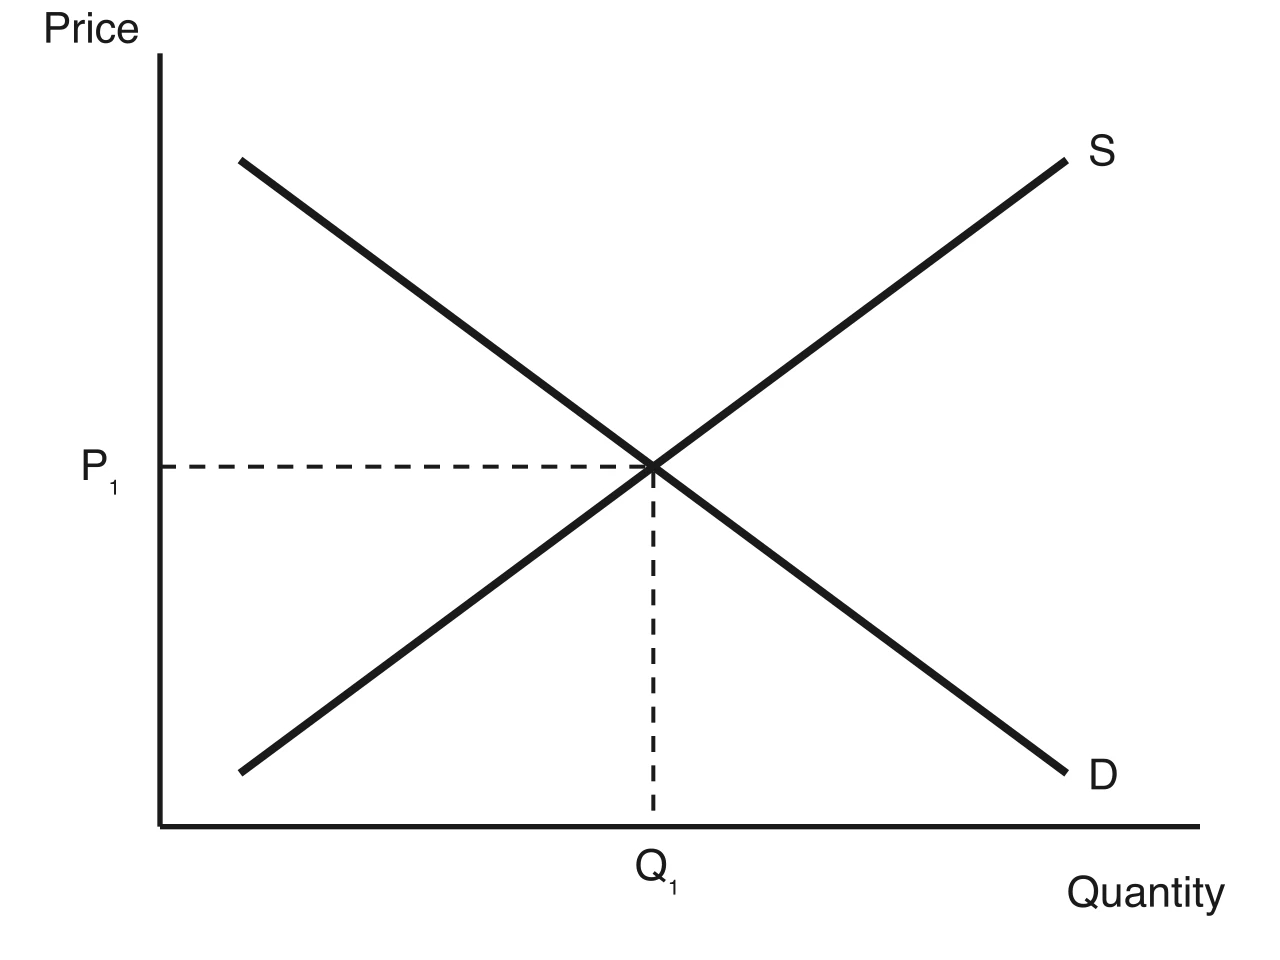
When the bus company raised the ticket price from $2.00 to $2.50, the number of tickets sold per day fell from 40 000 to 36 000.
- (a)
Define price elasticity of demand.
2 marks
- (b)
Calculate the price elasticity of demand for bus tickets.
2 marks
- (c)
Using your answer to (b), explain the effect of the price rise on the bus company’s total revenue.
4 marks
Gas prices in Brennmark
Brennmark is a high-income country in northern Europe that imports most of its natural gas, which is used for heating homes, generating electricity and in industry. In 2022 a disruption to imports from its main supplier sharply reduced the supply of gas to Brennmark's wholesale market, where many buyers and sellers trade.
Table 1: Brennmark's wholesale gas market
2021 | 2022 | |
|---|---|---|
Average wholesale price (Brennmark kroner (BMK) per megawatt hour (MWh)) | 40 | 80 |
Quantity of gas consumed (million MWh) | 80 | 72 |
- (a)(i)
Using Table 1, calculate the percentage change in the average wholesale price of gas between 2021 and 2022.
2 marks
- (a)(ii)
Using Table 1, calculate the price elasticity of demand (PED) for gas in Brennmark between 2021 and 2022.
2 marks
- (a)(iii)
Using your answer to (a)(ii), state whether the demand for gas in Brennmark is price elastic or price inelastic.
1 mark
- (a)(iv)
Assume that the demand curve for gas is a straight line that meets the price axis at BMK 440 per MWh and that it did not change between 2021 and 2022.
Using Table 1, calculate the consumer surplus in Brennmark's wholesale gas market in 2021 (in BMK million).
2 marks
- (a)(v)
Using Table 1 and your answer to (a)(iv), calculate the change in consumer surplus in Brennmark's wholesale gas market between 2021 and 2022 (in BMK million).
3 marks
- (a)(vi)
Sketch a demand and supply diagram to show the effect of the disruption to gas imports on Brennmark's wholesale gas market.
2 marks
- (a)(vii)
Between 2021 and 2022, sales of electric heat pumps, which can replace gas boilers for heating homes, doubled, and the average price of a heat pump rose by 18 %. Several manufacturers announced plans to open new factories in Brennmark.
Using a demand and supply diagram and the information provided, explain how the price mechanism responded in the market for heat pumps.
4 marks
- (a)(viii)
Explain two reasons why the price elasticity of demand for gas in Brennmark is likely to be higher in the long run than the value calculated in (a)(ii).
4 marks
- (b)
Further information about Brennmark:
The average household spends 4 % of its income on energy, but the poorest 20 % of households spend 11 %.
The retail price of gas paid by households rose from BMK 90 to BMK 150 per MWh in 2022.
Option 1: cap the retail price of gas for all households at BMK 100 per MWh, with the government paying suppliers the difference. Estimated cost: BMK 9 billion a year.
Option 2: a lump-sum energy payment of BMK 1200 a year to each household in the poorest 30 %, paid regardless of how much gas they use. Estimated cost: BMK 1.6 billion a year.
Option 3: cut the rate of value added tax (VAT) on household energy from 20 % to 5 %. Estimated cost: BMK 3 billion a year.
Option 4: grants for insulation and heat pumps for low-income households. Estimated cost: BMK 2 billion a year; most of the savings on bills would appear after three to five years.
The government aims to reduce national gas consumption by 15 %. Its budget deficit is 3.8 % of GDP, above its own limit of 3 %.
Using the information provided and your knowledge of economics, recommend a policy the government of Brennmark could introduce to protect low-income households from high gas prices without removing the incentive to reduce gas consumption.
10 marks
Firms selling branded consumer products spend large sums on marketing to build customer loyalty.
- (a)
Explain how a successful advertising campaign and a rise in consumers' incomes could each increase the demand for a branded product.
10 marks
- (b)
Using real-world examples, discuss the view that firms whose customers are loyal to their brand can always increase their revenue by raising prices.
15 marks
Read the extract and answer the questions that follow.
Text A — Testing the effect of Cerulia's sugar levy
[1] In January 2024 Cerulia introduced a levy on soft drinks containing more than 8 g of sugar per 100 ml. Before the levy was introduced, health economists at the national university put forward the hypothesis that demand for sugary soft drinks is price inelastic, so the levy would raise substantial revenue but reduce consumption only slightly.
[2] After the levy, the average price of a 1.5-litre bottle of sugary soft drink rose from 2.00 cerulian lira (CRL) to CRL 2.30. Monthly sales of sugary soft drinks fell from 18.0 million bottles to 16.2 million bottles.
[3] The researchers noted that over the same period a national advertising campaign warned about the health risks of sugar, and several manufacturers launched new low-sugar versions of their drinks.
- (a)
Define the term hypothesis indicated in bold in the text (Text A, paragraph 1).
2 marks
- (b)(i)
Using information from Text A, paragraph 2, calculate the price elasticity of demand (PED) for sugary soft drinks in Cerulia.
2 marks
- (b)(ii)
Using your answer to (b)(i), state whether the evidence supports or refutes the economists' hypothesis.
1 mark
- (c)
Using a demand and supply diagram, explain the effect of the levy on the market for sugary soft drinks in Cerulia (Text A, paragraph 2).
4 marks
- (d)
Using information from Text A, paragraph 3, explain two reasons why the PED calculated in (b)(i) may not accurately measure the responsiveness of demand to the levy.
4 marks
Household energy use in Rennland
Rennland is a high-income economy with long, cold winters. Most homes are heated by gas boilers, and households account for about one-fifth of the country's carbon dioxide (CO₂) emissions. The government has set a target of cutting household CO₂ emissions by 40 % between 2015 and 2035. The currency of Rennland is the Rennish krone (RNK).
Table 1: Household energy use in Rennland
2015 | 2024 | |
|---|---|---|
Household gas consumption (terawatt-hours, TWh) | 96 | 88 |
Household CO₂ emissions (million tonnes) | 17.6 | 16.1 |
Average household gas price (RNK per kilowatt-hour, kWh) | 0.080 | 0.104 |
Number of households (millions) | 8.0 | 8.4 |
Note: 1 TWh = 1 000 000 000 kWh.
- (a)(i)
Using Table 1, calculate the percentage change in household CO₂ emissions between 2015 and 2024.
2 marks
- (a)(ii)
Using Table 1, calculate average gas consumption per household in 2024, in kWh.
2 marks
- (a)(iii)
Since 2023, households replacing a boiler have had to tick either “heat pump” or “gas boiler” on the installation form before work can begin. Separately, energy suppliers now install smart thermostats with a pre-set temperature of 19 °C, which households can change.
Distinguish between a default choice and a mandated choice.
3 marks
- (a)(iv)
In a trial, 5 000 homes received smart thermostats pre-set at 19 °C and 5 000 similar homes received thermostats pre-set at 21 °C. Average annual gas use was 9 800 kWh in the first group and 10 900 kWh in the second.
Calculate the percentage difference in average annual gas use between homes with the 19 °C setting and homes with the 21 °C setting.
2 marks
- (a)(v)
Using Table 1 and the information in part (a)(iv), calculate the annual saving on gas bills for a household with the 19 °C setting compared with the 21 °C setting, at the 2024 gas price.
1 mark
- (a)(vi)
Using an externalities diagram, explain why household gas consumption in Rennland is likely to be above the socially optimal level.
4 marks
- (a)(vii)
The government is considering a carbon tax of RNK 0.020 per kWh on household gas. The price elasticity of demand (PED) for household gas is estimated at −0.25.
Using Table 1, calculate the percentage change in household gas consumption if the full tax is passed on to consumers.
2 marks
- (a)(viii)
Surveys show that loft and wall insulation would pay for itself within six years through lower gas bills for most homes in Rennland, yet fewer than 3 % of homeowners insulate their homes each year.
Explain two limitations of the assumptions of rational consumer choice that may explain why so few homeowners insulate their homes.
4 marks
- (b)
Further information on the options for reducing household emissions in Rennland:
A carbon tax of RNK 0.020 per kWh on household gas would raise about RNK 1.7 billion a year. About 14 % of households are in fuel poverty, spending more than a tenth of their income on energy.
A subsidy covering half the cost of a heat pump (about RNK 6 000 per home) would cost the government RNK 1.2 billion a year if 200 000 homes took it up.
Regulations could require all rented homes to meet a minimum energy-efficiency standard by 2030. Landlords say this would raise rents.
Default smart thermostat settings of 19 °C could be required for all new installations; households can change the setting at any time.
A ban on installing new gas boilers from 2028 is opposed by households who cannot afford heat pumps.
Using the information provided and your knowledge of economics, recommend a policy the government of Rennland could introduce to reduce household CO₂ emissions.
10 marks
Practice all 137 in Augment
Free with an account. Every question has its markscheme, and Augment keeps the ones you got wrong so you can come back to them.
More questions in Microeconomics
- 2.1Demand
- 2.2Supply
- 2.3Competitive market equilibrium
- 2.4Critique of the maximising behaviour of consumers and producersHL only
- 2.5Elasticity of demandThis page
- 2.6Elasticity of supply
- 2.7Role of government in microeconomics
- 2.8Market failure: externalities and common pool resources
- 2.9Market failure: public goods
- 2.10Market failure: asymmetric informationHL only
- 2.11Market failure: market powerHL only
- 2.12The market’s inability to achieve equityHL only
Check your answers in Augment
A free account opens all 137 questions on Elasticity of demand with their markschemes, and keeps a record of what you have marked.