2.6 The modelling process questions for IB Maths AI
27 questions on The modelling process, written by Augment in the style of IB exam papers. Six of them are below in full, to answer on paper.
- IB Mathematics: Applications and Interpretation
- Part of 2 Functions
- SL and HL
Questions by paper and level
SL and HL questions are for students at either level. HL only questions cover what only HL students study.
| Paper | SL and HL | HL only | All |
|---|---|---|---|
| Paper 1 | 10 | 1 | 11 |
| Paper 2 | 10 | 3 | 13 |
| Paper 3HL only | 0 | 3 | 3 |
| Every paper | 20 | 7 | 27 |
Counted on
Questions to try
Written by Augment in the style of IB exams, not past papers. Answer them on paper, then check each one against its markscheme with a free account.
Consider the following four situations.
A: the height of the tide at a harbour, measured every hour for three days.
B: the value of a savings account in which interest is compounded annually, with no further deposits or withdrawals.
C: the fare for a taxi journey, which is a fixed charge plus a constant charge per kilometre.
D: the height of a basketball, from the moment it leaves a player's hands until it reaches the hoop.
The possible types of model are: linear, quadratic, exponential and sinusoidal.
- (a)
For each situation, write down the most appropriate type of model.
4 marks
- (b)
Give a reason for your choice of model for situation A.
1 mark
- (c)
Give a reason for your choice of model for situation B.
1 mark
A mobile phone company offers three monthly plans. The cost of each plan, in British pounds (GBP), depends on the amount of data, gigabytes (GB), used in the month.
Plan A: 18 GBP, which includes the first 5 GB of data, then 4 GBP per GB for any data beyond 5 GB.
Plan B: 9 GBP plus 3.50 GBP per GB of data used.
Plan C: 30 GBP for unlimited data.
Assume that data is charged for exact amounts.
- (a)
Find the cost of each plan for a month in which Zara uses 8 GB of data.
3 marks
- (b)
Write down a piecewise function for the cost of Plan A, for .
3 marks
- (c)
Find the amount of data for which Plan A and Plan B cost the same, where .
2 marks
- (d)
Determine the range of values of for which Plan A is the cheapest of the three plans.
4 marks
- (e)
Zara's monthly data use varies between 4 GB and 12 GB. State, with a reason, which plan you would recommend.
2 marks
This question compares models for the power output of a wind turbine.
An engineer, Tomasz, records the wind speed, m s−1, and the power output, kW, of a small wind turbine at a coastal site.
(m s−1) | 4 | 5 | 6 | 7 | 8 | 9 | 10 | 11 | 12 |
|---|---|---|---|---|---|---|---|---|---|
(kW) | 58 | 102 | 190 | 285 | 441 | 612 | 862 | 1120 | 1475 |
- (a)(i)
Find the equation of the regression line of on .
2 marks
- (a)(ii)
Write down the coefficient of determination, , for this linear model.
1 mark
- (a)(iii)
Calculate the residuals of the linear model at , and , and hence explain why a linear model is not appropriate, despite the high value of .
3 marks
- (b)(i)
Tomasz next considers a power model .
Show that this model gives a linear relationship between and .
2 marks
- (b)(ii)
Use your graphic display calculator to find the values of and .
2 marks
- (b)(iii)
For a model , the sum of square residuals is .
Find the value of for the power model.
2 marks
- (c)(i)
Physical theory suggests that the power output is proportional to the cube of the wind speed, so Tomasz now considers the model . He chooses to minimize
Show that is minimized when .
4 marks
- (c)(ii)
Hence find the value of .
2 marks
- (d)
For the model , , correct to three significant figures.
Tomasz notices that this one-parameter model has a smaller value of than the power model in part (b), which has two parameters. Explain why this is possible, and state which of the two models fits the data better.
3 marks
- (e)
On one day, the wind speed at the site hours after midnight is modelled by , for .
The energy, in kWh, produced by the turbine in one day is . Use the model to find the energy produced that day.
3 marks
- (f)
The turbine's maximum power output is 1500 kW. Comment on using the model to predict the power output when the wind speed is 15 m s−1.
1 mark
The table shows the mean monthly temperature, °C, in a city in Canada, where is the number of months after January ( is January).
0 | 1 | 2 | 3 | 4 | 5 | 6 | 7 | 8 | 9 | 10 | 11 | |
|---|---|---|---|---|---|---|---|---|---|---|---|---|
(°C) | 2.1 | 3.0 | 6.4 | 10.8 | 15.3 | 18.9 | 20.3 | 19.6 | 15.9 | 11.2 | 6.3 | 2.9 |
Francesca wants to model the data with a function of the form , where and is measured in degrees.
- (a)
Give a reason why a model of this form is appropriate for these data.
1 mark
- (b)
Using the maximum and minimum values in the table, find the value of and the value of .
3 marks
- (c)
Write down the value of .
1 mark
- (d)
Calculate the percentage error when Francesca's model is used to estimate the mean temperature in April ().
2 marks
A short video is posted online. The total number of views, thousand, days after it is posted is modelled by
- (a)
(i) Write down the value of .
(ii) Interpret this value in context.
2 marks
- (b)
Find the number of views after 7 days.
2 marks
- (c)
Find the number of days until the video reaches 50 million views.
2 marks
- (d)
Show that, according to this model, the number of views doubles approximately every two days.
3 marks
- (e)
Explain why this model is not suitable for predicting the number of views after several months.
1 mark
- (f)
An analyst proposes a second model,
(i) Write down the equation of the horizontal asymptote of the graph of .
(ii) Interpret your answer to part (f)(i) in context.
2 marks
- (g)
(i) Find the value of , , at which the two models predict the same number of views.
(ii) Hence suggest how the two models could be combined to describe the number of views.
3 marks
The purpose of this question is to find the cheapest design for a grain silo, first without and then with a planning restriction.
A farming cooperative plans to build a grain silo in the shape of a cylinder of radius metres and height metres, with a hemispherical roof of radius metres, as shown in the following diagram.
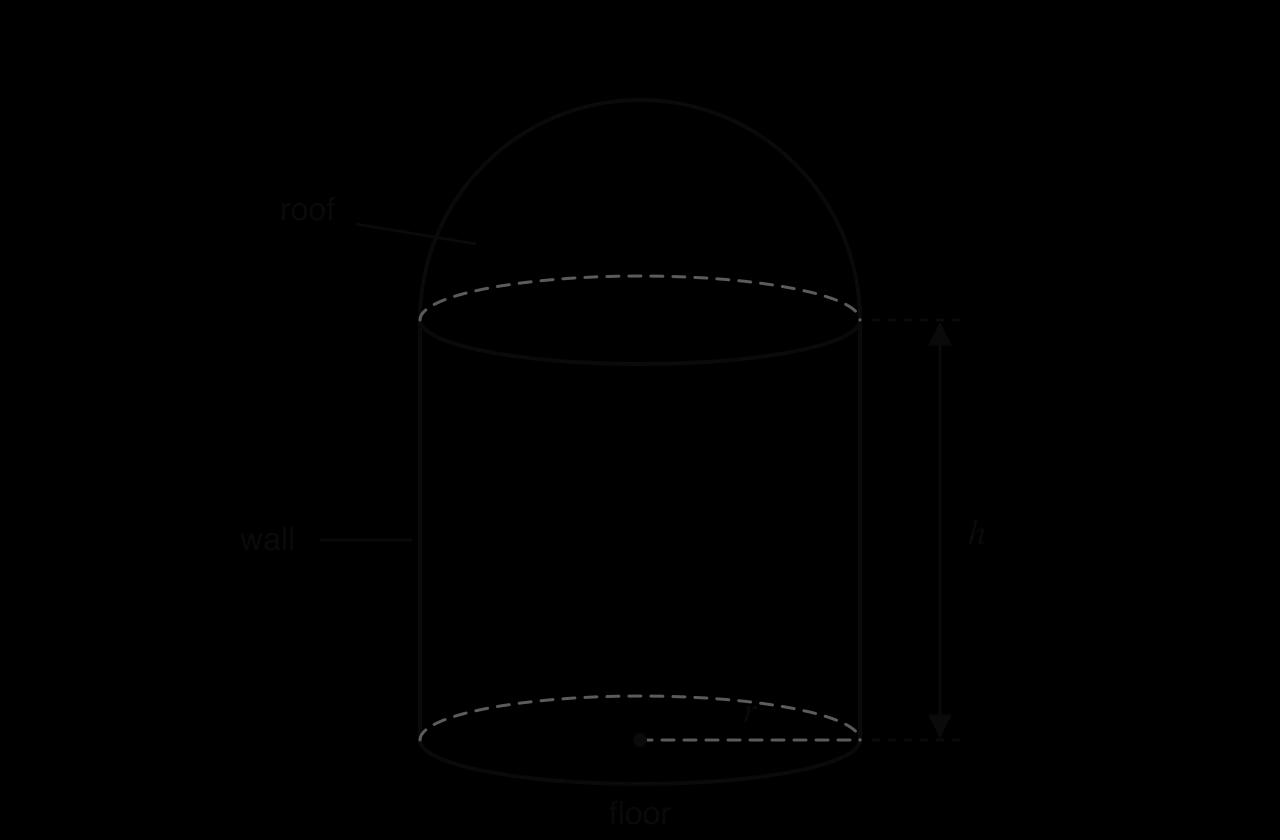
The silo must hold of grain. The building costs are 40 US dollars (USD) per m² for the circular floor, 60 USD per m² for the curved wall and 90 USD per m² for the hemispherical roof.
- (a)
Show that .
3 marks
- (b)
Show that the total cost, USD, of building the silo is given by
3 marks
- (c)
Explain why the model is only valid for .
2 marks
- (d)
Find .
2 marks
- (e)
Find the value of and the value of that minimize the cost, and find this minimum cost to the nearest dollar.
4 marks
- (f)
Use the second derivative to justify that this value of gives a minimum cost.
2 marks
- (g)(i)
A local planning regulation states that the total height of the silo, including the roof, must not exceed 9 m.
Show that the radius must satisfy .
1 mark
- (g)(ii)
Find the least value of that satisfies the regulation.
2 marks
- (g)(iii)
Explain why the cheapest silo that satisfies the regulation has the radius found in part (g)(ii), and find its cost to the nearest dollar.
3 marks
- (g)(iv)
Find the percentage increase in the minimum cost caused by the regulation.
2 marks
- (h)
Suggest one further cost that the cooperative should include in the model before deciding on the radius of the silo.
1 mark
Practice all 27 in Augment
Free with an account. Every question has its markscheme, and Augment keeps the ones you got wrong so you can come back to them.
More questions in Functions
- 2.1Equations of straight lines
- 2.2Functions, domain and range
- 2.3Graphing functions with technology
- 2.4Key features of graphs
- 2.5Modelling with functions
- 2.6The modelling processThis page
- 2.7Composite and inverse functionsHL only
- 2.8Transformations of graphsHL only
- 2.9Further modellingHL only
- 2.10Scaling very large and small numbers using logarithmsHL only
Check your answers in Augment
A free account opens all 27 questions on The modelling process with their markschemes, and keeps a record of what you have marked.