Planning fieldwork and the fieldwork question
Choose a fieldwork topic linked to the course, write a focused fieldwork question with hypotheses, set out the geographic context and location map, and plan methods, a pilot study, risk assessment and ethics.
- IB Geography
- Internal assessment
- SL and HL
What the fieldwork report is
The internal assessment in geography is a written report of up to 2,500 words based on fieldwork: an investigation of one focused question about a real local place, answered with information collected first-hand. It is the same at SL and HL, it is marked out of 25 by your teacher against six criteria (A to F), and a sample of reports from each school is moderated by the IB. About 20 hours of teaching time are set aside for it, from planning to the final report.
Three rules shape everything else. First, the investigation must be based on primary data, collected in the field by measuring, counting, observing or asking; secondary data such as census figures or gauge records may support it but only in a small way. Secondly, the question must be linked to a topic in the course, and the report says which. Thirdly, data collection can be shared, but the writing is yours alone.
Secondary sources still have a place: a gauge record can show whether the river was high or low on the day of fieldwork, and a census table can show whether a surveyed street is typical of its town.
Rule | What it means in practice |
|---|---|
Length | At most 2,500 words of main text. A moderator stops reading at 2,500 words, so anything after that (usually the conclusion and evaluation) earns nothing. |
Primary data first | Your own measurements, counts, surveys or interviews form the basis of the analysis; secondary data only add context or a comparison. |
Link to the course | The question relates to an option, a core unit or one of the HL units suitable for local study, and the report names the topic. |
Local scale | A manageable site you can reach and work in safely: a stretch of river, a beach, a town centre, a park, a village. It need not be near the school. |
Group work | The topic, question and methods may be chosen by the class or a group, and data may be collected and shared in groups. The justification of methods, the analysis, the conclusion and the writing must be entirely your own. |
Drafts | Your teacher may comment on one draft, in general terms; the next version you hand in is final. |
Maps | Location maps should be your own, hand-drawn or made with GIS; a map downloaded from the internet must be adapted and must follow mapping conventions. |
References | Every source is cited in a standard system such as Harvard, with the date of access for websites. |
The criteria and the shape of the report
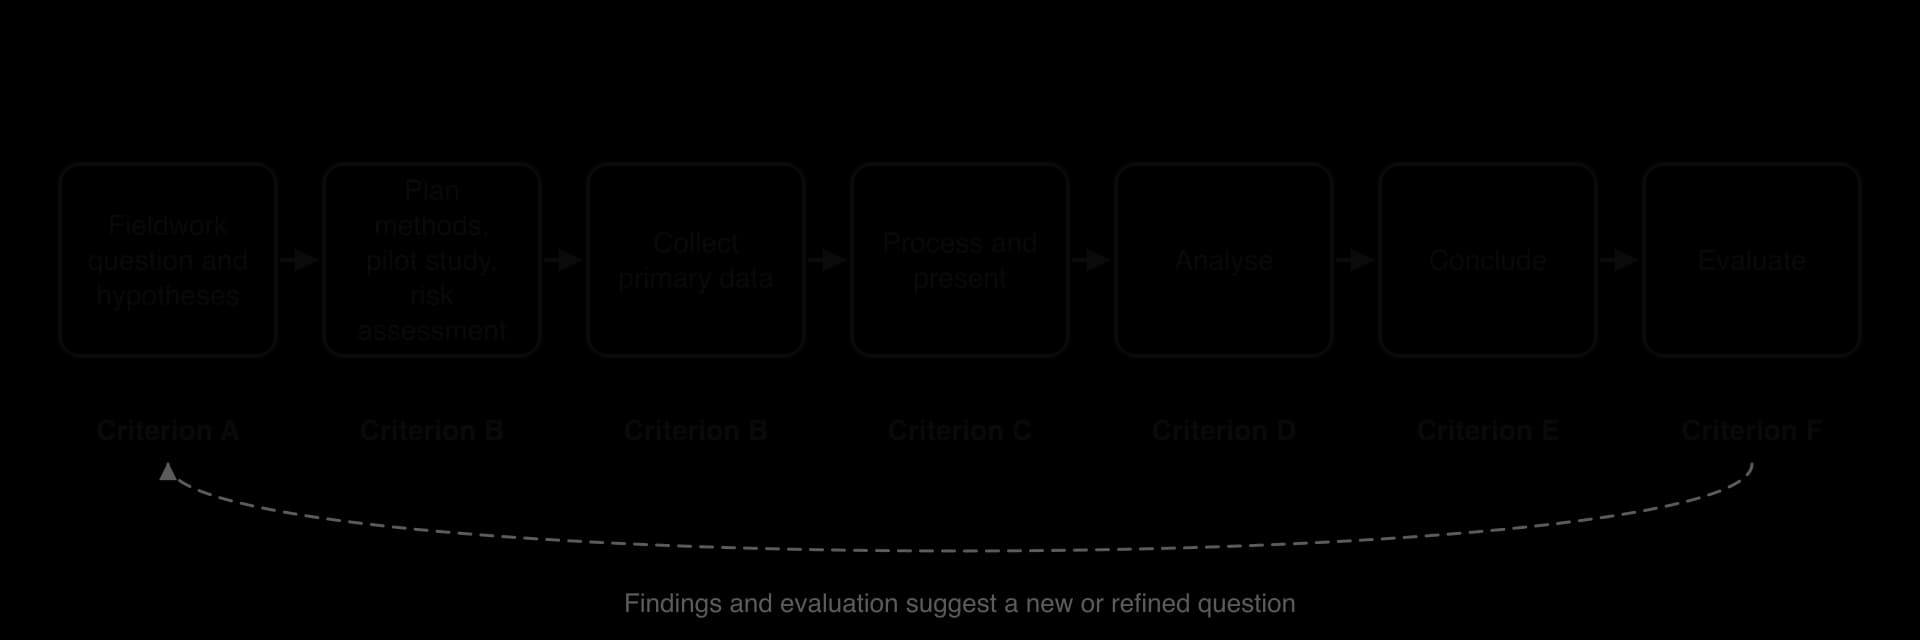
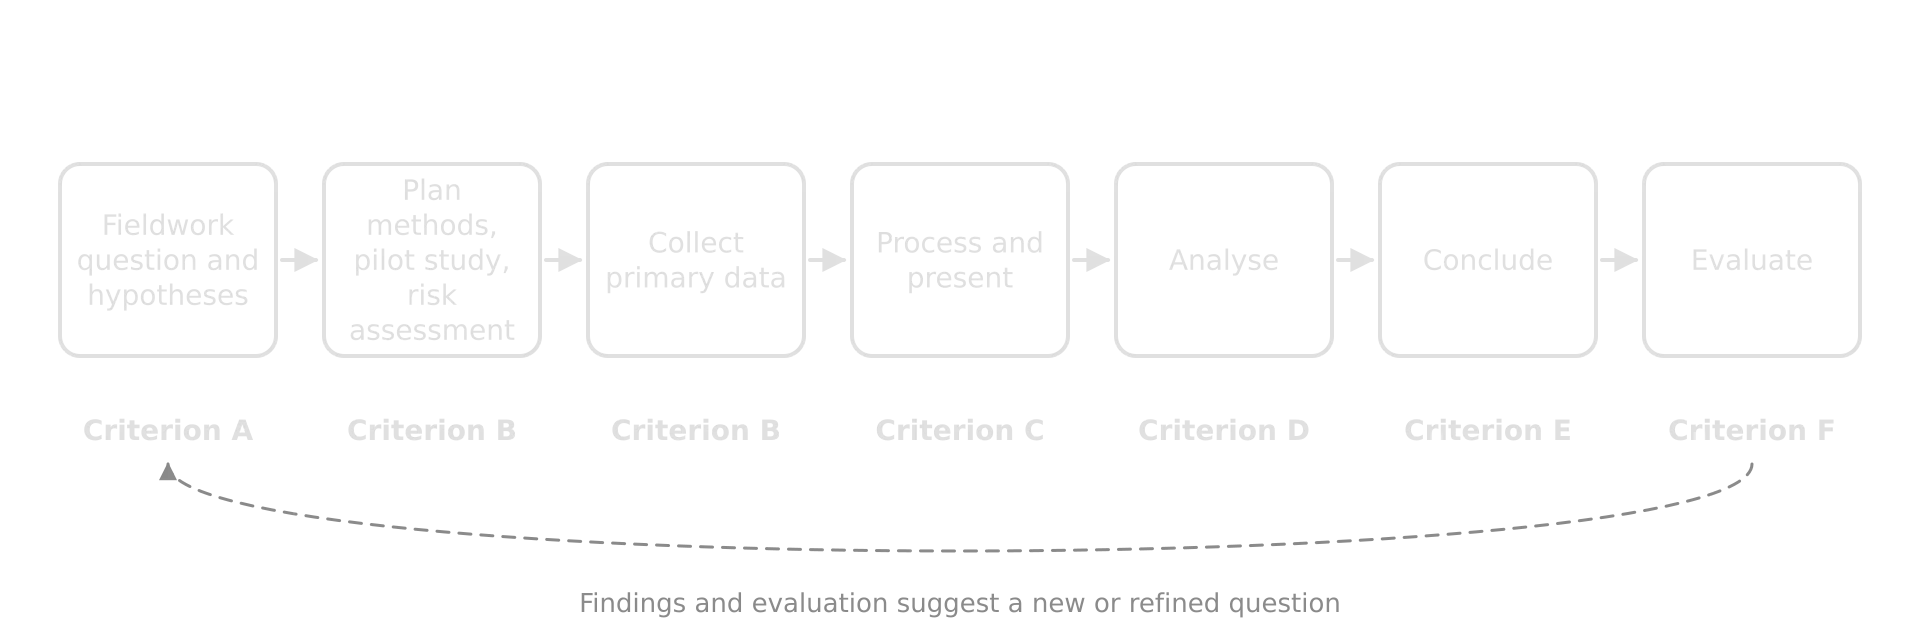
The report is marked against six criteria, and the most efficient structure follows them in order, one section each. The suggested word counts are guidance, not rules, but they show where the marks are: the written analysis alone is worth almost a third of the total.
Criterion | Report section | Marks | Suggested words | What earns the top band |
|---|---|---|---|---|
A | Fieldwork question and geographic context | 3 | 300 | A focused, geographical question about a precise location, linked to course theory that leads to hypotheses; one or more location maps following conventions |
B | Method(s) of investigation | 3 | 300 | Methods, instruments and sampling described and justified, used correctly, giving reliable data relevant to the question and theory |
C | Quality and treatment of information collected | 6 | 500 | Data all relevant and sufficient; the most appropriate graphs, maps and tables, following conventions |
D | Written analysis | 8 | 850 | Descriptive and statistical techniques; trends, patterns, statistics and anomalies explained and linked to the question, theory, location and methods |
E | Conclusion | 2 | 200 | A clear answer to the question, supported by the analysis |
F | Evaluation | 3 | 300 | Strengths and weaknesses of the methods, question, presentation and location explained; improvements and their impact explained |
Choosing a topic
A good topic starts from something in the course that can be seen and measured locally. The question then applies a model, a theory or a process to a real place: how a river channel changes downstream, how a groyne affects a beach, how environmental quality changes away from a city centre, how tourists perceive a crowded beauty spot. The topic can be physical, human, environmental or a mix of these.
Course topic | Suitable local investigation |
|---|---|
Freshwater: drainage basin processes | Downstream change in channel characteristics; infiltration rates under different land uses |
Oceans and coastal margins: managing coasts | Beach profiles and sediment size either side of groynes; the effect of a sea wall on beach width |
Leisure, tourism and sport: tourism at the local scale | Visitor numbers, footpath erosion or visitor perceptions at a honeypot site |
Urban environments: urban change and stress | Environmental quality or land use along a transect from the central business district; the urban heat island |
Food and health; local responses to global interactions | The origin of food sold in different shops, or the share of local produce |
Global resource consumption: resource stewardship | Recycling behaviour and the use of recycling points in different neighbourhoods |
Some topics cannot be studied at the local scale with primary data and are unlikely to be suitable: ocean–atmosphere interactions, the characteristics of extreme environments, geophysical systems, tourism and sport at the international scale, measuring food and health, and the core units on population and global climate. Most of the HL extension works at the global scale too; local responses to global interactions and local and global resilience are the exceptions. A global issue works only if it is reduced to something local, such as resource stewardship measured in one town.
Writing the fieldwork question
The fieldwork question is the single question the whole report answers. It decides what data to collect, which methods are relevant and what the conclusion must say. A strong question is focused, geographical (it is about variation over space, or a process in a place), names a precise location and can be answered with primary data in the time available.
Weak question | Problem | Stronger question |
|---|---|---|
How do rivers change downstream? | No location; too broad; a textbook question | How do channel characteristics change with distance downstream along the upper 10 km of the Kerran Beck? |
Is coastal management effective? | No location; "effective" undefined; cannot be measured in a day | How does the groyne field at the north end of the beach affect beach width and sediment size? |
What do people think about tourism? | No place; a single variable; opinions only | How do visitor numbers and perceptions of crowding vary between the car park and the summit path at a named honeypot site? |
How is my city affected by globalisation? | Global scale; no measurable variable | What proportion of the fresh food sold in three types of shop in the town centre is grown within 50 km? |
Why is the town centre declining? | Assumes the answer; vague cause | How do pedestrian counts and the proportion of vacant shop units change with distance from the main square? |
How does land use change from the CBD? | Good idea, but which city and which route? | How does land use change along a 3 km transect from the CBD of a named town to its southern suburbs? |
Questions that compare places or measure change along a line work particularly well, because they give a spatial pattern to analyse and enough sites for a statistical test. "To what extent…" questions also suit the criteria, since they invite a nuanced conclusion. A question with a yes/no answer ("Is the river wider downstream?") is usually too narrow: rephrase it to ask how, or how far, something varies.
Hypotheses and predictions
A hypothesis turns the question into testable statements. Each one predicts a relationship or difference between two variables and comes from geographical theory, which is why criterion A asks for the link to theory: the theory is what allows a prediction to be made. A hypothesis should name both variables and the direction of the expected change ("increases", "decreases", "is higher at").
Statistical tests work with a null hypothesis, written H₀, which states that there is no relationship or no difference. The test calculates how likely the observed result would be if H₀ were true; if that is very unlikely, H₀ is rejected and the alternative hypothesis (H₁, your prediction) is accepted at a stated level of confidence.
The worked investigation: the Kerran Beck
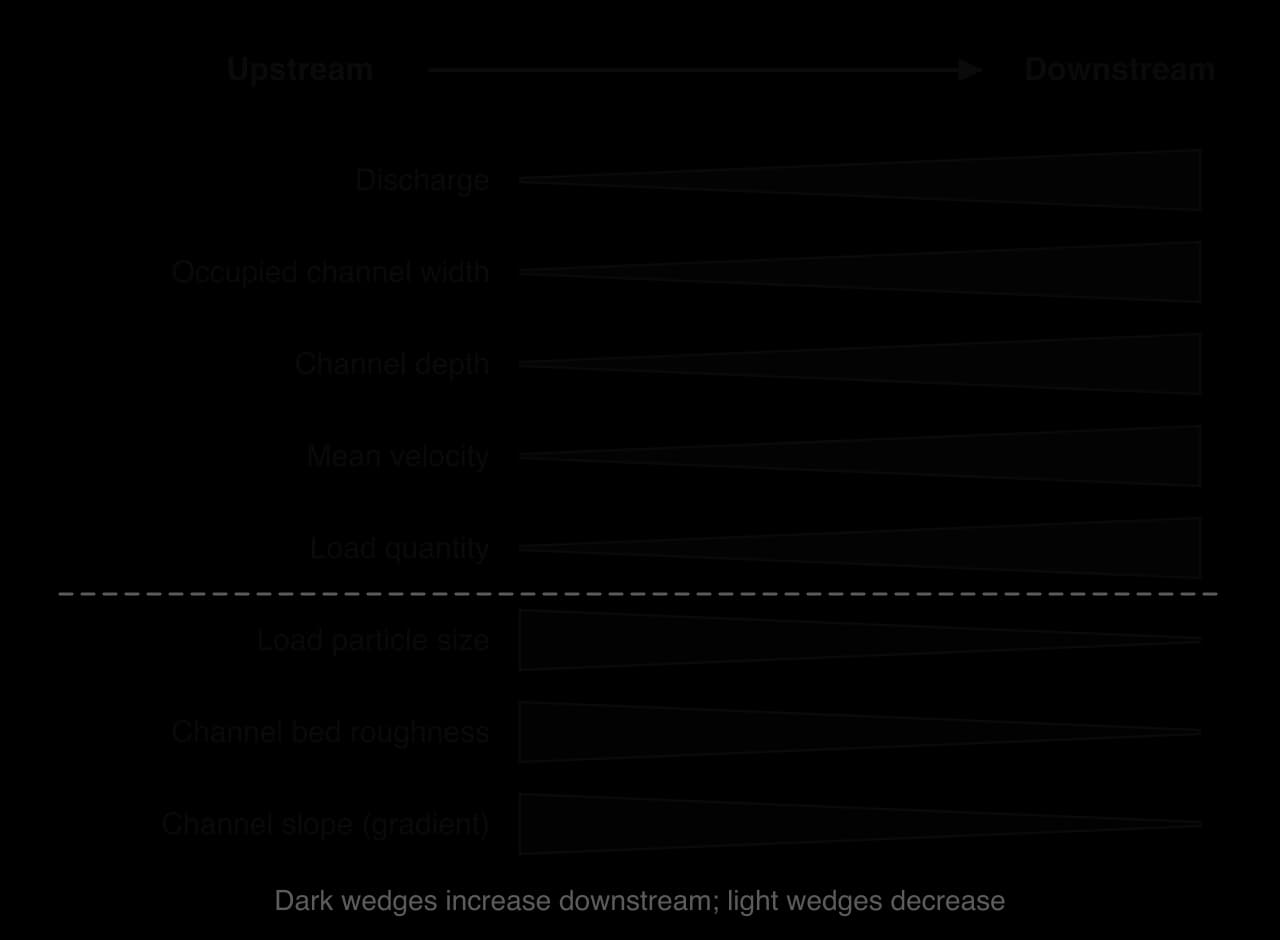
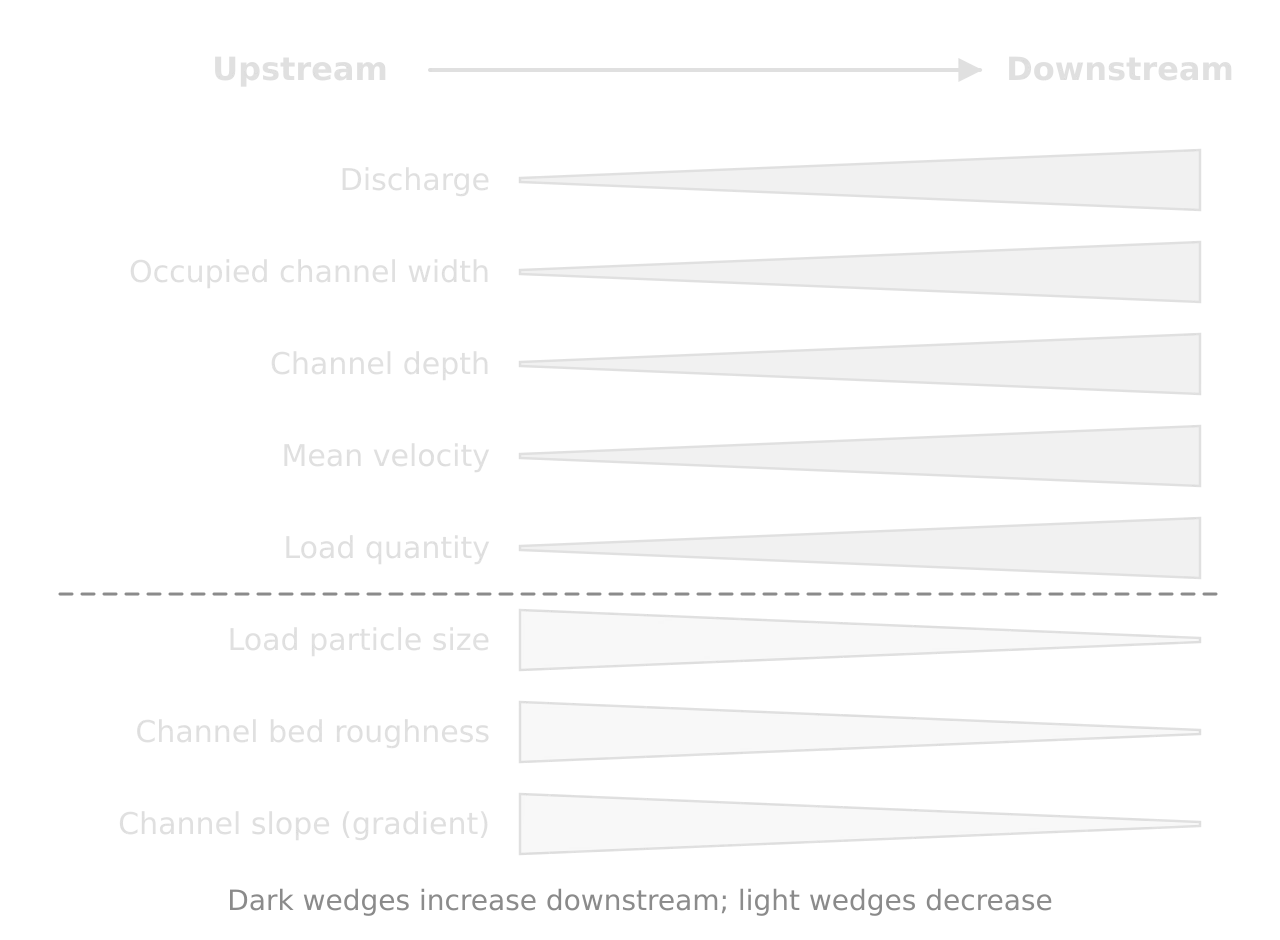
One investigation is followed through every stage, from question to evaluation, using hypothetical data for an invented upland stream, the Kerran Beck. Its question is: How do channel characteristics change with distance downstream along the upper 10 km of the Kerran Beck? The theory behind it is the Bradshaw model, which predicts how a river’s channel, flow and load change from source to mouth.
Hypothesis (H₁) | Null hypothesis (H₀) | Theory behind it | |
|---|---|---|---|
H1 | Channel width increases with distance downstream | There is no relationship between width and distance downstream | Tributaries and groundwater add water, so the channel enlarges to carry a larger discharge |
H2 | Discharge increases with distance downstream | There is no relationship between discharge and distance downstream | The drainage area, and therefore the volume of water collected, grows downstream |
H3 | Mean velocity increases with distance downstream | There is no relationship between velocity and distance downstream | A deeper channel has a larger hydraulic radius, so proportionally less water is slowed by friction with the bed and banks, even though the gradient falls |
H4 | Pebble size decreases with distance downstream | There is no relationship between pebble size and distance downstream | Attrition and abrasion wear the load down during transport |
H3 is the most interesting of the four, because it contradicts what many people expect: water looks fast in a steep mountain stream. The prediction rests on hydraulic radius, the cross-sectional area divided by the wetted perimeter, which measures how efficiently a channel carries water. Testing a prediction that goes against common sense gives the analysis more to explain.
The geographic context and the location map
The context section explains, briefly, where the investigation takes place and why the place suits the question. About 300 words are enough for the question, the context, the theory and the hypotheses together. It locates the site (region, river or settlement, with distances and directions), describes the features that matter (geology, land use, a weir or a tributary, a groyne field, a shopping street), and gives the link to the course topic and to the theory.
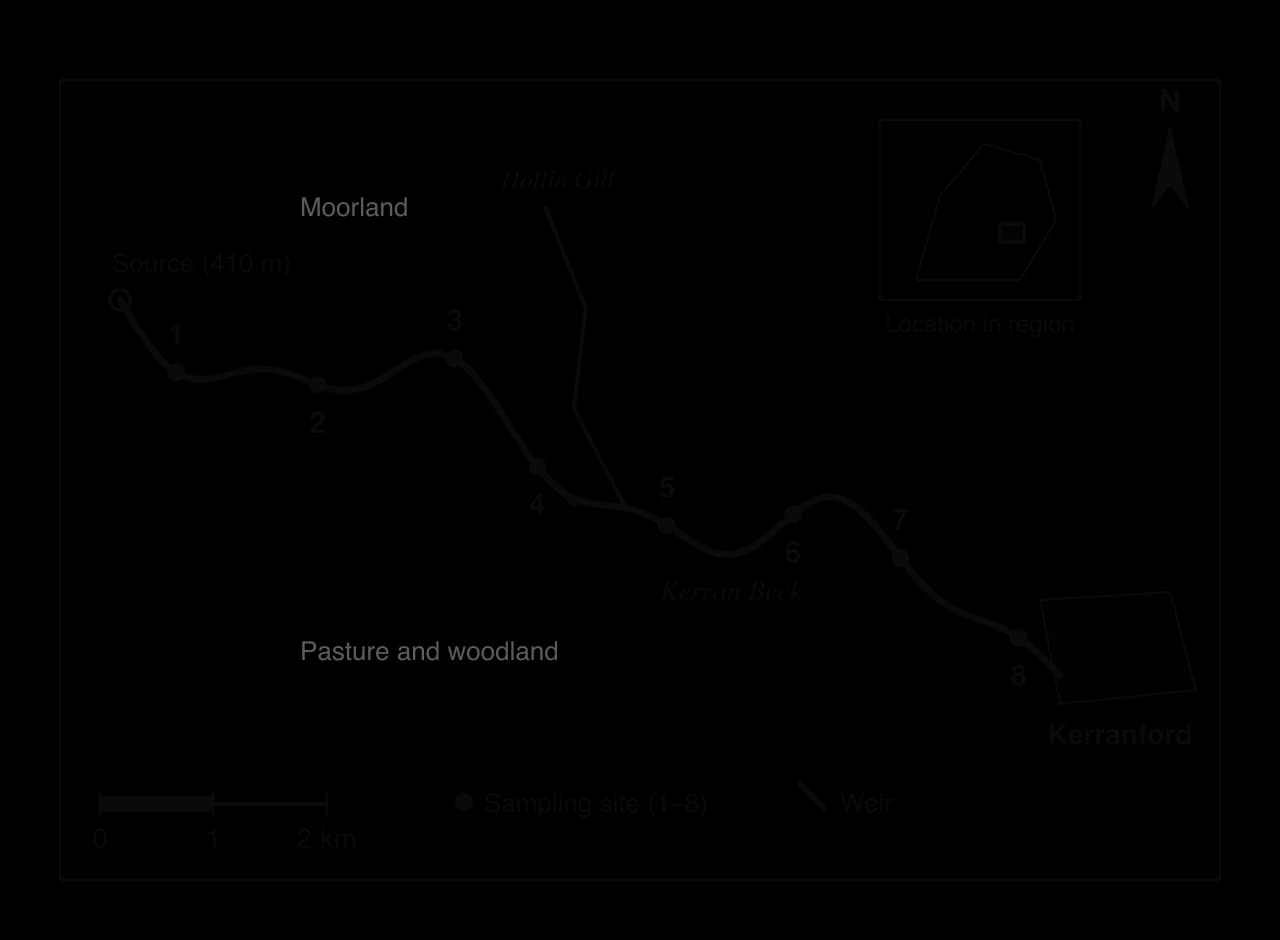
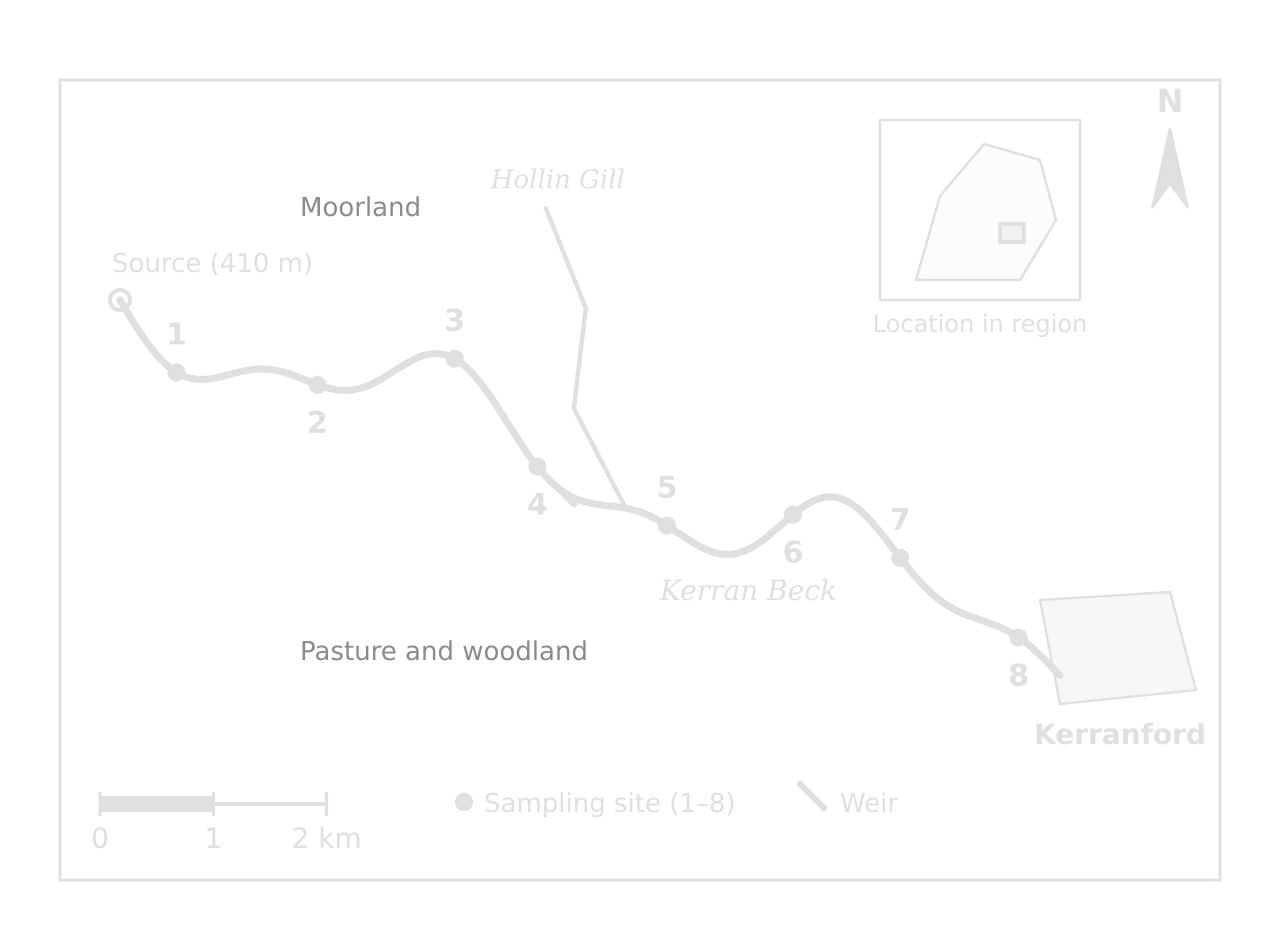
The location map is required for the top band of criterion A, and a missing or poor map is a common reason for losing a mark there. It should be your own map, drawn by hand or with GIS, showing the study area at a scale where every site can be seen and numbered, with an inset locating the area within its region or country. A downloaded map with hundreds of irrelevant details, no sites and no conventions earns little.
A location map needs | Why |
|---|---|
A title and figure number | Every figure is numbered and referred to in the text |
A north arrow and a scale bar | Mapping conventions; distances between sites can be read |
Every sampling site, numbered | Links the map to the data tables and graphs |
Only relevant features, labelled | Tributaries, weirs, land use, roads used for access; nothing that distracts |
An inset locator map | Places a small study area within its region or country |
A key and a source line | Explains symbols; says what the base map was adapted from |
Planning the data collection
Before going into the field, list every variable each hypothesis needs, how it will be measured, with what equipment and at how many sites. This plan becomes the methods section (criterion B), where each method is described and justified: why it was chosen and how it helps answer the question. Data are quantitative data (numbers from measurements and counts) or qualitative data (words, images and opinions), and many good investigations combine the two.
Qualitative data have their own value. Interviews explain why people behave as counts show they do, and an annotated photograph records the evidence for a judgment, such as the condition of a building. They can be coded into categories and counted when they need to be compared.
Variable | Method and equipment | Hypothesis | Justification |
|---|---|---|---|
Distance from source | Measured along the channel on a 1:25,000 map with a measuring wheel or GIS | All | The independent variable for every hypothesis |
Channel width | Tape measure across the water surface, bank to bank | H1 | Shows how the channel enlarges as discharge increases |
Depth | Metre rule at ten equal intervals across the channel | H1–H3 | Gives mean depth, cross-sectional area and the shape of the bed |
Surface velocity | Float (an orange) timed over 10 m, three times; or a flow meter | H2, H3 | Velocity × area = discharge; three runs reduce random error |
Wetted perimeter | Chain laid along the bed and banks from one water edge to the other | H3 | Needed for hydraulic radius, which explains velocity |
Gradient | Clinometer between two ranging poles 10 m apart | H3 | Tests whether a falling gradient slows the river |
Pebble size and shape | 15 pebbles per site: b-axis with callipers; roundness against a Powers chart | H4 | Tests whether load is worn down by attrition downstream |
Time, sites and circumstances
Record when and in what conditions the data were collected: the date, the time, the weather of the previous days and the river level. A river measured two days after heavy rain gives quite different values from the same river in a dry spell, and all sites should be measured within as short a period as possible so that the results can be compared. In human geography the same applies to the day of the week, the time of day and events such as markets or school holidays.
The pilot study
A pilot study is a short trial of the methods before the main collection, at one or two sites or with a few respondents. It shows whether the equipment works, how long each site takes, whether the sites are safe and accessible, and whether questionnaire questions are understood as intended. Changes made after the pilot, and the reasons for them, are worth a sentence in the methods section and in the evaluation.
Risk assessment and ethics
Fieldwork takes place in real environments, from riverbeds to busy streets, and every investigation needs a risk assessment before it starts. Schools follow their own risk-assessment procedures, and the teacher approves the plan; the student’s part is to identify the hazards of the chosen sites and methods and to plan how to reduce them.
Hazard | Risk | Control measures |
|---|---|---|
Deep or fast water | Falling, being swept off feet | Enter only below knee depth, never alone, in a group with a teacher; postpone after heavy rain |
Slippery rocks and banks | Slips, sprains | Wellingtons or boots with grip; choose sites with gentle access; avoid algae-covered rocks |
Water-borne infection | Illness from contaminated water | Cover cuts; no eating while working; wash hands afterwards |
Weather | Cold, heat, lightning | Check the forecast; suitable clothing, water and sun protection; stop in a storm |
Traffic (urban surveys) | Collision while counting or crossing | Stand away from the kerb; use pedestrian crossings; high-visibility vests |
Working with the public | Personal safety, conflict | Work in pairs in public places; carry identification and a letter from the school; be polite and leave if asked |
Ethics are part of the same planning. People who answer a questionnaire or an interview give informed consent: they are told who you are, what the survey is for and that they may refuse or stop at any time. Answers are kept anonymous, and no one is photographed in a way that identifies them without permission. Private land needs the owner’s permission, and fieldwork should leave no damage: pebbles returned to the river, vegetation not trampled, wildlife not disturbed.
Three more investigations from question to plan
The same planning steps apply to every kind of topic. Three invented outlines, one coastal, one urban and one on tourism, show how a question, its theory, its hypotheses and its methods fit together. All are invented examples, and each would need its own location map and risk assessment.
A coastal investigation: groynes and longshore drift
Question: How does the groyne field at the north end of a named beach affect beach width and sediment size along the beach? Theory: longshore drift moves sediment along the coast in the direction of the dominant waves, and a groyne traps sediment on its updrift side, starving the downdrift side. Hypotheses: beach width is greater on the updrift side of each groyne than on the downdrift side; mean sediment size is larger on the downdrift side, where finer material has been removed.
Methods: beach profiles on both sides of five groynes, measured at the same state of the tide; sediment samples of 20 pebbles at fixed points on each profile; wave direction recorded over the day; a field sketch of the groyne field. The data allow a paired comparison of updrift and downdrift sides and a test of difference between them.
An urban investigation: environmental quality from the centre
Question: How do environmental quality and land use change along a 3 km transect from the CBD of a named town to its southern suburbs? Theory: urban land-use models and the bid-rent idea predict commercial land at the centre and residential land outwards, with inner-city areas of older, denser housing that may score lower on environmental quality. Hypotheses: the share of commercial land use decreases with distance from the CBD; environmental quality scores increase with distance from the CBD.
Methods: systematic sites every 250 m along the transect; land use of every building frontage within 50 m of each site; an environmental quality survey on eight criteria at each site, scored by two people independently to reduce bias; a pedestrian count of ten minutes at each site; annotated photographs. The results suit a compound bar graph, a bipolar graph and a correlation test against distance.
A tourism investigation: pressure at a honeypot site
Question: How do visitor numbers, path erosion and perceptions of crowding change with distance from the car park along the main path at a named honeypot site? Theory: visitor pressure decreases with distance from access points, and carrying capacity is exceeded first where visitors concentrate. Hypotheses: path width and depth of erosion decrease with distance from the car park; the percentage of visitors who feel the site is crowded decreases with distance.
Methods: visitor counts at five points along the path at the same times on a weekday and a weekend day; path width and erosion depth measured every 100 m; a short questionnaire of visitors at three points, with a Likert scale for crowding. Mixing counts, measurements and perceptions gives an integrated investigation that links physical change to human behaviour.
Using secondary sources and references
Secondary sources play a supporting role. They can set the context (the population of the town, the geology of the drainage basin), allow a comparison (river gauge data for the day of fieldwork against the long-term average), or confirm the base map. They should never replace the primary data or make up a large part of the analysis.
Every source used is referenced in the text and listed at the end in a standard system such as Harvard: the author or organisation, the year, the title, the publisher or website, and for online sources the URL and the date accessed. Images and maps are credited in their captions, including base maps adapted from an online service. References, the title page, the contents page, map keys and labels of ten words or fewer are not counted in the word limit.
A timetable for the 20 hours
Stage | Approximate time | Output |
|---|---|---|
Choosing the topic and question; reading the theory | 2–3 hours | Question, hypotheses, list of variables |
Planning methods, sites and sampling; risk assessment; pilot study | 2–3 hours | Method table, recording sheets, location map draft |
Fieldwork (data collection) | 4–6 hours, often one or two days | Completed recording sheets, photographs, field sketches |
Processing data and making graphs and maps | 3–4 hours | Tables, statistics, numbered figures |
Writing analysis, conclusion and evaluation | 3–4 hours | First draft |
Revising after teacher comments; checking format and word count | 1–2 hours | Final report |
The first draft is the only one your teacher can comment on, so it should be complete: every section written, every figure in place. A partial draft wastes the one chance for advice.
Planning checklist
- To do:
My question is focused, geographical and names a precise local place.
- To do:
The question can be answered with primary data that I can collect safely in the time available.
- To do:
I can name the course topic and the theory or model the question tests.
- To do:
I have three or four hypotheses, each with two measurable variables and a direction, and matching null hypotheses.
- To do:
I have planned the variables, methods, equipment, sites and sampling, and can justify each.
- To do:
I have carried out a pilot study and adjusted the methods where needed.
- To do:
A risk assessment has been completed and approved, and I know how I will obtain informed consent.
- To do:
I have drafted a location map with a title, north arrow, scale, numbered sites, key and inset.
- To do:
I have recorded the date, time and conditions of data collection.
Carry on with Geography in Augment
With a free account, Augment remembers where you stopped in the notes and which questions you have marked.