Planning the scientific investigation
Turn a topic into a focused research question, then plan a valid, safe and ethical method with justified variables, controls, sampling, bias reduction and a pilot, ready for the research design criterion.
- IB Sports, Exercise and Health Science
- Internal assessment
- SL and HL
The scientific investigation is the internal assessment (IA) of the course: one open-ended investigation of a research question that you choose, design and carry out yourself, written up as a report. It is the same task at SL and HL, it is marked by your teacher against four criteria and then moderated by the IB. It contributes 24% of the final assessment at both levels.
Decisions made at the planning stage affect every criterion, not only research design: a focused question and a controlled, ethical, piloted method make the data analysis, conclusion and evaluation easier to do well. A hypothetical worked investigation into warm-up duration and jump height runs through the planning stage here, and continues in "Collecting and processing data" and "Writing the report and the assessment criteria".
What the scientific investigation is
The task is deliberately open: anything in sports, exercise and health science that can be answered with numerical data you can collect or obtain safely in about ten hours. The question need not go beyond the course content, but it must be specific enough for your data to answer and rich enough for all four criteria.
Requirement | What it means in practice |
|---|---|
One investigation, your own research question | Every student answers a unique question. You may not present the same raw data as another student. |
Quantitative data | The analysis must rest on numbers (measured, counted or extracted). Qualitative observations support them; a purely descriptive or interview-based study does not meet the task. |
At most 3,200 words | Charts, diagrams, data tables, equations, formulae and calculations, citations and references, the bibliography and headers are not counted. Everything else is. |
Start of the report | The title, your personal code (alphanumeric, for example xyz123), the codes of any group members and the word count. No cover page or contents page is needed. |
About 10 hours of class time | This covers explaining the task, planning, data collection, consultation with your teacher and writing. The design has to fit it. |
One draft | Your teacher reads one draft and gives oral or written advice, without editing it. The next version you hand in is the final one. |
Safety, ethics and environment first | These are considered, and checked with your teacher, before any data are collected, especially when people are measured. |
Your own work | Every source is referenced. Collaboration in small groups is allowed within set limits; collusion (sharing the writing, analysis or raw data of the report) is not. |
Ways of getting data
The investigation can be built on several kinds of data, alone or in combination. Primary data are measurements you make yourself; secondary data come from someone else’s collection, such as a published database or a results archive. Both are acceptable, and both need a methodology that someone else could repeat: for primary data, how you measured; for secondary data, how you selected, filtered and sampled.
Approach | What you do | SEHS example |
|---|---|---|
Laboratory work | Manipulate an independent variable under controlled conditions | Heart rate response to stepping at four step heights; grip strength after different rest intervals |
Fieldwork | Select variables in a real setting and measure them | Shot accuracy of a school basketball team in the first and last quarter of matches |
Database extraction | Select and filter data from an existing data set | Finishing times by age group from a city marathon’s published results; national physical activity statistics |
Spreadsheet modelling | Use equations to generate and analyse data | Modelling how release height changes the range of a shot put with a projectile spreadsheet |
Simulation | Run a model many times under different settings | A physics simulation of a ball’s flight at different spin rates |
Laboratory and field work with human participants needs the most care with ethics and control. Database, modelling and simulation studies avoid most ethical problems, but their design marks depend on how well you justify the data source, the sampling or the model’s assumptions.
Working alone or in a group
Collaboration is optional. Groups have at most three students, and each student still investigates an individual research question in one of three ways: a different independent variable from the other members, the same independent variable with a different dependent variable, or different data selected from a larger data set the group collected together. Group members can help each other collect data, but every student writes their own report, including their own description of the method.
A class or school may also collect a large shared data set using a standard protocol. A student who answers their question from such a data set is carrying out a database investigation: the method then explains how the data were filtered and sampled from the whole set, as it would for an external database.
Academic integrity
The report must be your authentic work. Every idea, value, figure or piece of text from another source is acknowledged with a citation detailed enough for the reader to find it, and unreferenced material is treated as malpractice. Your teacher authenticates every report, and may check it against your initial proposal, your draft, your references and your usual style of writing.
Using an AI tool or an online calculator to help you is subject to your school’s academic integrity policy: anything it produces that appears in your report must be acknowledged, and the thinking behind your design and conclusions must be your own. The same piece of work cannot be submitted for both the IA and the extended essay.
The four criteria at a glance
The report is marked out of 24, with four criteria worth 6 marks each: research design, data analysis, conclusion and evaluation. Each criterion has three bands (1–2, 3–4, 5–6) whose descriptors rise from "state" through "outline" or "describe" to "explain" or "justify". The diagram shows which stages of the investigation each criterion mainly rewards.
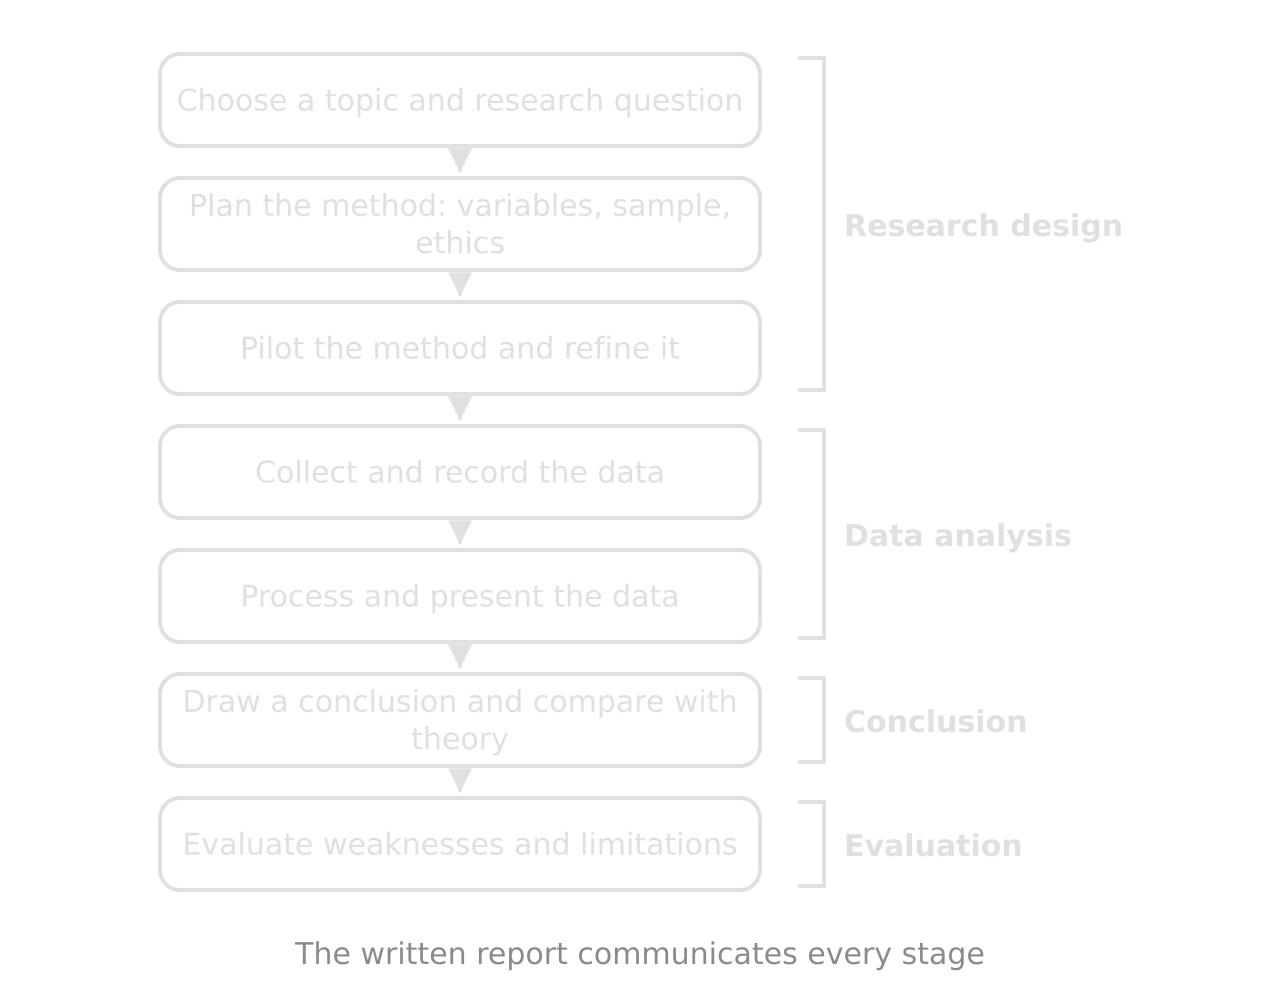
The criteria are marked independently, with a best-fit approach. "Writing the report and the assessment criteria" explains how the bands are applied and what each criterion rewards, with model extracts.
Choosing a topic
A good topic is one that interests you, connects to a clear piece of course theory and can be investigated with the equipment, participants and time you actually have. Start broad (warm-ups, hydration, practice schedules, ball bounce, anxiety in penalty kicks) and narrow it by asking what you could measure and change.
Theory: can you explain, with course concepts, why the independent variable should affect the dependent variable? Without a mechanism the background section has nothing to say and the conclusion has nothing to compare with.
Measurement: is the dependent variable measurable with precision you can state, using equipment the school has (stopwatch, heart rate monitor, jump mat, video at a known frame rate, dynamometer, questionnaire)?
Manipulation: can you change or select the independent variable over a sensible range, with at least four or five levels for a trend, or two clearly defined conditions for a comparison?
Participants and time: how many people can you test, how often, and can every session be done in comparable conditions within the ten hours?
Ethics and safety: can it be done without risk of harm, deception or pressure on participants? If the honest answer is "only with a doctor present", choose something else.
Writing a focused research question
A research question does three jobs. It tells the reader exactly what was changed and what was measured, it defines who or what was studied, so that the conclusion is not stretched beyond it, and it points to the theory that explains the expected result. The top band of research design asks for the question to be described "within a specific and appropriate context", which means all three jobs are done, either in the question itself or in the paragraphs that introduce it.
A reliable pattern is: What is the effect of [independent variable, with its levels or range and units] on [dependent variable, with how it is measured and its unit] in [population or system]? For a correlational design, the pattern is: What is the relationship between [variable 1] and [variable 2] in [population]? For a database study, name the database and the data selected.
Weak question | Why it is weak | Focused version |
|---|---|---|
Does warming up help performance? | No measurable variables, no levels, no population; "help" and "performance" are vague. | What is the effect of the duration of a standardised dynamic warm-up (0, 5, 10 and 15 min) on countermovement jump height (cm), measured with a contact mat, in recreationally active 16–17-year-old students? |
How does exercise affect heart rate? | Too broad: which exercise, what intensity, when is heart rate measured? | What is the effect of step height (15, 20, 25, 30 and 35 cm) during 3 min of stepping at 24 steps min⁻¹ on heart rate (beats min⁻¹) in the final 30 s, measured with a chest-strap monitor, in untrained adults aged 18–25? |
Is a basketball better when it is pumped up more? | "Better" is undefined; no measurement method. | What is the effect of inflation pressure (0.40, 0.50, 0.60, 0.70 and 0.80 bar) on the coefficient of restitution of a size 7 basketball dropped from 1.80 m onto a sports hall floor, measured from 240 fps video? |
Do people perform worse when they are watched? | No task, no measure of performance, no definition of "watched". | What is the effect of an audience (none vs ten classmates watching from 3 m) on free-throw success (number scored out of 20) in school basketball players aged 15–17? |
Does practising randomly help you learn? | Learning needs a retention test; "randomly" needs defining. | What is the effect of practice schedule (blocked vs random) on accuracy in a 24-hour retention test of three badminton serves (points on a target, out of 60) in novice players aged 16–17? |
Are fitter countries healthier? | Neither variable is defined; no data source. | What is the relationship between the prevalence of insufficient physical activity in adults (%) and the prevalence of diabetes in adults (%) in the 30 European countries with complete data in the WHO Global Health Observatory for 2016? |
A shorter question supported by a paragraph that defines the variables and the system is equally acceptable, as long as nothing is left vague.
Experimental, correlational and database questions
In an experimental design you change the independent variable yourself and measure its effect, so a clear difference allows a cautious claim about cause. In a correlational design you measure two variables as they occur (resting heart rate and estimated VO₂ max, training hours and reaction time) and test the strength of the relationship; the conclusion is about association, not cause. In a database design you select data that someone else collected, and your design marks depend on why that database is trustworthy and how you filtered and sampled it.
Background theory and hypotheses
Before you collect data, write down what you expect and why. The prediction comes from course theory (the energy systems, Newton’s laws, the inverted-U hypothesis) or published studies, and is specific enough that the data could show it to be wrong.
Statistical tests work with a pair of hypotheses. The null hypothesis states that there is no difference or no relationship, so that any pattern in the sample is due to chance. The alternative hypothesis states that there is a real difference or relationship. A test such as the t-test gives the probability of a difference at least as large as the one observed if the null hypothesis were true; if that probability is below 0.05, the null hypothesis is rejected and the alternative is supported.
Variables
Every SEHS investigation has variables that you change, measure and hold constant. Naming them precisely, with units and how each is measured or controlled, is the core of the research design criterion.
An independent variable needs a range (the lowest and highest values), an interval (the steps between them) and a precise definition of each level. A dependent variable needs a measurement method, an instrument with a stated resolution and a decision about how many repeats are taken and how they are combined (mean of three, best of three). Control variables need a justification (why they would affect the DV) and a method of control (how they were kept constant, or monitored and recorded if they could not be).
Control variable | Why it could affect jump height | How it was controlled |
|---|---|---|
Jump technique | Arm swing increases jump height, and the amount varies between attempts | Hands on hips throughout; jumps with arm movement repeated |
Landing position | Landing with bent knees lengthens flight time, so the mat overestimates height | Instructed to land with straight legs, then bend; observed and recorded |
Prior exercise | Fatigue from training lowers power | No strenuous exercise in the 24 h before each session (checked verbally) |
Time of day | Body temperature and power vary across the day | All sessions at the same lesson time (10:00 ± 1 h) |
Footwear and surface | Different shoes change grip and cushioning | Same training shoes each session; mat on the same hard floor |
Caffeine and food | Caffeine can increase power; a large meal can cause discomfort | No caffeinated drinks in the 3 h before testing; light meal at least 2 h before |
Motivation and feedback | Encouragement and seeing others’ scores change effort | Same scripted instruction and one standard phrase of encouragement; scores not shown to participants until the study ended |
Room temperature | A cold room slows the rise in muscle temperature | Not controllable; measured each session (19–22 °C) and recorded |
The last row shows an important point: some variables cannot be controlled in a school, and the honest response is to monitor and record them so that their possible effect can be judged in the evaluation.
Confounding variables are the main threat to a fair test with human participants. If all the 15 min warm-up sessions were done on Friday afternoons after a games lesson, fatigue would change with the condition, and any difference in jump height could be due to either. Human factors that commonly confound SEHS studies include sleep, hydration, food and caffeine intake, prior exercise, illness, the menstrual cycle, motivation, learning and familiarity with the test, and the time of day.
Designing a valid and reliable method
A method is judged on two qualities. It should measure what the research question is about, and it should give the same result when repeated under the same conditions.
Validity is threatened when the measurement does not match the concept (a sit-and-reach test used as a measure of "flexibility" in general, when it mainly reflects hamstring and lower-back range of motion) or when an uncontrolled variable explains the result. Reliability is threatened by anything that adds random variation: an inconsistent technique, a hand-timed stopwatch, a participant who is distracted. A measurement can be reliable without being valid: a bathroom scale that always reads 2 kg too high is consistent but wrong.
Range, interval and number of levels
For a trend, use at least five levels of the independent variable if you can, spread evenly across a range wide enough to show a pattern but within what is safe and realistic. Four levels is a reasonable minimum when each level costs a separate testing session, as in the warm-up investigation. Two levels (a comparison) suit questions about the presence or absence of something (music or no music, audience or no audience) and are analysed with a t-test.
Justify the range with theory or practice: 0–15 min covers the warm-ups used before most school and club sport; 0.40–0.80 bar spans pressures either side of a ball’s recommended value.
Repeats and sample size
Repeated trials reduce the effect of random error on each participant’s score, and more participants make the mean a better estimate of the population’s. In SEHS, a common compromise is three trials per participant per condition and as many participants as can be tested in comparable conditions, often 10–20. Repeats have a cost: too many maximal jumps or sprints cause fatigue, and too many trials of a skill cause learning, both of which change the dependent variable.
A pilot study is the place to decide the number of repeats. If three jumps by the same person in the same condition differ by only 1–3% (a small coefficient of variation), three trials are enough; if they differ by 10%, the technique needs standardising before more repeats will help.
Choosing and checking instruments
What is measured | Common school instrument | Resolution | Points to control or check |
|---|---|---|---|
Heart rate | Chest-strap monitor | 1 beat min⁻¹ | Strap moistened and fitted; wrist optical sensors are less accurate during movement |
Time | Stopwatch; timing gates; video | 0.01 s; 0.001 s; 1 frame | Reaction time at the start and finish makes hand timing uncertain by about 0.1–0.2 s |
Jump height | Contact mat; jump app on video; chalk on a wall | 0.1 cm; 1 frame; 1 cm | Mat and app use flight time and assume the same body position at take-off and landing |
Force or grip strength | Handgrip dynamometer | 0.5 or 1 kg | Same grip setting and arm position each time |
Exertion | Borg RPE scale (6–20) | 1 point | Scale and instructions read out the same way |
Psychological state | Validated questionnaire | Scale points | Use a published, validated version and its scoring; translation changes validity |
Angles and positions | Video at a known frame rate with motion-analysis software | About 1°; 1 frame | Camera perpendicular to the plane of movement, with a scale object in view |
Calibration is quick and is often forgotten. Weigh a known mass on the scales, check a stopwatch against a phone clock over 60 s, zero a dynamometer, put a metre rule in the video frame for scale, and check that a heart rate monitor agrees with a manual pulse count at rest. Record that you did it: a single sentence in the method shows the moderator that systematic error was considered before it could happen.
Reducing bias
Bias is a systematic tendency for results to come out one way for reasons other than the independent variable. Several standard techniques reduce it, and naming and justifying the ones you used is part of explaining your methodological considerations.
Sampling and allocation
Random sampling gives every member of the target population an equal chance of being chosen, so that the sample is likely to represent the population. In a school it is rarely possible: most investigations use volunteers, an opportunity sample. That is acceptable if you describe the sample honestly (age, sex, activity level, recruitment) and limit the conclusion to similar people.
Random allocation is different and almost always possible. When participants are split into groups or put into an order of conditions, draw the codes from a hat or use a random number generator, so that differences between groups cannot come from your choices.
Cross-over designs and order effects
Between-participant differences in SEHS are large: in the worked investigation, the jump heights of different students range from about 25 cm to about 45 cm. If one group did the warm-up and another did not, a small warm-up effect would be lost in that variation. A cross-over design compares each participant with themselves, which removes the between-participant variation from the comparison and makes a small sample far more powerful.
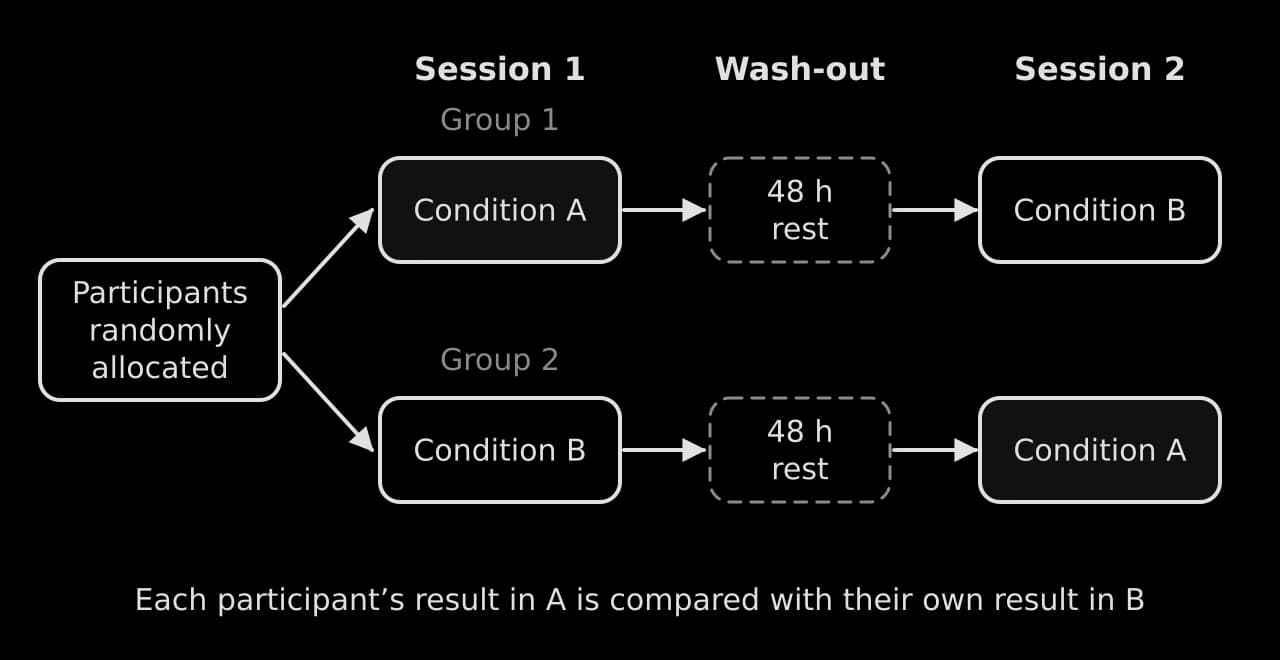
The cost of a cross-over design is the order effect. Participants may jump higher in their fourth session simply because they have practised. Two techniques deal with it: a familiarisation session before testing, so that most early learning happens before data are recorded, and counterbalancing, so that each condition appears equally often in each position. With four conditions, a Latin square gives four orders in which every condition occupies every position once.
Order (3 participants each) | Session 1 | Session 2 | Session 3 | Session 4 |
|---|---|---|---|---|
Order 1 | 0 min | 5 min | 15 min | 10 min |
Order 2 | 5 min | 10 min | 0 min | 15 min |
Order 3 | 10 min | 15 min | 5 min | 0 min |
Order 4 | 15 min | 0 min | 10 min | 5 min |
Sessions also need a wash-out period long enough for the previous condition’s effect to disappear: 48 hours is ample after a warm-up.
Blinding and the placebo effect
Expectations change performance. The placebo effect is an improvement caused by a participant’s belief that they have received an active treatment. If participants know they are getting a sports drink and believe it helps, they may try harder. Blinding prevents this: a taste-matched drink without carbohydrate can be compared with the real drink, prepared by someone else so that neither participant nor tester knows which is which until the data are recorded.
Many SEHS investigations cannot be blinded: a participant always knows whether they warmed up for 15 minutes. In that case, reduce expectation effects in other ways. Do not tell participants the hypothesis until the end, give identical instructions in every condition, keep the tester’s encouragement scripted, and use a measuring instrument that records automatically rather than one the tester reads.
Safety, ethics and the environment
Investigations with people must protect them, and the protection is planned and approved by your teacher before data collection begins. This is not a formality: the research design descriptors include the recognition of safety, ethical and environmental issues, and a report that measures participants without describing consent and screening loses marks as well as breaking school rules.
Informed consent. Give every participant a short information sheet and a consent form to sign before testing. Participants under 18 normally also need written consent from a parent or guardian, and your school may have its own approval procedure: follow it.
Health screening. Use a Physical Activity Readiness Questionnaire (PAR-Q), a form of pre-participation screening, to identify anyone for whom exercise could be unsafe (heart conditions, chest pain, dizziness, joint problems, current injury). Anyone who answers "yes" to a question does not take part unless cleared by a doctor.
Right to withdraw. Participants can stop at any point, during a session or afterwards, without giving a reason and without any consequence; their data are then deleted if they ask. Say this in the information sheet and again before each session.
Anonymity and confidentiality. Replace names with codes (P01, P02 …) on every data sheet, store the key separately and securely, and never publish photographs or video in which participants can be identified without separate consent.
No harm. Exclude procedures that could injure or distress: maximal tests to exhaustion without supervision, dehydration, heat exposure, fasting, supplements or caffeine given to minors, deception about risks, and anything that embarrasses participants in front of their peers.
No pressure. Classmates may feel obliged to take part. Recruit in a way that makes saying no easy, and never make participation part of a grade.
Debriefing. At the end of the study, explain its purpose and hypothesis, and offer each participant their own results.
Safety covers the tester and the environment too: a warm-up and cool-down where exercise is vigorous, a clear space with a non-slip surface, a first-aider available, equipment checked before use and hygiene for shared mouthpieces or straps. Environmental issues are usually small in SEHS (reusing equipment, avoiding single-use cups, printing little), but mention what applies.
Risk in the warm-up investigation | Control |
|---|---|
Muscle strain during maximal jumps | Two submaximal practice jumps before the recorded jumps in every condition, including 0 min; anyone with a lower-limb injury in the last 3 months excluded |
Slipping on the mat | Mat taped to a dry, hard floor; training shoes worn |
Undetected heart condition | PAR-Q completed; any "yes" answer excluded |
Pressure to perform or to take part | Volunteers only; scores not shown to others; right to withdraw explained before every session |
Loss of personal data | Coded data in a password-protected school account; consent forms kept by the teacher |
Piloting the method
A pilot study with one or two people outside the main sample shows whether the instructions are understood, whether the equipment records what you expect, how long each session takes, whether the range of the independent variable produces a measurable change and how much the repeated trials vary. Report briefly what it showed and what you changed: direct evidence of explained methodological decisions.
Pilot finding (warm-up investigation) | Change made |
|---|---|
Both pilot participants swung their arms on some jumps | Hands-on-hips rule added; any jump with arm movement repeated |
30 s between jumps felt tiring and heights fell on the third jump | Rest increased to 60 s between jumps |
One landing with bent knees gave an unusually high reading | Landing instruction added and every landing observed |
The 15 min condition plus testing took 26 min | Sessions booked for the full 40 min lesson |
Three jumps in one condition varied by about 2% | Three trials judged sufficient; mean of three used |
Worked investigation: planning (hypothetical)
The investigation followed through the three internal assessment pages is invented for teaching. Its numbers are realistic but hypothetical, and they were generated to show the decisions and calculations a strong report makes. Its design has been built up in pieces so far; here it is brought together as it would appear in the research design part of a report.
Research question and context
Research question: What is the effect of the duration of a standardised dynamic warm-up (0, 5, 10 and 15 min) on countermovement jump height (cm), measured with a contact mat, in recreationally active 16–17-year-old students?
System and context: the countermovement jump is a standard field test of lower-body power and is the movement pattern of a rebound in basketball, a block in volleyball and a header in football. Coaches of school teams often have only a few minutes before a match, so whether a 5 min warm-up gives most of the benefit of a 15 min one is a practical question for performance, and a warm-up that reduces the risk of strain injury matters for health.
Background theory: a warm-up raises muscle temperature. Warmer muscle conducts nerve impulses faster, cycles cross-bridges faster and is less viscous, so it develops force more quickly; dynamic drills also rehearse the coordination of the jump and may increase motor unit recruitment. The background cites a published meta-analysis of warm-up studies and a review of dynamic stretching research, both listed in full in the bibliography, so that the comparison in the conclusion is traceable.
Hypotheses: H₀: there is no difference in mean jump height between 0 min and 10 min of warm-up. H₁: mean jump height is greater after 10 min of warm-up than after none. The prediction for the whole range is a rise up to about 10 min, then a plateau.
Participants
Twelve volunteers (six female, six male) aged 16–17, recreationally active (at least 2 h of sport per week), with no lower-limb injury in the previous 3 months and no "yes" answer on the PAR-Q. They were recruited from two IB classes by an announcement; nobody was approached individually. Each participant and a parent or guardian signed an information and consent form, and participants were coded P01–P12.
Variables
Variable | Definition | How it is measured or set |
|---|---|---|
Independent | Duration of a standardised dynamic warm-up: 0, 5, 10, 15 min | One 5 min block repeated 0, 1, 2 or 3 times, timed with a stopwatch (±0.01 s) |
Dependent | Countermovement jump height (cm), mean of three jumps | Contact mat and app: flight time to 0.001 s, height to 0.1 cm |
Monitored | Heart rate before the jumps; room temperature | Chest-strap monitor (1 beat min⁻¹); thermometer (±0.5 °C) |
Controlled | Technique, landing, time of day, prior exercise, caffeine and food, footwear, encouragement | Each kept constant by a rule in the method (steps 3 and 7) |
The 5 min warm-up block is: 2 min of jogging around a 20 m lane at a rating of perceived exertion (RPE) of 11–13 on the Borg scale, then 3 min of dynamic drills (10 forward-and-back leg swings on each leg, 10 walking lunges, 20 m of high knees, 20 m of heel flicks and 10 squats into calf raises). Defining the block exactly is what makes "duration" a valid independent variable: a longer warm-up is more of the same activity, not a different activity.
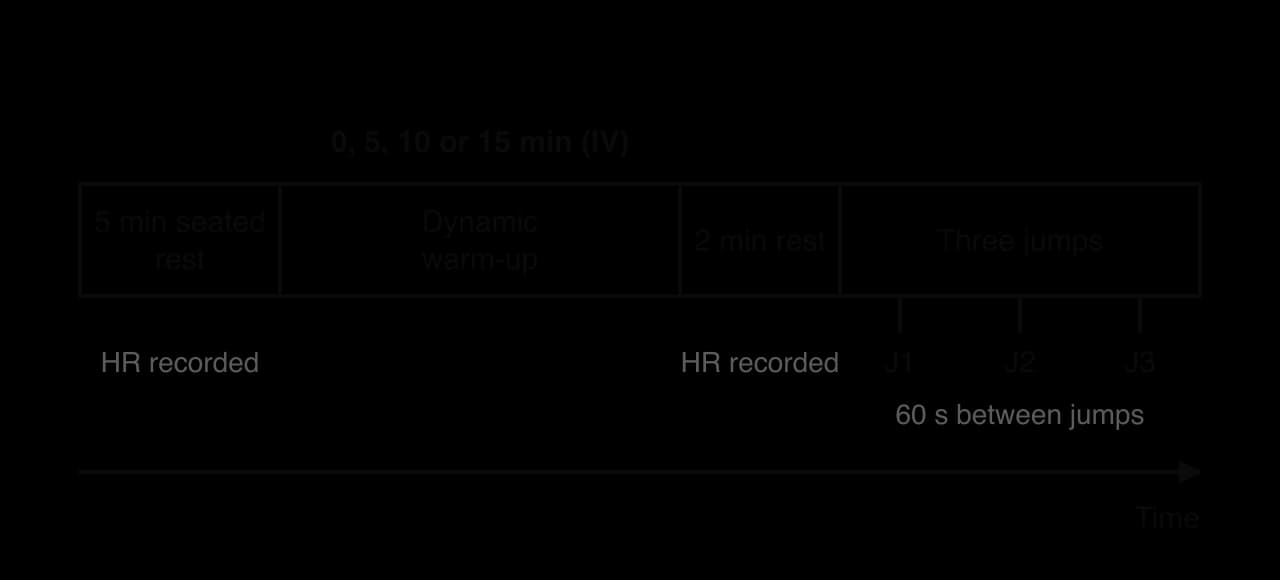
Method
Familiarisation session (one week before testing): explain the study, collect consent forms and PAR-Qs, and teach the jump. Each participant practises five jumps on the mat with feedback; these are not recorded.
Allocate participants to the four orders of the Latin square by drawing their codes at random (three per order).
Hold four test sessions per participant, at least 48 h apart, at 10:00 ± 1 h. Before each, confirm verbally: no strenuous exercise in the previous 24 h, no caffeinated drink in the previous 3 h, a light meal at least 2 h before, the usual training shoes.
Record room temperature. The participant sits for 5 min; record heart rate at the end of the rest.
Carry out the warm-up for that session’s duration (0, 5, 10 or 15 min), timed with a stopwatch. In the 0 min condition the participant remains seated.
Rest standing for 2 min; record heart rate at the end.
Perform two submaximal practice jumps, then three maximal countermovement jumps 60 s apart: start upright on the mat with hands on hips, bend the knees rapidly to a self-chosen depth, jump as high as possible, and land on the mat with straight legs before bending. Read the same instruction from a script before every jump.
Record each height (0.1 cm) on the coded data sheet. Repeat any jump with arm movement or a landing off the mat, and note it.
Record qualitative observations: technique faults, comments about soreness or tiredness, anything unusual in the session.
Cool down with 3 min of walking and light stretching.
Planning checklist
Work through the list before the first data collection session. Every item that is not yet ticked is something a moderator would notice.
- To do:
My research question names the independent variable with its levels or range and units.
- To do:
It names the dependent variable, how it is measured and its unit.
- To do:
It defines the population or system, and the background explains the theory that links the two variables.
- To do:
I have a prediction with reasoning, and a null and an alternative hypothesis that one statistical test can decide between.
- To do:
Every important control variable is listed with why it matters and how it is controlled or monitored.
- To do:
I have justified the range, interval, number of repeats and sample size.
- To do:
My instruments are chosen, their resolution is stated and they have been calibrated or checked.
- To do:
I have used random allocation, counterbalancing, familiarisation and blinding wherever they apply, and said why where they do not.
- To do:
Participants (and parents for under-18s) have given informed consent, completed a PAR-Q, been coded and told of their right to withdraw.
- To do:
Safety risks and environmental issues are identified with a control for each.
- To do:
I have piloted the method and recorded what I changed.
- To do:
My method is a numbered sequence that someone else could repeat.
Carry on with SEHS in Augment
With a free account, Augment remembers where you stopped in the notes and which questions you have marked.