The scientific investigation
What the internal assessment is, how its four criteria award 24 marks, the rules on length, groups and integrity, and a timeline from first idea to final report.
- IB Physics
- Internal assessment
- SL and HL
The internal assessment in IB Physics is a scientific investigation: an open-ended piece of research in which each student asks their own research question, designs a way to collect or select data to answer it, analyses the data with their uncertainties, and writes a report that justifies a conclusion and evaluates the method. It is the same task, marked against the same criteria, at SL and HL. The report is marked by the student's teacher, and a sample from each school is then re-marked by an external moderator, a process called moderation, so that standards are consistent worldwide.
The investigation rewards the skills of a working physicist rather than recall: choosing a question that can actually be answered, measuring carefully, handling uncertainty honestly and reasoning from evidence. Those same skills are tested in Paper 1B, so the work done for the internal assessment also prepares students for the data-based questions in the written papers.
What the investigation is
An investigation begins with a question about how one physical quantity depends on another, or about how two quantities are correlated in data that cannot be controlled directly, such as values taken from a database. Many physics investigations use that relationship to find the value of a physical constant or property from the gradient of a graph. The student chooses the question, usually after a period of reading and trying out ideas, and the teacher acts as a supervisor who checks that it is safe, practical and appropriate. Each student formulates, investigates and answers a unique research question, and must collect and analyse quantitative data, supported by qualitative observations where they help. Repeating a standard class practical with no change in focus rarely gives the depth the top markbands expect.
About 10 hours of teaching time are recommended for the whole process. This time covers the teacher's explanation of the task, class time to work on the investigation and ask questions, consultation between the teacher and each student, and the checking of progress and authenticity. Much of the writing usually happens outside these hours. Ten hours is not long, so the most successful investigations are small and focused: one independent variable, one dependent variable and a well-controlled method that can be completed in a few lab sessions.
Kinds of investigation
Data can come from several kinds of source. The approach is chosen to suit the question, and approaches can be combined.
Approach | Where the data come from | Physics example |
|---|---|---|
Hands-on experiment | Measurements made by the student in the laboratory, at home or in the field | The period of a vibrating steel rule measured from slow-motion video |
Fieldwork | Measurements made outside the laboratory, where the student selects the conditions rather than setting them | Measuring how the speed of water waves at a beach or pond depends on the depth of the water |
Database | Values selected from a published data set (secondary data) | Testing how orbital period depends on orbital radius for the moons of Jupiter, from a planetary database |
Simulation | Results generated by a computer model that the student controls | Investigating how the range of a projectile depends on launch angle when fluid resistance is included |
Spreadsheet analysis and model | A model built by the student from physical equations, often tested against real data | Modelling the cooling of a cup of water step by step and comparing the model with measured temperatures |
Combination | Two or more of these approaches, used together | Measuring the speed of water waves in a tray and comparing the results with a simulation of shallow-water waves |
Every approach is assessed against the same criteria. A database or simulation investigation still needs a clear research question, a justified way of selecting or generating the data, attention to uncertainty and a critical evaluation, so it is not an easier option.
The four criteria at a glance
The report is marked out of 24 using four criteria, each worth 6 marks. The criteria follow the stages of scientific inquiry: exploring and designing, collecting and processing data, and concluding and evaluating.
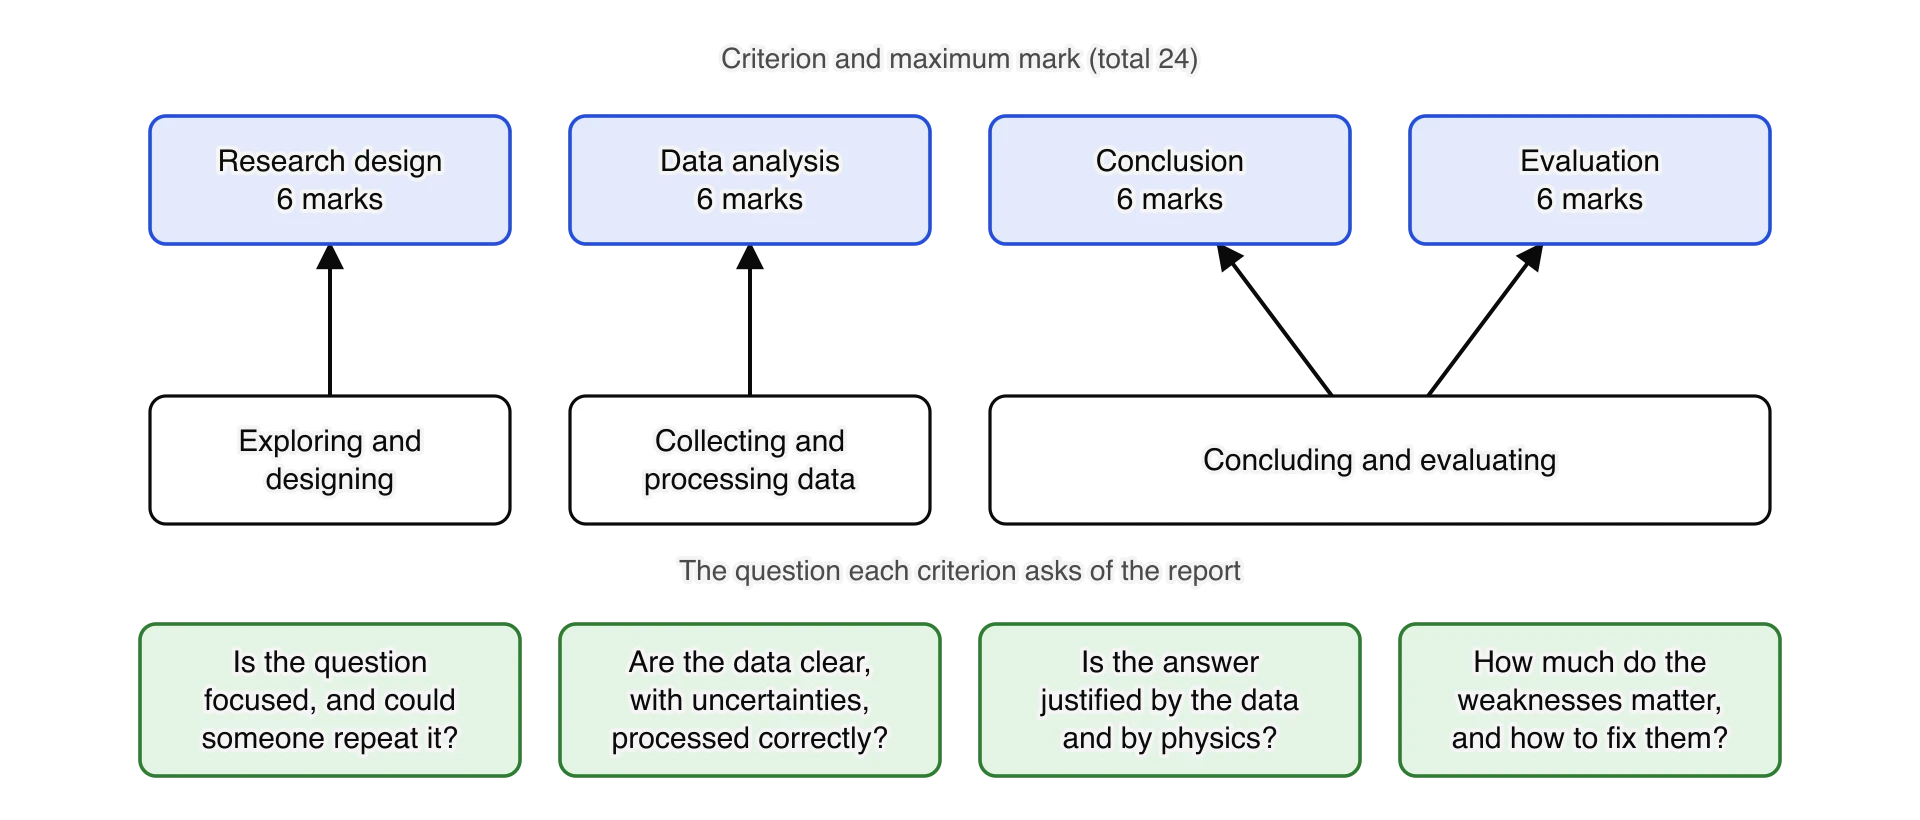
Each criterion has three markbands, 1–2, 3–4 and 5–6, plus 0 for work that does not reach the lowest band. A markband is a short description of a level of performance. The teacher reads the whole report, decides which band describes it best (the "best fit"), and then chooses the higher or lower mark in that band depending on how fully the work matches the description.
What each criterion rewards
The table paraphrases what separates the bands. The words that change from band to band matter: in the IB command terms, "state" means a brief answer, "describe" a detailed account, and "explain" an account with reasons.
Criterion | Lower band (1–2) | Middle band (3–4) | Top band (5–6) |
|---|---|---|---|
Research design: the question, its context and the method | The question is stated with no context. Some methodological points are listed. The method could not be repeated from the description. | The question sits in a broad context. The methodological choices for collecting relevant, sufficient data are described. The method could be repeated with a few gaps or ambiguities. | The question sits in a specific, appropriate context. The methodological choices for collecting relevant, sufficient data are explained. Another person could repeat the method from the description. |
Data analysis: recording and processing | Recording and processing are neither clear nor precise. Uncertainties are barely considered. Some relevant processing, with major omissions or errors. | Recording and processing are clear or precise, but not both. Uncertainties are considered, with significant gaps. Relevant processing, with some significant omissions or errors. | Recording and processing are clear and precise. Uncertainties are considered appropriately. The processing that answers the question is done accurately. |
Conclusion: the answer and its support | A relevant conclusion is stated but the analysis does not support it. Comparison with accepted science is superficial. | A relevant conclusion is described but is not fully consistent with the analysis. Some relevant comparison with the accepted scientific context. | A relevant conclusion is justified and fully consistent with the analysis. It is justified through relevant comparison with the accepted scientific context. |
Evaluation: weaknesses and improvements | Generic weaknesses or limitations are stated, with realistic improvements stated. | Specific weaknesses or limitations are described, with relevant realistic improvements described. | The relative impact of specific weaknesses or limitations is explained, with relevant realistic improvements explained. |
Two patterns run through the table. First, each step up asks for more reasoning: a listed point becomes a described one, and a described one becomes an explained one. Second, the top band always asks for specifics tied to the student's own investigation, such as the actual context of the question, the actual uncertainties in the data and the actual size of each weakness's effect.
How the criteria depend on each other
A focused research question with a clear independent and dependent variable (Research design) determines what processing is needed (Data analysis).
Uncertainties carried through the processing (Data analysis) let the conclusion say whether a result agrees with theory or an accepted value (Conclusion).
Knowing the size of each uncertainty, and whether the result is above or below the accepted value, shows which weaknesses matter most (Evaluation).
A method described in enough detail to be repeated (Research design) gives the evaluation something specific to criticise.
The rules
The IB sets a small number of firm rules for the investigation. Schools add their own deadlines and procedures, but these apply everywhere.
Rule | What it means in practice |
|---|---|
The report is at most 3,000 words. | Material beyond the limit is not read by the moderator, so it cannot earn marks. Concise writing is part of the task. |
Some content does not count towards the limit. | Charts and diagrams (graphs included); data tables; equations, formulae and calculations; citations and references, whether in brackets, numbered, footnotes or endnotes; the bibliography; and headings are not counted. |
The start of the report carries four items. | The title, the student's personal code (for example xyz123), the personal codes of any group members, and the word count. No cover page or contents page is needed. |
Each student writes their own report. | Even after working in a group, the research question, analysis, conclusion and evaluation are individual. |
Groups are optional and have at most three students. | Group members may share a set-up and help each other take readings, but each must investigate their own research question. |
The work must be the student's own. | All sources, including methods, data, images and AI-generated material, are acknowledged. The student confirms that the submitted report is their own authentic work and the final version. |
The investigation must be safe and ethical. | Safety, ethical and environmental issues are considered before any data are collected. |
What counts towards the word count
Most of the 3,000 words go on the explanation: the background and context of the question, the justification of the method, the commentary on the data and graphs, the conclusion and the evaluation. Tables and graphs are free, which encourages presenting data in tables rather than describing it in sentences. Calculations are free as well, but a single worked calculation with a sentence of explanation is clearer than pages of repeated arithmetic; one example of each type of calculation, with the rest in a table, is enough.
Headings do not count, but a label or caption that explains a table or graph in several sentences is part of the text. A table that is really a paragraph in disguise, such as an evaluation written as long sentences in table cells, counts as words.
Working with others
Students may plan and carry out practical work together in groups of up to three. Collaboration helps when an experiment needs one person to release a trolley while another films it, or when a set-up takes a lesson to build. The rules make sure that each report is still an individual investigation.
Each student has their own research question.
Each student investigates either a different independent variable from the other group members, or the same independent variable with a different dependent variable.
No two students use the same set of raw data. A class or group may build a large shared data set, but each student then selects different data from it, and the investigation is treated like a database investigation.
Every part of the report is written individually, including the description of the method.
The personal codes of the other group members go at the start of the report.
Academic integrity
Academic integrity means that all the work presented as the student's own is genuinely theirs, and that every idea, method, value, image or piece of text from elsewhere is acknowledged. Using a method from a textbook or website is allowed, provided it is referenced and, ideally, adapted to the student's own question. Values used for comparison, such as an accepted value of a constant, are cited so that the reader could find them.
Plagiarism includes copying another student's report or data (from this year or any previous one), using a writing service, copying text or images from a source without acknowledgement, and paraphrasing a source's ideas without citing it. Any referencing style may be used, provided it is used consistently. Teachers check authenticity by discussing the work with the student, asking them to explain their method or results, and using text-matching software.
Artificial intelligence tools are treated like any other source. If an AI tool produced text, an image, code for a spreadsheet or an idea used in the report, that use is acknowledged in the text and in the bibliography. Presenting AI-generated material as the student's own work is academic misconduct.
Safety, ethics and the environment
Before any practical work, the student identifies the hazards in the method (anything that could cause harm), judges the risk of each, and plans how to reduce it. This risk assessment is shared with the teacher, who approves the investigation before it starts. Physics investigations often involve mains electricity, hot water, heavy masses, high-speed moving parts, lasers, radioactive sources and sharp tools, each with its own standard precautions.
Ethical issues arise mainly when people or animals are involved. An investigation that measures human reaction time or uses volunteers needs their informed consent, the right to stop at any time and no risk of harm. The environmental impact of the work (waste materials, batteries, energy use) is considered too. Where there are genuinely no safety, ethical or environmental issues, as in a database or simulation investigation, the report says so in a sentence and explains why.
Timeline: from idea to final report
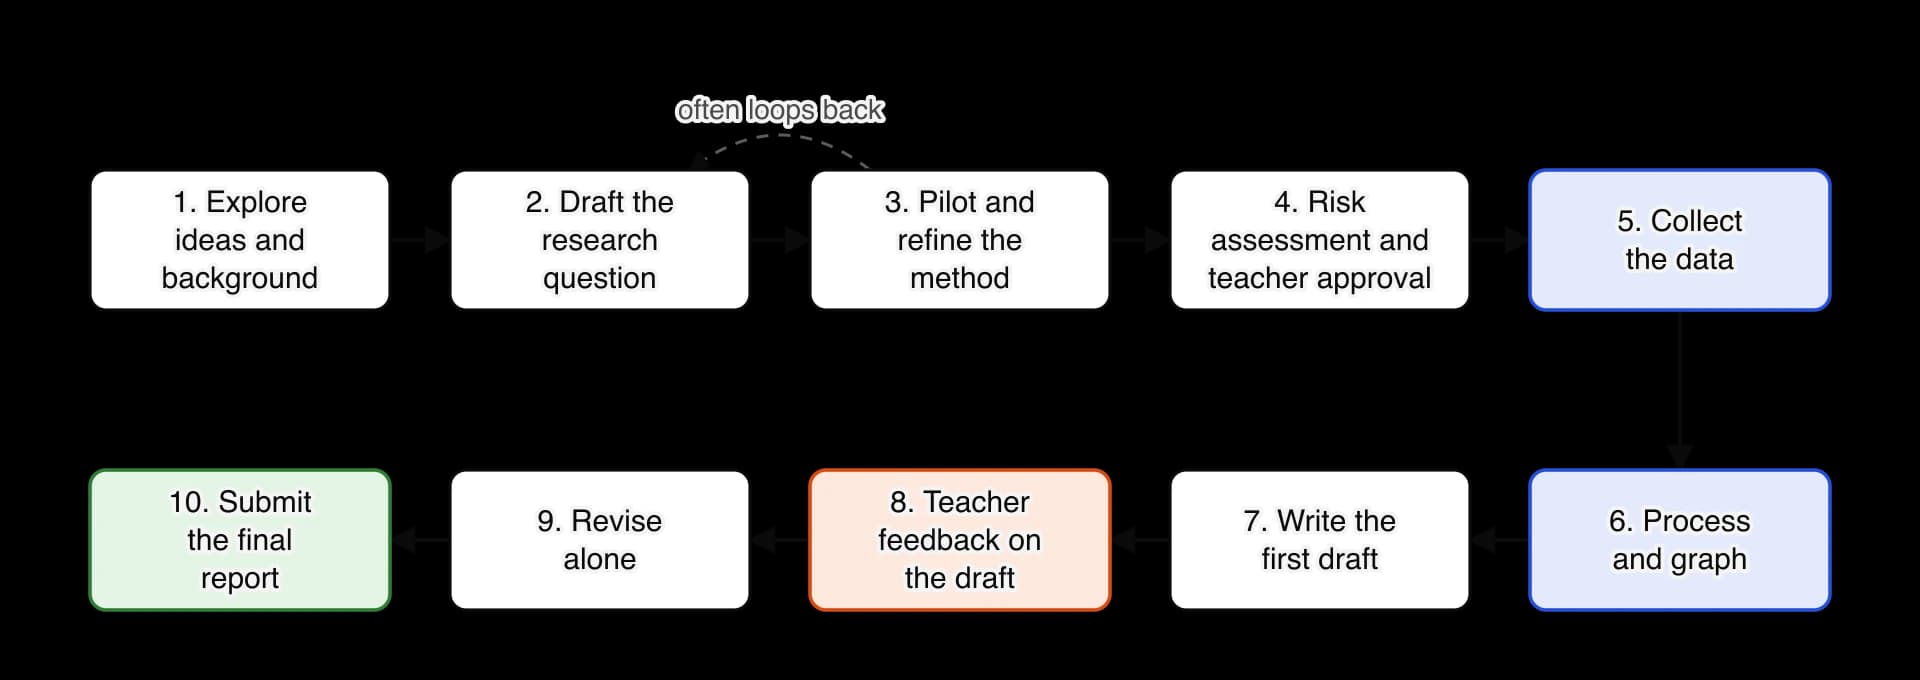
Schools set their own internal deadlines, but every investigation passes through the same stages. Most schools spread them over several months of the first and second year of the course, with the data collection packed into a few lab sessions.
Stage by stage
Explore. List topics from the course that were interesting, read around them, and note which quantities could be measured with the equipment available. A short list of three or four possible questions is better than one.
Draft the research question. Name the independent and dependent variables, the system and the range to be tested. Write down the relationship that theory predicts.
Pilot. Try the method quickly with a few values across the range. Piloting shows whether the dependent variable changes measurably, how big the random scatter is, and what the practical limits of the range are. It often changes the question.
Plan and assess risks. Fix the range, the number of values, the number of repeats and how each control variable will be kept constant. Complete the risk assessment and get the teacher's approval.
Collect the data. Record every raw reading straight into a table with units and uncertainties, along with notes on anything unexpected. Plot a rough graph as the data come in, so that gaps and anomalies are spotted while there is still time to repeat them.
Process and graph. Calculate means and uncertainties, propagate uncertainties into the processed values, and draw the graph that tests the research question, with error bars and a line of best fit.
Write the first draft. Write all the sections: introduction and background, method, data and analysis, conclusion and evaluation, references.
Get feedback. The teacher gives general comments on the draft once.
Revise. Act on the comments independently, cut the text to within 3,000 words and check every number, unit and reference.
Submit. Hand in the final report and confirm that it is the student's own authentic work. Once submitted, the final version cannot be withdrawn.
A sensible structure for the report
The criteria do not prescribe headings, but a structure like that of a short research paper (without an abstract) helps a reader find each part. Typical sections and an approximate share of the words are:
Section | Content | Approximate words |
|---|---|---|
Introduction and research question | Why the question is interesting, and the question itself | 150–250 |
Background theory | The physics behind the question, the predicted relationship and how the graph will test it | 300–500 |
Variables and method | Independent, dependent and control variables (often in a table), apparatus with a labelled diagram, the procedure, and the reasons for the choices made | 500–700 |
Safety, ethics and environment | Hazards and precautions, or a statement that there are none | 50–150 |
Data and processing | Raw data table, a sample calculation of each type, processed data table, graphs, commentary | 300–500 |
Conclusion | The answer to the question, justified with the processed data, their uncertainties and the scientific context | 300–500 |
Evaluation | Strengths, weaknesses and limitations with their impact, and realistic improvements | 400–600 |
References | Every source used, in one consistent style | not counted |
These numbers are a guide rather than a rule; a report with a short method and a long, sharp evaluation can be excellent. What matters is that each section does its job without padding.
Applying the ideas
The same logic applies to every section: words spent on material that the criteria do not reward are words not available for the conclusion and evaluation.
Self-check
- To do:
I can state the four criteria, their marks and the total.
- To do:
I can describe what separates the 3–4 and 5–6 markbands for each criterion.
- To do:
I can state the word limit and what does and does not count towards it.
- To do:
I can state the rules for working in a group of up to three.
- To do:
I can name the approaches to an investigation (hands-on, fieldwork, database, simulation, spreadsheet model) and give a physics example of each.
- To do:
I can explain what academic integrity requires, including the use of AI tools.
- To do:
I can describe what a risk assessment and an ethical review involve.
- To do:
I can plan a timeline for my own investigation from idea to submission.
Carry on with Physics in Augment
With a free account, Augment remembers where you stopped in the notes and which questions you have marked.