Choosing a research question
How to turn an interest into a focused, measurable research question, identify independent, dependent and control variables, and improve weak questions step by step.
- IB Physics
- Internal assessment
- SL and HL
The research question is the single sentence that the whole investigation sets out to answer. It decides what is measured, what graph is drawn, what the conclusion can claim and what the evaluation criticises, so time spent sharpening it is never wasted. A good research question names one quantity that is changed and one that is measured, says what system they belong to and over what range, and can be answered with the equipment and time available.
Many weak investigations go wrong at this first step. A vague question ("What affects the bounce of a ball?") cannot lead to a precise method, and a question with no link to physics ("Which brand of battery is best?") leaves nothing to compare the result with. Narrowing an idea into a good question is a skill that improves with practice, and it can be done for any theme of the course.
What makes a research question good
A strong research question has five features. It does not need to be original: well-known relationships make excellent investigations when they are tested carefully, and the familiarity of the physics makes it easier to compare the result with accepted values.
Feature | What it means | Example of the feature |
|---|---|---|
Focused | One independent variable and one dependent variable | "How does the length of the string affect…", not "How do length, mass and amplitude affect…" |
Measurable | Both variables are quantities with units that can be measured or selected precisely | "rebound height in cm" rather than "how bouncy the ball is" |
Specific | The system, the materials and the range of the independent variable are named | "a 30 cm stainless steel rule, overhang from 15 cm to 45 cm" |
Grounded in physics | Theory predicts a relationship (or a value) that the results can test | "…and is the period proportional to the square of the length?" |
Feasible | Can be done safely, with available equipment, within about 10 hours | A wave tray and a phone camera, rather than a wind tunnel |
Variables
Every quantitative investigation is built from three kinds of variable. Naming them precisely, with units and with how each is measured or controlled, is the core of a clear research design.
An investigation has one independent variable, chosen so that it can be set to several precise values across a wide range. In a database or fieldwork investigation, where nothing can be set by hand, the question can instead link two correlated variables, one selected and one recorded. The dependent variable is what is measured at each value; it may also be a quantity calculated from the measurements, such as a speed found from a distance and a time. The independent variable goes on the horizontal axis of the final graph and the dependent variable on the vertical axis.
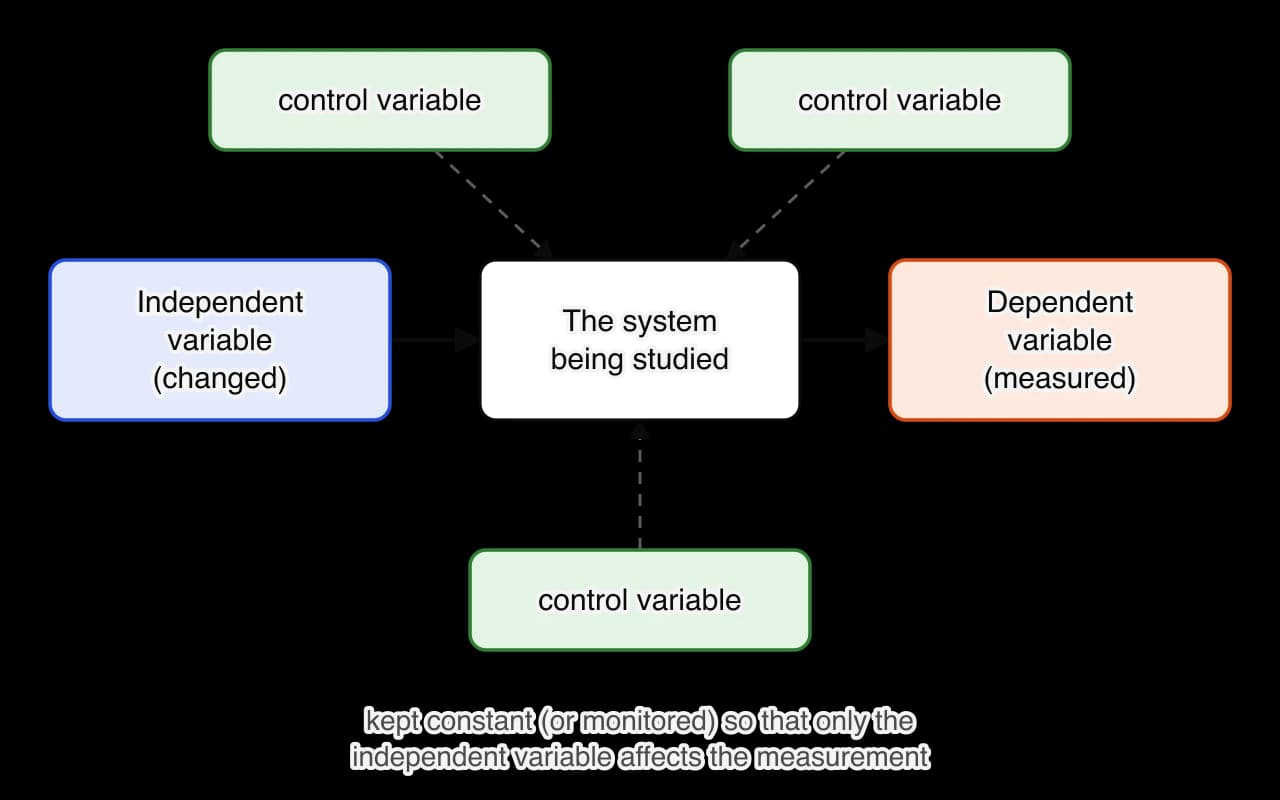
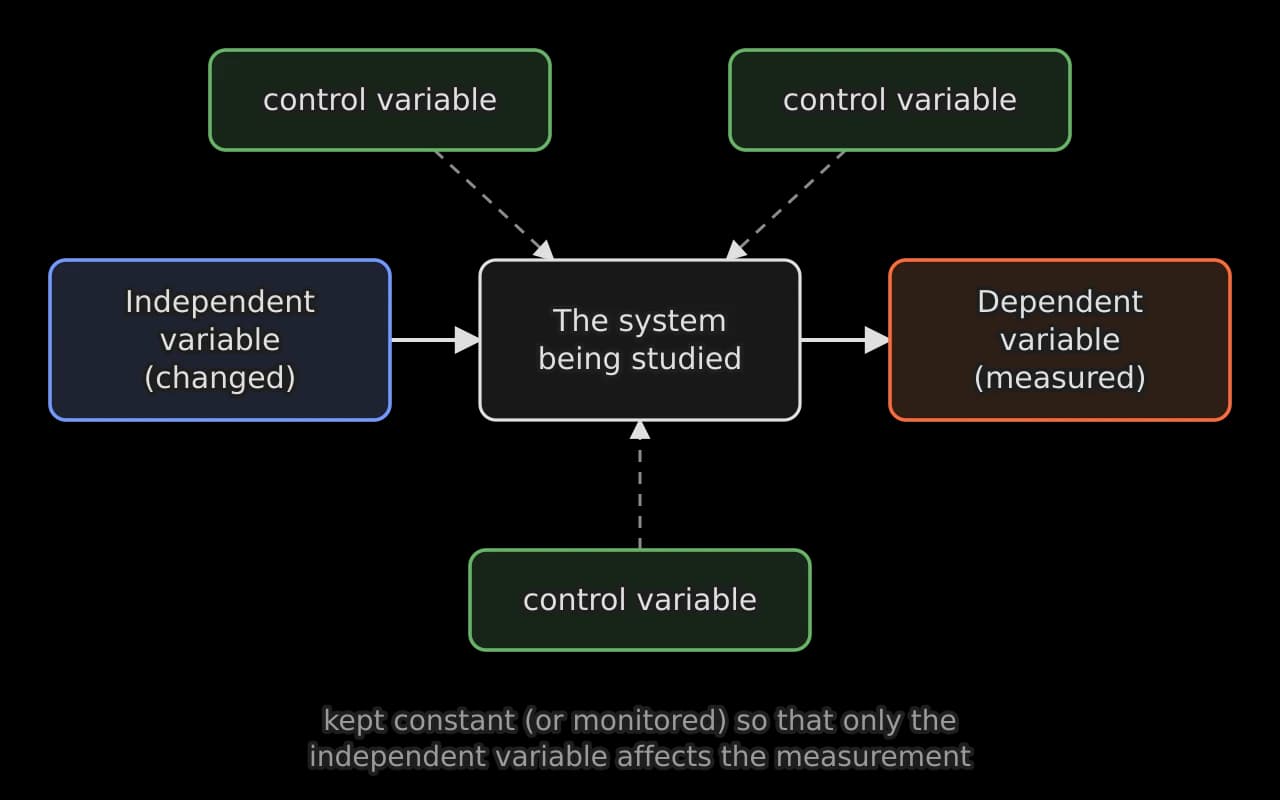
Control variables are what make a test fair. If a ball's rebound height is studied as a function of its temperature, the drop height, the surface it lands on and the ball itself must stay the same, otherwise a change in rebound height cannot be blamed on temperature alone. A good report names each control variable, explains why it matters (how it would affect the dependent variable) and says how it was kept constant.
A variables table
Variables are usually set out in a table. The example is for an investigation of how the depth of water affects the speed of a wave pulse in a tray.
Variable | Type | How it is set, measured or controlled | Why it matters |
|---|---|---|---|
Water depth | Independent | Set to 1.0, 1.5, 2.0 … 5.0 cm; measured with a vernier depth gauge at three points and averaged | Theory predicts for waves much longer than the depth |
Pulse speed | Dependent | Distance travelled along the tray divided by the time, found from 240 frames per second video | The quantity the question asks about |
Tray level | Control | Checked with a spirit level before each run | A sloping tray changes the depth along the path |
Way the pulse is made | Control | A ruler lifted out of the water at one end, to the same depth each time | A larger disturbance gives a larger amplitude, which changes the speed slightly |
Water temperature | Control (monitored) | Measured with a thermometer at the start and end | Changes viscosity and surface tension, which affect short waves |
Continuous and discrete independent variables
A continuous variable can take any value in a range (length, temperature, voltage). A discrete or categorical variable takes separate values (the type of material, the number of layers of insulation, the colour of an LED). A continuous independent variable is far better for an investigation, because the results can be plotted as a graph with a line of best fit, and the shape of the line can be compared with theory. A categorical variable only allows a bar chart and a comparison of separate results.
Some categorical questions can be made continuous by choosing a property behind the categories. "How does the type of metal affect the resistance of a wire?" becomes "How does the resistivity of the metal…" only if the resistivities are known; a cleaner question varies the length or cross-sectional area of one metal instead. "How does the colour of an LED affect its threshold voltage?" becomes continuous by using the wavelength of each LED as the independent variable.
From a topic to a question
Research questions rarely appear fully formed. A reliable way to reach one is to narrow an idea in steps: from a topic, to a relationship between two quantities, to named variables with a range, to a question with a prediction. The steps for an investigation of water waves are shown in the narrowing diagram.
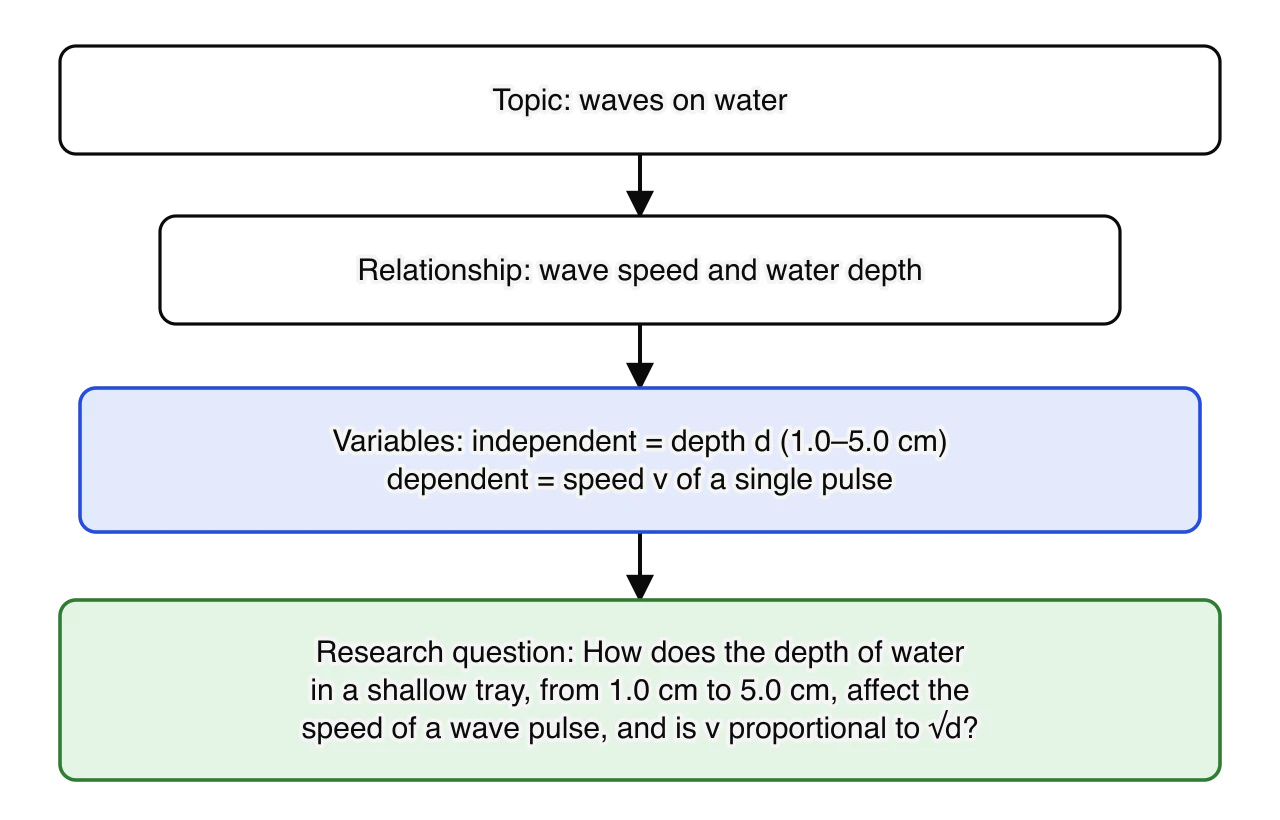
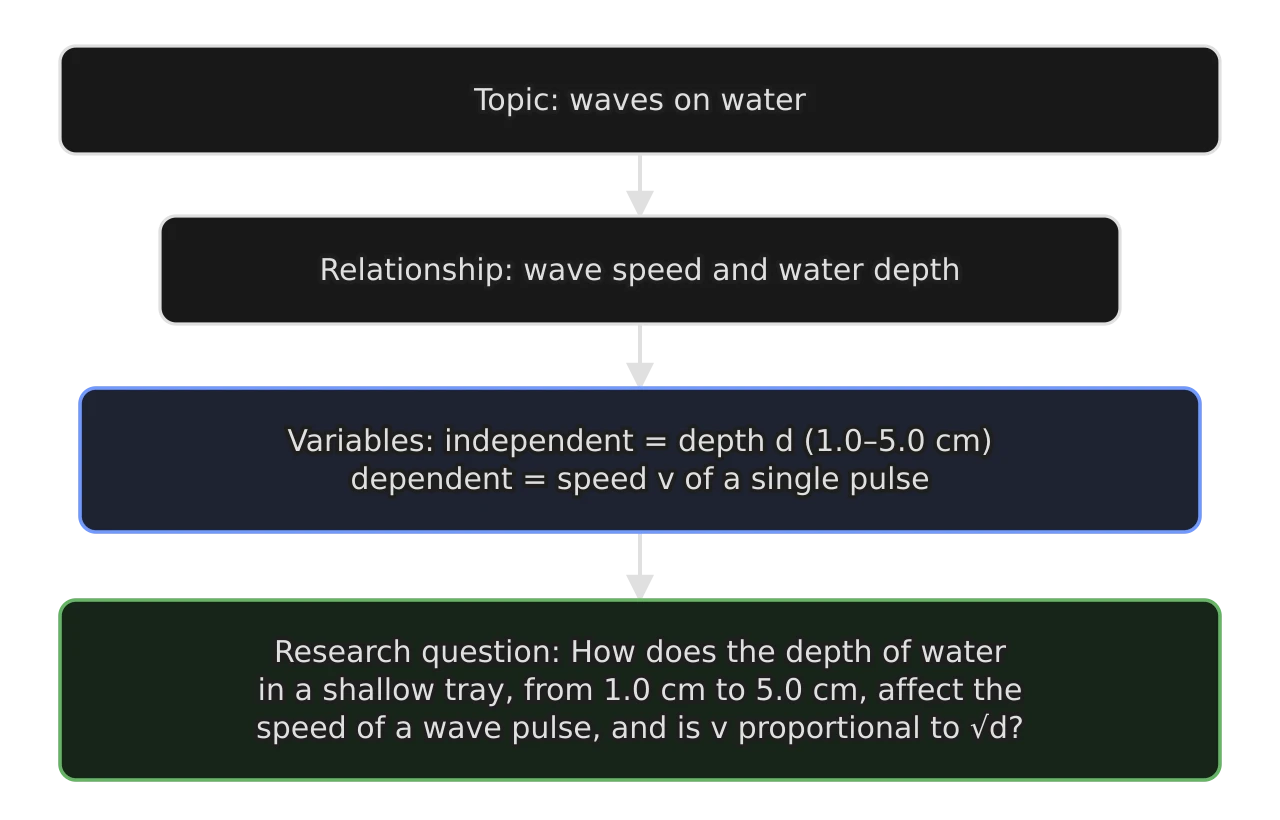
Each step removes a choice the reader would otherwise have to guess. The final question tells a moderator exactly what was changed, over what range, what was measured and what relationship was tested. It also tells the student what the method must achieve: a depth that can be set precisely to within a millimetre, and a speed measurement precise enough to distinguish from, say, .
Adding the prediction
Linking the question to a prediction from theory turns a description into a test. A hypothesis states the expected relationship and the physics behind it. For the wave tray, the theory of shallow-water waves gives
so a graph of against should be a straight line through the origin with gradient . The research question can then ask not only "how does affect ?" but also "is proportional to , and does the gradient give the accepted value of ?". The second part gives the conclusion an accepted value to compare with.
A hypothesis is not a guess, and it is not marked down if the data contradict it. A result that disagrees with a well-reasoned prediction is still a scientific result, and explaining the disagreement is what the conclusion and evaluation are for.
Improving weak questions: examples across physics
The worked examples take weak questions from each theme of the course and improve them step by step. Each final version would support a strong investigation; none is the only good answer.
Rolling adds a twist that the free-sliding formula misses. Including the correct theory in the question shows that the context is specific rather than broad.
The temperature range in that example is modest, which keeps the change in speed small (about 7%). A narrow change in the dependent variable demands a precise method, so a student choosing this question would check in a pilot that the resonant length can be found to within a few millimetres.
Questions for databases and simulations
A research question for a database or simulation investigation has the same features, but the independent variable is selected or set in software rather than set in a laboratory. The question must also be one that the source can answer with enough data.
Weak question | Problem | Improved question |
|---|---|---|
"Is Kepler's third law true?" | No data set or system named; already known to work well for the planets | How does the orbital period of the confirmed planets of a single star depend on their orbital radius, using the NASA Exoplanet Archive, and does give a value for the star's mass that matches its catalogue value? |
"What happens to projectiles with air?" | No variables; "air" is not a quantity | In a projectile simulation that includes fluid resistance, how does the launch angle, from 20° to 70°, affect the horizontal range of a 0.10 kg ball launched at 25 m s⁻¹, and how far does the angle of maximum range fall below 45°? |
"How hot are stars?" | No relationship; no data source | For main-sequence stars in a published star catalogue, how does the surface temperature affect the luminosity, and is the relationship a power law? |
With databases, the method lies in how the data are chosen: which source, which filters (for example only stars within a given distance, or only planets with a measured radius), how many values, and how outliers are treated. With simulations, the student must have genuine control: choosing the variables, ranges and settings, rather than following a pre-set exercise with one right answer.
Checking feasibility
Before committing to a question, a quick check of feasibility avoids discovering in week three that the investigation cannot work. The questions to ask are practical ones.
Does the dependent variable change enough? Over the planned range, the change should be many times larger than the uncertainty of one measurement. A pilot with two or three values at the ends of the range answers this in minutes.
Can the independent variable be set precisely? It needs at least five, preferably seven or more, distinct values across a wide range.
Is the equipment available and safe? High voltages, lasers above class 2, open radioactive sources and large rotating machinery are rarely suitable.
Does it fit the time? All values and repeats need to be collected in a few lab sessions, with time left for a second attempt at any that go wrong.
Is there physics to compare with? A predicted relationship or a known value makes the conclusion far stronger.
Applying the ideas
The reasoning in (b) matters: a question can satisfy every formal feature and still be weak, because the physics it tests is too simple to give the conclusion and evaluation anything to work with.
Self-check
- To do:
I can list the features of a strong research question.
- To do:
I can define independent, dependent and control variables and identify them in any investigation.
- To do:
I can write a variables table with how each variable is set, measured or controlled, and why it matters.
- To do:
I can explain why a continuous independent variable is better than a categorical one.
- To do:
I can narrow a topic into a focused question in steps, and add a prediction from theory.
- To do:
I can write a research question for a database or simulation investigation.
- To do:
I can check a question for feasibility before starting.
Carry on with Physics in Augment
With a free account, Augment remembers where you stopped in the notes and which questions you have marked.