Research design
How to plan an investigation that earns the top band: context, justified methodology, range and number of measurements, control, piloting, safety and ethics, and database or simulation approaches.
- IB Physics
- Internal assessment
- SL and HL
The Research design criterion assesses how well the student explains what they are investigating and why, and how they collected or selected the data to answer it. A top-band design does three things. It places the research question in a specific scientific context, it explains the methodological choices that make the data relevant and sufficient, and it describes the method clearly enough that someone else could repeat it.
Good design is invisible in the final data and obvious in their quality. A well-designed investigation produces readings spread across a wide range, with small and well-understood uncertainties, and with every other influence held fixed. That quality then makes the analysis, conclusion and evaluation straightforward.
What the criterion rewards
Strand | Middle band (3–4) | Top band (5–6) |
|---|---|---|
Context of the question | Outlined in a broad context | Described in a specific, appropriate context |
Methodological considerations | Described | Explained (with reasons) for collecting relevant and sufficient data |
Description of the method | Repeatable with a few ambiguities or omissions | Repeatable |
The difference between "described" and "explained" runs through the whole criterion. A described method says what was done; an explained method says why. "The period of 20 oscillations was timed" is a description. "The period of 20 oscillations was timed, because one period of 0.35 s is close to the human reaction time and timing 20 reduces the fractional uncertainty from the reaction time twentyfold" is an explanation.
Context: placing the question in physics
The context is the physics that makes the question worth asking and tells the reader what to expect. A broad context mentions the topic in general ("waves slow down in shallow water"). A specific context gives the relevant theory, the equation that predicts the relationship, the assumptions behind that equation, and how the investigation will test it. It may also mention why the question matters in the real world or what published work has found.
The context does not need to be long. Three to five well-chosen sentences with a reference are usually enough. Long textbook-style explanations of basic physics, such as what a wave is, use words without adding specificity.
Explaining the methodology
The methodology covers every choice about how the data are collected: the technique, the instruments, the range and number of values, the repeats, and how other variables are controlled. The criterion rewards explaining these choices, which means giving the reason for each one.
Choosing techniques and instruments
Each measurement uses the instrument whose resolution and range suit the size of the quantity. A useful rule is that the uncertainty of a single reading should be small compared with the change being measured. The table lists common instruments with their usual resolution.
Quantity | Instrument | Typical resolution | Notes |
|---|---|---|---|
Length (0.1–1 m) | Metre rule | 1 mm | Read at eye level to avoid parallax |
Length (1–100 mm) | Vernier calipers | 0.02 mm or 0.1 mm | External and depth jaws |
Small thickness or diameter | Micrometer screw gauge | 0.01 mm | Check the zero reading first |
Time (seconds or more) | Hand-held stopwatch | 0.01 s | Human reaction time adds about 0.1–0.2 s at each end |
Short time | Light gate and data logger | 0.001 s or better | Needs a flag of known width for speeds |
Time from video | Phone slow-motion video | 1/240 s per frame at 240 frames per second | Count frames; include a ruler in the shot for distances |
Mass | Top-pan balance | 0.01 g or 0.1 g | Tare (zero) with the container on |
Temperature | Digital thermometer | 0.1 °C | Stir the liquid; allow the probe to settle |
Current, pd, resistance | Digital multimeter | ± the last digit shown | Choose the most sensitive range that does not overload |
Angle | Protractor | 1° | A phone inclinometer app reads to 0.1° |
Justifying a technique often means comparing it with an alternative. A student who chose video analysis over a stopwatch can say why: the stopwatch reaction time of about 0.2 s would have been more than half of a period of 0.35 s, while each video frame lasts only 0.004 s.
Range and number of measurements
The independent variable should cover as wide a range as the apparatus and safety allow. A wide range makes the trend unmistakable and lets the shape of the relationship be tested. Over a narrow range almost any smooth relationship looks like a straight line, as the graph of two models shows.
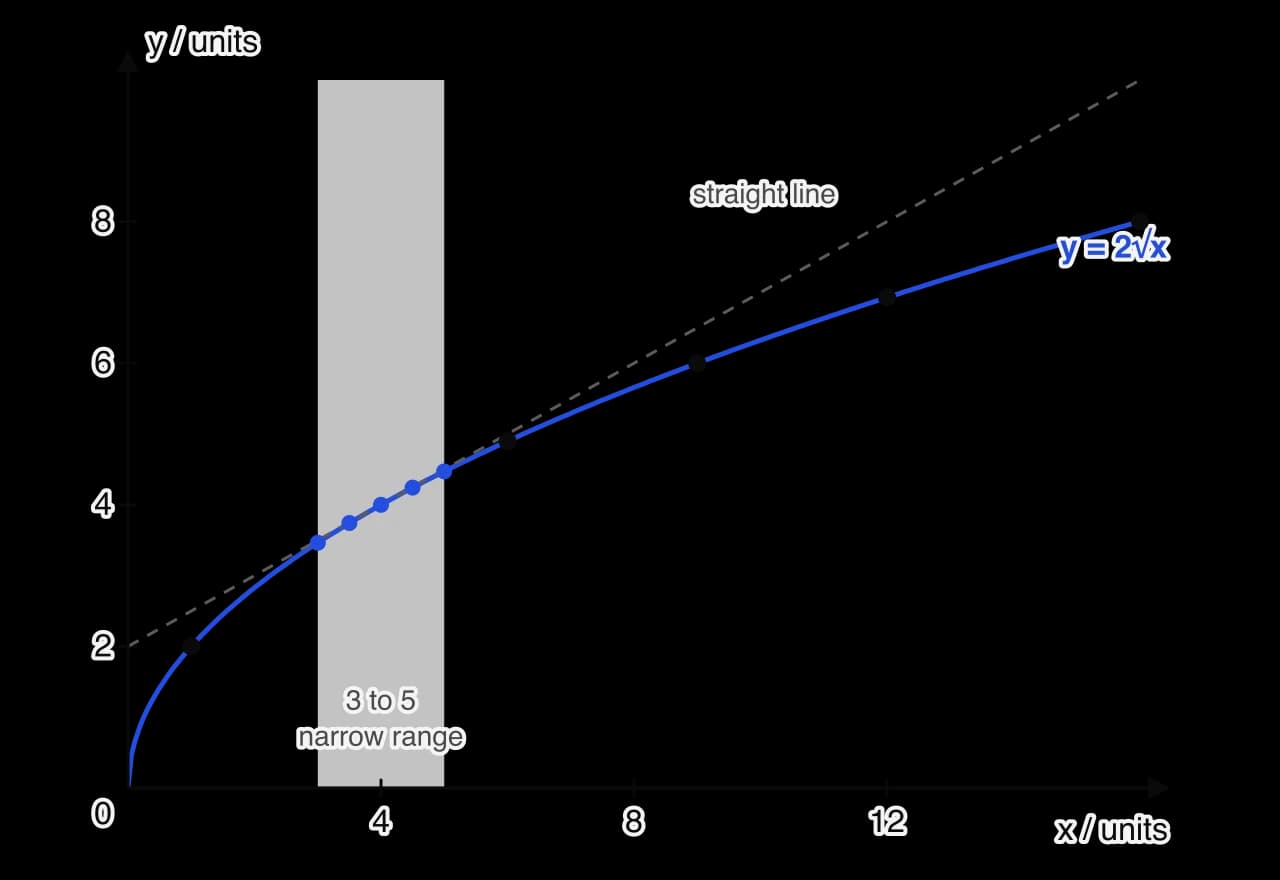
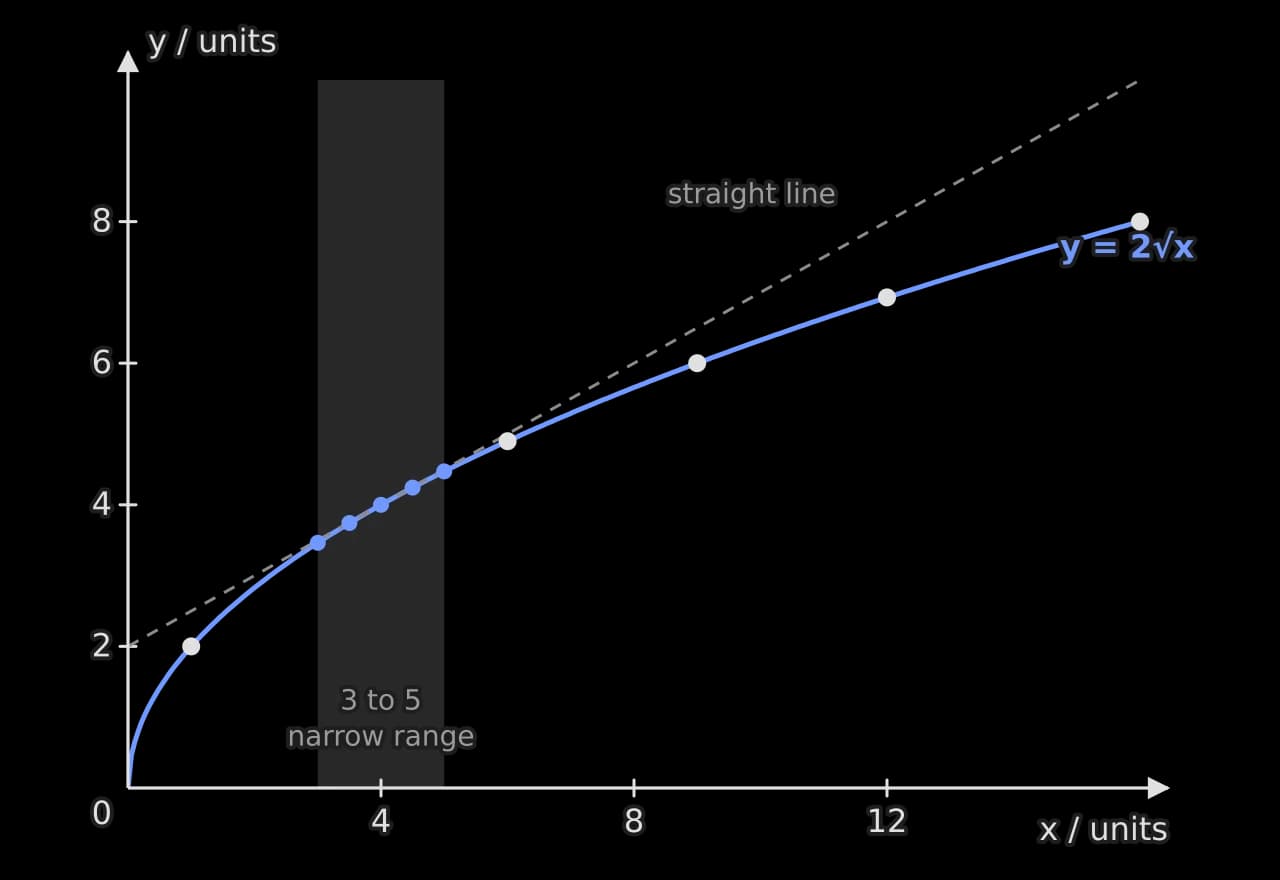
Between and , the square-root curve and the straight line differ by less than the size of a typical error bar, so no conclusion about the shape is possible. Across the full range they differ by up to 2 units, many times the size of an error bar.
Number of values. At least five distinct values of the independent variable, and preferably seven to ten, so that a trend and its shape can be judged and an anomalous point stands out.
Spacing. Usually even across the range; closer together where the dependent variable changes fastest, such as near a maximum or where a curve bends.
Repeats. At least three readings at each value, so that the random scatter can be seen and an uncertainty estimated from the spread. More repeats where the scatter is large.
Including zero. A reading at zero (or as close as possible) tests whether the line passes through the origin, which many theories predict.
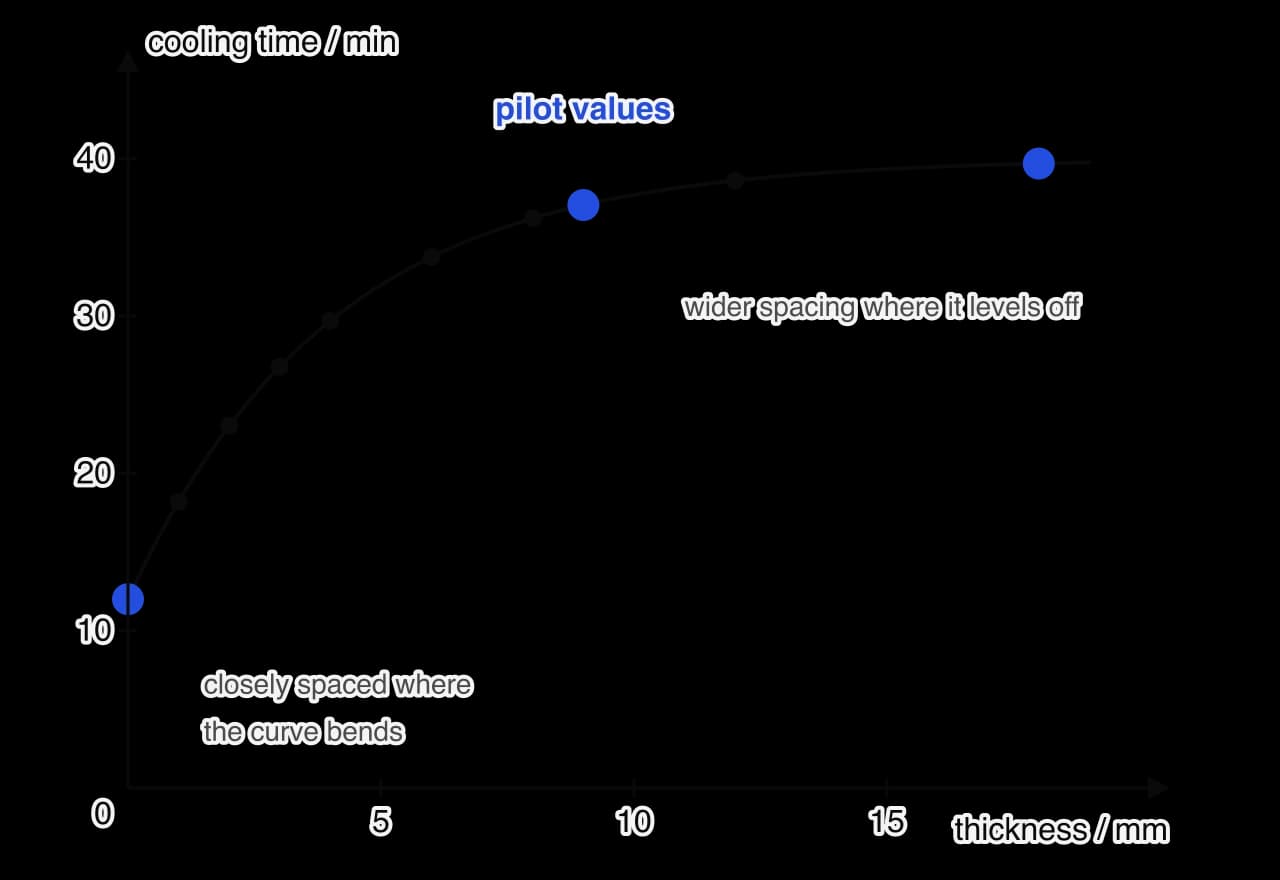
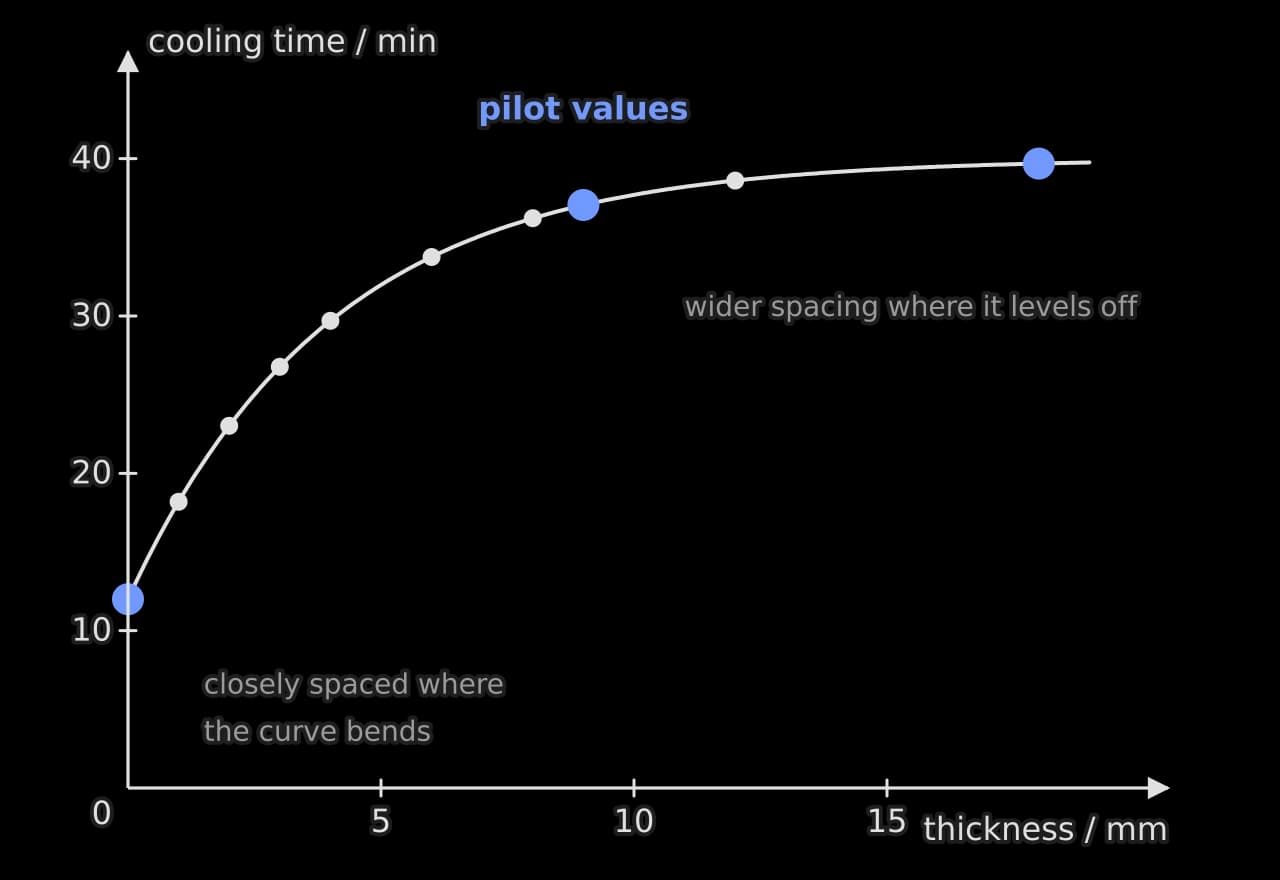
The spacing diagram shows how a pilot run guides the choice of values. Three readings at the ends and middle of the range show where the curve bends, and more points are then placed there.
Controlling variables
Each control variable needs a method of control and a reason. The common techniques in physics investigations are:
Technique | Physics examples |
|---|---|
Calibrating an instrument against a known standard | Checking a thermometer in melting ice and boiling water; checking a micrometer or a force sensor for a zero error |
Keeping conditions constant | Using the same ball, surface and release mechanism; working in one room at a steady temperature; keeping a wire's current small so it does not heat up |
Insulating | Lagging a calorimeter; adding a lid; using a polystyrene cup |
Reducing friction or resistance | An air track or a trolley with low-friction wheels; short, thick connecting leads in a circuit |
Measuring and subtracting a background | Background count rate for radioactivity; the Earth's magnetic field for a magnetometer; ambient light for a light sensor |
Monitoring what cannot be fixed | Recording the room temperature or air pressure before and after each set of readings |
Where a variable cannot be controlled, monitoring it and reporting its range lets the evaluation judge its effect. A room temperature that rose from 20.5 °C to 22.0 °C during a resistance experiment can be shown to change a constantan wire's resistance by a negligible amount, because constantan is chosen for its very small temperature coefficient.
Piloting
A pilot study is a short trial run of the method before the main data collection. It costs a lesson and often saves an investigation.
A pilot can show:
whether the dependent variable changes measurably across the planned range;
the practical limits of the range (the shortest length that still vibrates slowly enough to film; the largest angle before a ball skids);
the size of the random scatter, which decides the number of repeats;
unexpected problems, such as a clamp that slips, a sensor that saturates or a temperature that drifts;
whether the chosen instrument has enough resolution.
The report should mention what the pilot found and what changed as a result. This is a clear way of explaining methodological considerations, because each change comes with its reason.
Writing a method that can be repeated
The method should let another student with similar equipment repeat the investigation and get comparable results. A labelled diagram of the set-up, a list of apparatus with the resolution of each instrument, and a numbered procedure are the usual elements.
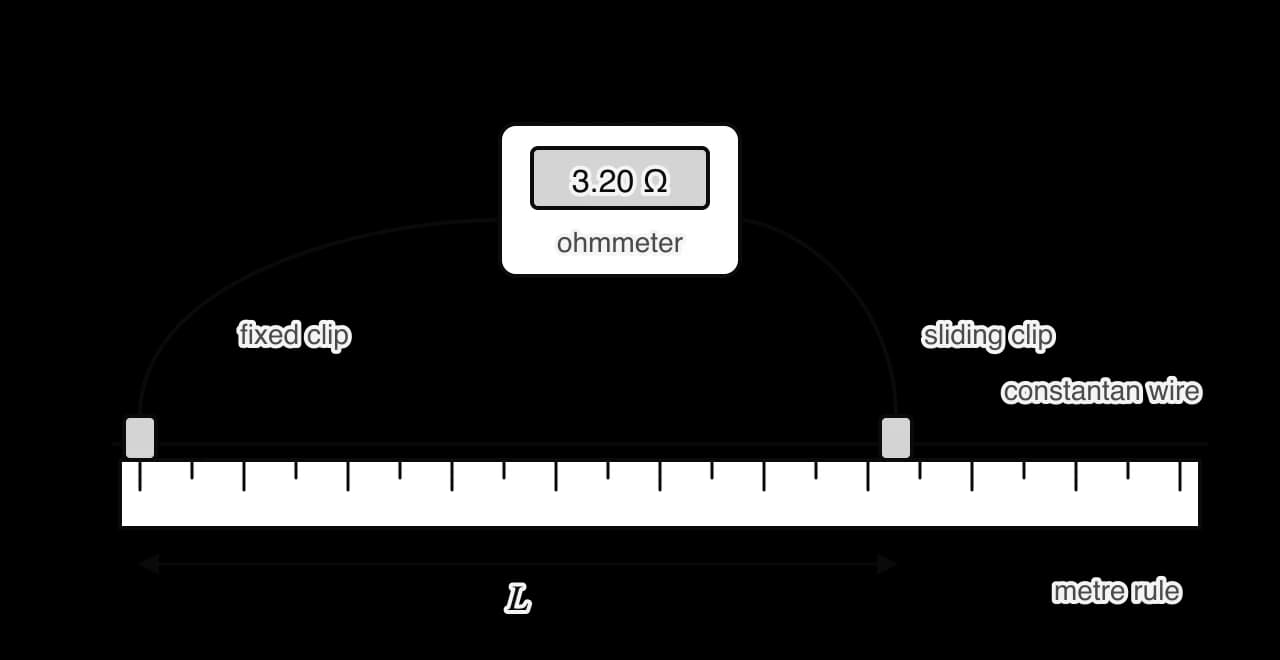
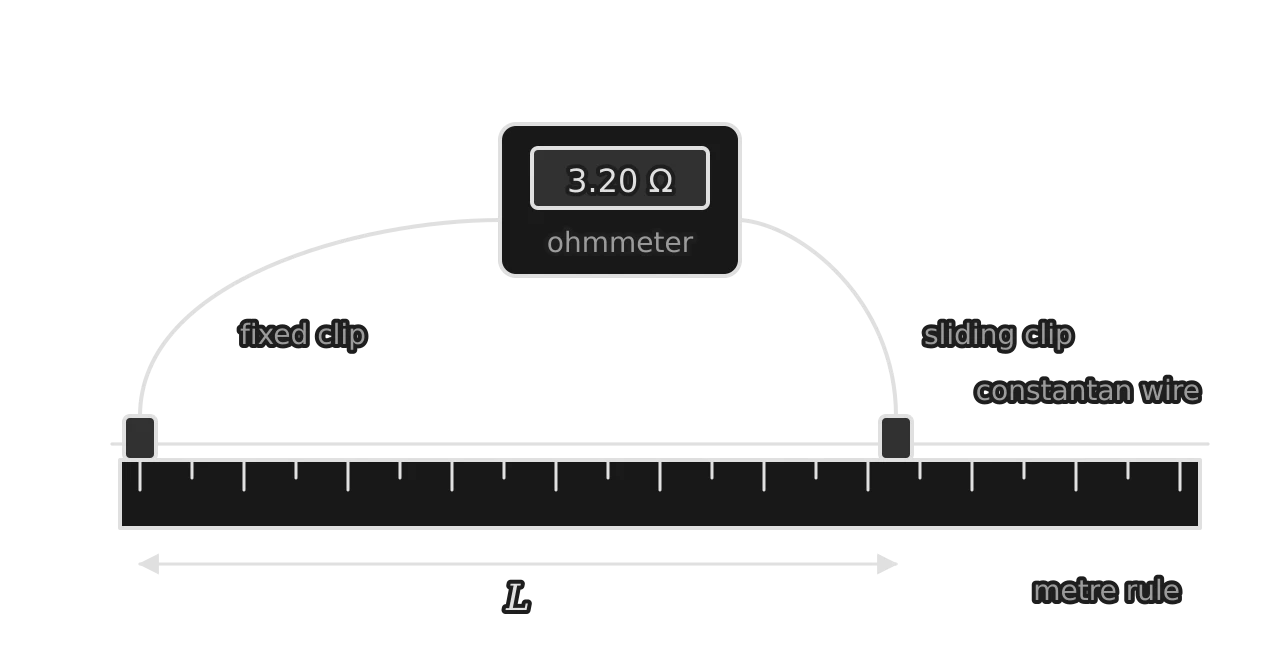
The procedure includes the quantities, distances and settings that matter (the length of the wire, the instrument ranges, how the clips were placed) and leaves out what any physicist would assume (how to read a ruler). Every decision that affects the data appears with its reason, either in the procedure itself or in a short explanation after it.
Safety, ethics and the environment
A risk assessment identifies each hazard, how harm could happen and the precautions taken. It is short, specific to the investigation, and approved by the teacher before work begins. Generic statements ("wear safety glasses") earn little unless they address a real hazard of the method.
Hazard | Risk | Precaution |
|---|---|---|
Hot water at 70–90 °C | Scalds if the container tips | Container in a tray on a stable bench; fill with a jug, never by carrying a full beaker |
A heavy mass on a spring or string | Injury to feet if it falls | Clamp stand weighted or G-clamped to the bench; a box of sand beneath the mass |
A stretched wire that may snap | Eye injury from the whipping ends | Safety glasses; load added gradually; stand to the side |
A sealed radioactive source | Unnecessary dose | Handled with tongs, kept at arm's length, used for the shortest time, returned to its store; school local rules followed |
A laser pointer (class 2) | Eye damage from the direct beam | Beam kept below eye level and directed at a wall; no reflective jewellery |
Mains-powered equipment | Electric shock | Equipment checked and tested; no liquids near sockets |
Ethical issues arise when people take part, for example in an investigation of reaction time or of the force of a jump. Participants give informed consent, can stop at any time, are not put at risk, and are not identifiable in the report. Environmental impact covers disposal of materials (batteries, chemicals, broken glass) and avoidable energy use. If there are no issues of one kind, a sentence saying so with a reason is enough.
Databases and simulations as approaches
A database or simulation investigation needs the same three strands as a practical one: a specific context, an explained methodology and a repeatable description. What changes is the meaning of "methodology".
Database investigations
In a database investigation the data are secondary data measured by others. The methodology is the way the data are chosen and checked.
The source. Name it and explain why it is reliable (a scientific organisation, a peer-reviewed survey, a stated measurement method).
The selection criteria. State exactly which records were used and why: for example, "planets of a single star, so that the star's mass is the same for all; only those with both period and orbital radius listed".
The size of the sample. Enough records to show a trend and its scatter, and no cherry-picking of the ones that fit.
The uncertainties. Many databases list uncertainties with each value; these are used for error bars. If none are given, the report says how they were estimated.
Repeatability. The date the data were accessed and the filters applied, so that someone else could extract the same records.
Database investigations have no apparatus to describe, so the selection process carries the methodological marks. A bare statement such as "data were taken from the internet" earns nothing in that strand.
Simulation investigations
A simulation produces primary data from a computer model run by the student. The methodology explains which simulation was used, why its physical model is suitable, what settings were chosen and how the outputs were read. A simulation that simply evaluates a textbook formula gives nothing to investigate; a good one includes physics that a simple formula does not (fluid resistance, many particles, large amplitudes) or produces results with scatter.
The model. What physics the simulation includes and leaves out, from its documentation.
The settings. Every parameter fixed (the control variables) and the independent variable's range.
Resolution of the outputs. A simulation reading has an uncertainty set by the number of digits displayed, the scale of an on-screen ruler or the size of the time step.
Validation. A check that the simulation reproduces a known result in a simple case, such as the range of a projectile with fluid resistance switched off.
Applying the ideas
Each weakness in that example is one that a pilot run would have exposed, which is why piloting appears in every strong design.
Self-check
- To do:
I can write a specific context for a research question, with the predicting equation and its assumptions.
- To do:
I can explain, not just describe, each methodological choice.
- To do:
I can choose instruments with suitable resolution and justify the choice.
- To do:
I can choose and justify the range, number and spacing of values and the number of repeats.
- To do:
I can name the techniques for controlling variables and match them to physics examples.
- To do:
I can describe what a pilot study shows and how it changes a method.
- To do:
I can write a method, with a labelled diagram, that another person could repeat.
- To do:
I can write a specific risk assessment and address ethical and environmental issues.
- To do:
I can explain the methodology of a database or simulation investigation.
Carry on with Physics in Augment
With a free account, Augment remembers where you stopped in the notes and which questions you have marked.