Conclusion and evaluation
How to write a conclusion justified by the data and their uncertainties, compare results with accepted values and theory, and evaluate weaknesses by their impact with realistic improvements.
- IB Physics
- Internal assessment
- SL and HL
The Conclusion and Evaluation criteria together carry half the marks for the investigation. The conclusion answers the research question and justifies the answer with the processed data, their uncertainties and the accepted science. The evaluation judges how far that answer can be trusted: which weaknesses and limitations affected the result, how much each one mattered, and what realistic changes would reduce their effect.
Both criteria depend on the analysis. A gradient with an uncertainty, an intercept that may or may not be zero, and a derived value that can be compared with a published one give the conclusion something precise to say and the evaluation something specific to explain. Without uncertainties, neither criterion can reach the top band.
What the criteria reward
Criterion | Middle band (3–4) | Top band (5–6) |
|---|---|---|
Conclusion | A relevant conclusion is described but not fully consistent with the analysis; some relevant comparison with the accepted scientific context | A relevant conclusion is justified, fully consistent with the analysis, and justified through relevant comparison with the accepted scientific context |
Evaluation | Specific methodological weaknesses or limitations are described, with relevant realistic improvements described | The relative impact of specific weaknesses or limitations is explained, with relevant realistic improvements explained |
Two words carry most of the difference. In the conclusion, justified means every claim is backed by a number from the analysis and its uncertainty. In the evaluation, relative impact means the weaknesses are not just listed but ranked by how much each one changed the result.
Writing a justified conclusion
A conclusion opens by answering the research question directly, in one or two sentences. It then supports that answer with evidence from the processed data, and finally places it in the scientific context.
Answering the question
Name the relationship precisely. "Resistance increases linearly with length" or "the period is proportional to the square of the length", not "length affects resistance". Use proportional only for a straight line through the origin (within its uncertainty).
Quote the key result with its uncertainty and unit. "The gradient is 4.3 ± 0.2 Ω m⁻¹, giving a resistivity of (4.9 ± 0.4) × 10⁻⁷ Ω m."
State the range of validity. The conclusion holds over the range investigated; it may not hold beyond it.
Use cautious language. Data support or are consistent with a hypothesis; they never prove it.
Using the uncertainties as evidence
The uncertainties decide what the data can claim. If every error bar touches the best-fit straight line, the data are consistent with a linear relationship. If the intercept, with its uncertainty, includes zero, the data are consistent with direct proportionality; if it does not, a systematic offset is present and must be explained. If the maximum and minimum lines allow very different gradients, the conclusion must be more tentative.
Comparing with the accepted scientific context
The scientific context is the published knowledge the result can be tested against: a theory's prediction, an accepted value of a constant or a material property, or the findings of earlier studies. Every comparison is cited so that the reader can trace its source.
Percentage error and the uncertainty range
The simplest comparison is the percentage error between the experimental and literature values:
A percentage error on its own says little. The decisive comparison is whether the accepted value lies within the uncertainty range of the experimental result. Three cases are possible.
Case | What it suggests | What the conclusion says |
|---|---|---|
Accepted value inside the uncertainty range | The result is consistent with the accepted value; any difference can be explained by random uncertainty | The result agrees with the accepted value within its uncertainty |
Accepted value outside the range | A systematic error, or an assumption of the theory that does not hold, has affected the result | The result does not agree; the direction of the difference points to the likely cause |
Range very wide, so almost any value fits | The result agrees, but the test is weak | Agreement is noted, with the caveat that the uncertainty is too large for a strong test |
Comparing the percentage error with the percentage uncertainty gives the same test in one line. In the resistivity analysis, the percentage error from the literature value of m is less than 1%, far smaller than the 9% uncertainty, so the result agrees. If the percentage error had been 15%, larger than the uncertainty, a systematic error would be indicated.
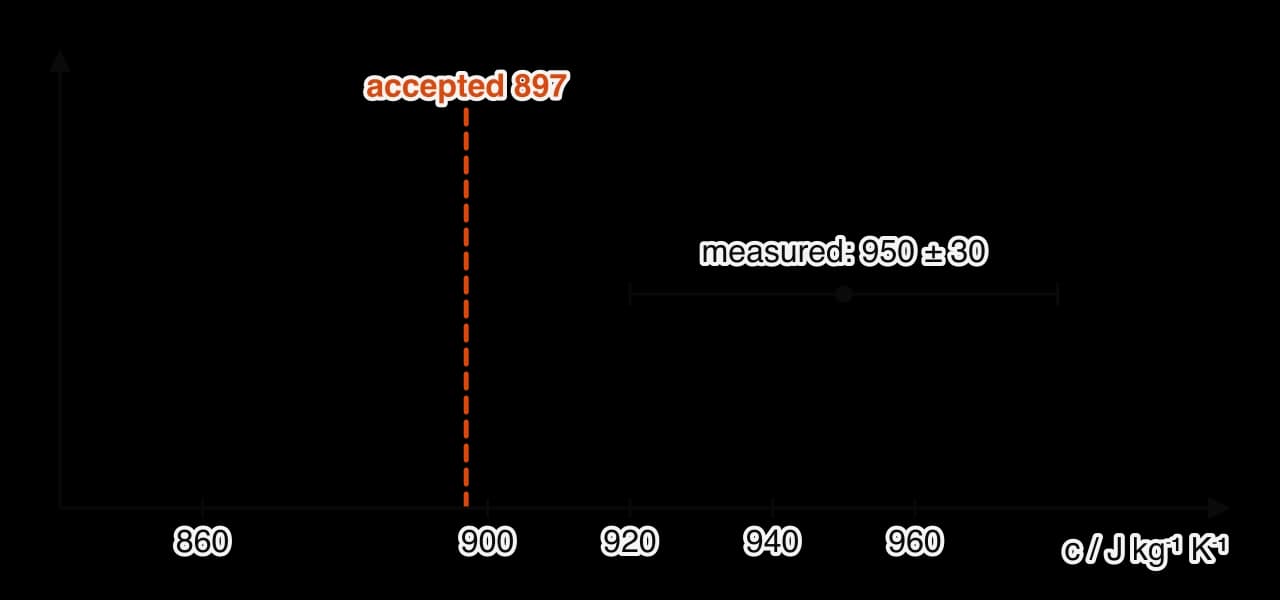
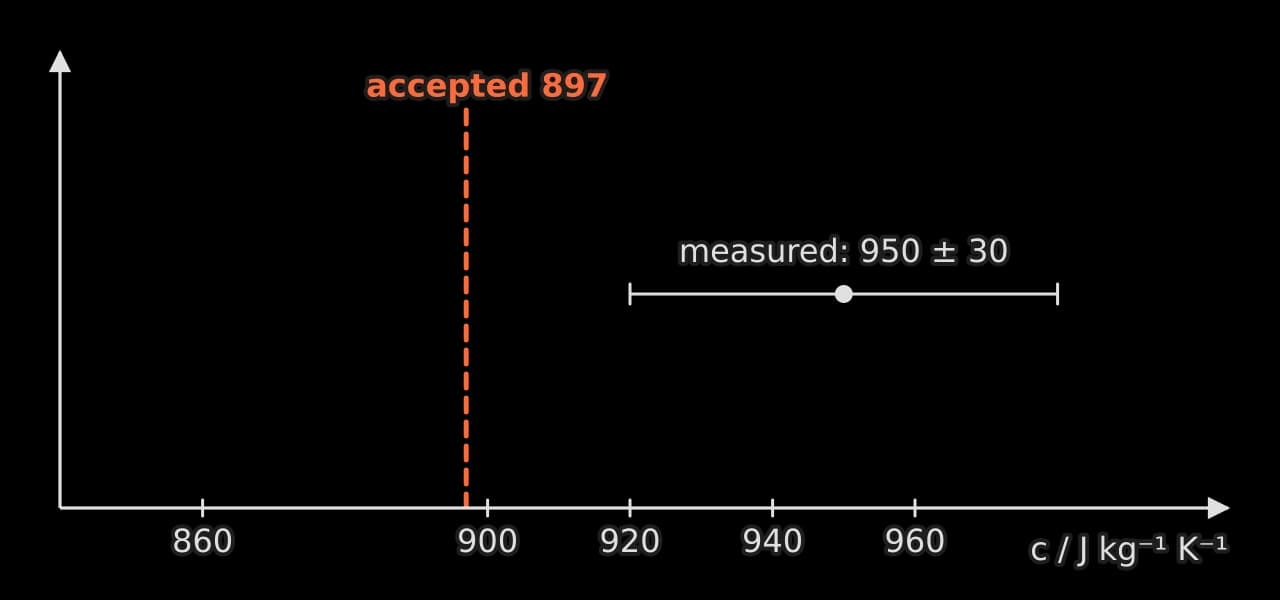
The comparison chart shows the second case for a specific heat capacity experiment. The measured value is 950 ± 30 J kg⁻¹ K⁻¹; the accepted value for aluminium near room temperature is about 897 J kg⁻¹ K⁻¹, below the lower limit of 920. The measured value is too high, and the direction of the difference is itself evidence: heat lost to the surroundings means more energy was supplied than the block absorbed, which makes the calculated too high.
Comparing with theory
When the research question tests a relationship rather than a value, the context is the theory's prediction. A log–log gradient of 1.95 ± 0.03 for a relationship predicted to have power 2 is close but does not include the predicted value, so either the theory's assumptions do not quite hold or a systematic error is present. A conclusion that explains which (with evidence, such as a non-zero intercept) is fully justified.
Weak and strong conclusions
The worked examples show how the same results support conclusions of very different quality.
The strong version could be checked line by line against the analysis, which is what "fully consistent with the analysis" means in practice.
Evaluating the investigation
The evaluation examines the methodology critically: what was done well, what weakened the result, what limited the scope of the conclusion, and how each problem could be reduced. It concerns the investigation itself, so "human error" or "the equipment was not perfect" earn nothing. Every point is specific to this method and this data set.
Random and systematic errors
Errors fall into two kinds with different effects and different remedies.
Random error | Systematic error | |
|---|---|---|
Effect on readings | Scatter above and below the true value | All readings shifted in the same direction |
Effect on results | Reduces precision; widens error bars | Reduces accuracy; shifts a gradient or an intercept |
Shown by | The spread of repeats and the scatter about the best-fit line | A non-zero intercept, or disagreement with the accepted value beyond the uncertainty |
Reduced by | More repeats, averaging, a more sensitive instrument | Calibration, correcting zero errors, changing the method |
Physics example | Reaction time when hand-timing; variable contact resistance | Heat loss in calorimetry; an unzeroed balance; lead resistance |
A random error is reduced by repeating and averaging, but a systematic error is not: repeating a calorimetry experiment with the same heat loss gives the same wrong answer every time. A strong evaluation states which kind each weakness is, and therefore whether more repeats would help.
Explaining the relative impact
The top band asks for the relative impact of each weakness, which means ranking them. Two tools make this possible.
Percentage uncertainties. The contribution of each measurement to the final uncertainty shows which random uncertainties matter. In the resistivity analysis, the diameter contributes 5.3% and the gradient 3.7%, so the diameter is the largest single source.
Estimating a systematic effect. A systematic error can often be estimated from the data or from a short extra measurement. The size of the estimate is compared with the discrepancy it is meant to explain.
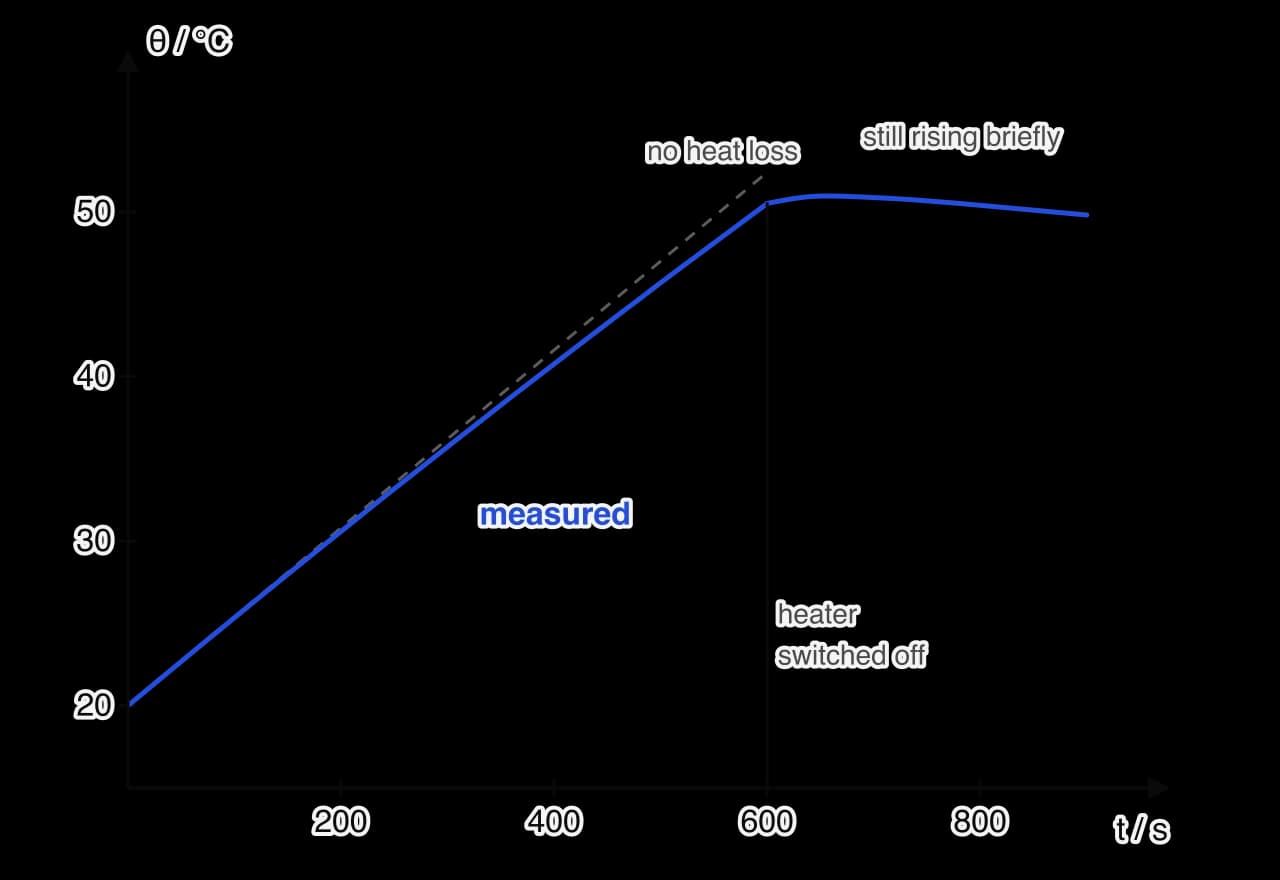
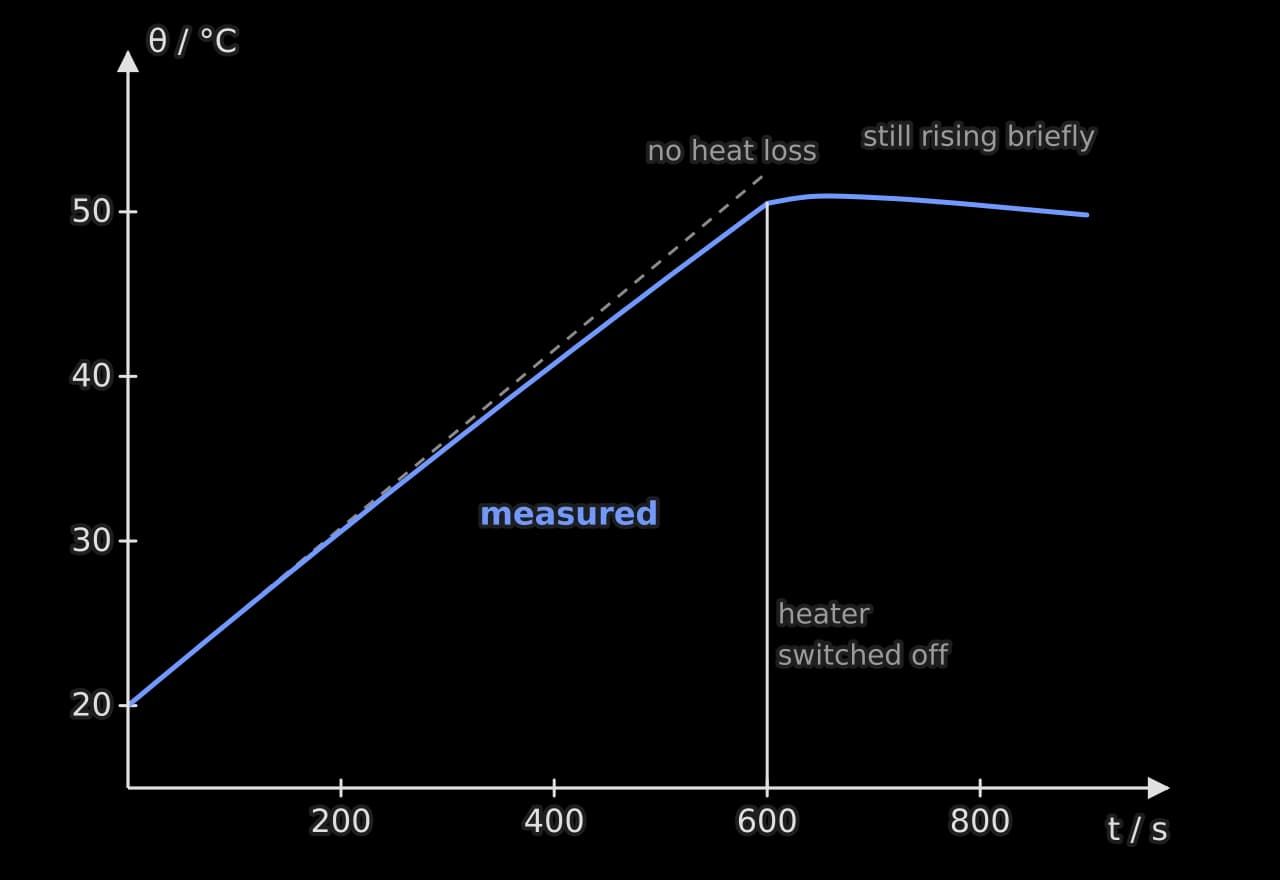
The heating curve shows how a systematic heat loss can be estimated. After the heater was switched off, the 1.00 kg block cooled at about 0.37 K per minute at 50 °C, 30 K above room temperature. With that is a loss of about 5.6 W at the end of heating. The temperature excess rose roughly steadily from zero, so the average loss during heating was about half of that, 2.8 W, or about 1,700 J over 600 s. This is 6% of the 29,000 J supplied, which matches the 6% discrepancy. Heat loss is therefore large enough to explain most of the difference, and it is the dominant weakness.
Weak and strong evaluation points
Generic (lower band) | Specific and explained (top band) |
|---|---|
"There was human error in timing." | "Hand-timing ten oscillations gave a spread of 0.14 s (1.9%). This random uncertainty is the largest contribution to the uncertainty of g; filming the oscillations at 240 frames per second would reduce it to about 0.01 s." |
"More repeats would make it more accurate." | "The diameter varied by 0.02 mm along the wire, contributing 5.3% to the uncertainty in ρ, more than the gradient. Measuring the diameter at ten points rather than five, at different orientations, would reduce this; more resistance repeats would not, because they do not affect A." |
"The equipment was not very precise." | "The ohmmeter's resolution (0.01 Ω) is small compared with the spread of repeats (up to 0.13 Ω), so the instrument was not limiting. The spread came from contact resistance at the sliding clip, which a four-terminal method would remove." |
"Heat was lost." | "Heat loss of about 1,700 J (6% of the input), estimated from the cooling rate after switch-off, explains the measured value being 6% above the accepted value. Lagging the block with 2 cm of foam, or starting about 15 K below room temperature and finishing about 15 K above, would greatly reduce it." |
Realistic improvements
Each improvement should be realistic (possible in a school laboratory in the time available), relevant (aimed at an identified weakness) and explained (saying how it would reduce the effect, ideally by how much). "Use a vacuum chamber" is rarely realistic; "use a light gate instead of a stopwatch, reducing the timing uncertainty from 0.2 s to 0.001 s" is.
Strengths, limitations and assumptions
A balanced evaluation also notes strengths: a wide range, small scatter, a method that removed an offset automatically. It considers limitations of scope, such as a conclusion valid only over the range tested or for one material, and the assumptions of the theory: was the wire really uniform, were the oscillations small enough for the simple model, was the source effectively a point? Where an assumption may have failed, the evaluation says how the data would show it.
A complete evaluation, weak and strong
The strong version ranks the weaknesses, identifies their type and direction, and connects each improvement to the problem it solves. It uses about 300 words, which is a sensible share of a 3,000-word report.
Applying the ideas
That answer follows the pattern of every good comparison: inside or outside the range, the size of the disagreement against the uncertainty, the direction, and a cause that pushes in that direction.
Self-check
- To do:
I can answer a research question directly, naming the relationship precisely.
- To do:
I can use uncertainties and intercepts as evidence for or against a relationship.
- To do:
I can compare a result with a traceable literature value using the uncertainty range.
- To do:
I can explain what a disagreement and its direction suggest about systematic errors.
- To do:
I can distinguish random and systematic errors and say which improvements reduce each.
- To do:
I can rank weaknesses by their relative impact using numbers from my data.
- To do:
I can suggest realistic, relevant improvements and explain how each would help.
- To do:
I can include strengths, limitations of scope and assumptions in an evaluation.
Carry on with Physics in Augment
With a free account, Augment remembers where you stopped in the notes and which questions you have marked.