The individual investigation and criterion A
Understand the ESS individual investigation, its rules and six criteria, choose a workable topic and write a focused research question with the background research criterion A rewards.
- IB Environmental Systems and Societies
- Internal assessment
- SL and HL
The individual investigation is the internally assessed part of ESS: a piece of research that you design, carry out and write up yourself, in which you collect and analyse data to answer a research question about an environmental issue. It is the one place in the course where you act as an environmental scientist and social scientist at once, choosing what to study, how to measure it and how to judge what the results mean.
The starting point is the task itself: its rules, its six criteria, the four kinds of investigation, and how to choose a topic and write a focused research question supported by the background research that criterion A rewards. Strategy and method (criteria B and C) and data, analysis and evaluation (criteria D, E and F, with the statistics) build on the same foundations. One invented investigation, into the effect of reduced mowing on plant diversity in a town park, is followed through every criterion as a worked example.
What the individual investigation is
The task is open-ended and must be repeatable by someone else. There is no set list of practicals and no fixed topic: you formulate your own research question, decide how to collect the data, collect it, process and analyse it, and evaluate what you did. The requirements, the time allowed and the criteria are identical at SL and HL, so an SL and an HL student in the same class do exactly the same kind of investigation.
Feature | Detail |
|---|---|
Time | 10 hours, including your teacher explaining the task, a consultation about your research question, developing the method, collecting data, and support while you work |
Weighting | 25% of the final grade at SL; 20% at HL (the same task carries less weight in the longer HL course) |
Marks | 30, across six criteria (A–F) |
Output | A written report of at most 3,000 words |
Data | Primary data or secondary data; qualitative data or quantitative data; from fieldwork, a laboratory, a survey or a database |
Assessment objectives | All four: knowledge (AO1), application and analysis (AO2), evaluation and synthesis (AO3) and the use of investigative skills (AO4) |
Feedback | Your teacher reads and comments on one draft, then the next version is the final one |
What counts towards the 3,000 words
The word limit applies to the prose. Several things are excluded, so a report can contain a great deal of data and still be under the limit.
Not counted | Counted |
|---|---|
Charts, graphs and diagrams (including a labelled site map) | All running text, including the method written as numbered steps |
Data tables (raw and processed) | Annotations or paragraphs of explanation placed between tables |
Equations, formulae and calculations | Text explaining what a calculation shows |
Citations and references, in any style (bracketed, numbered, footnotes) | Discussion of sources in sentences ("Smith found that…") is counted as prose |
Bibliography | Any other sentences of explanation or discussion, wherever they appear |
Headers (section headings) |
The start of the report states the title of the investigation, your IB candidate code (the alphanumeric code, such as xyz123, not your name), the candidate codes of any group members you collaborated with, and the number of words. No cover page or contents page is needed.
The six assessment criteria
Every report is marked against the same six criteria. The first three (A, B and C) are worth 4 marks each and assess the planning: the issue and question, the strategy, and the method. The last three (D, E and F) are worth 6 marks each and assess what you did with the data: how you processed it, how you analysed it and concluded, and how well you evaluated the investigation.
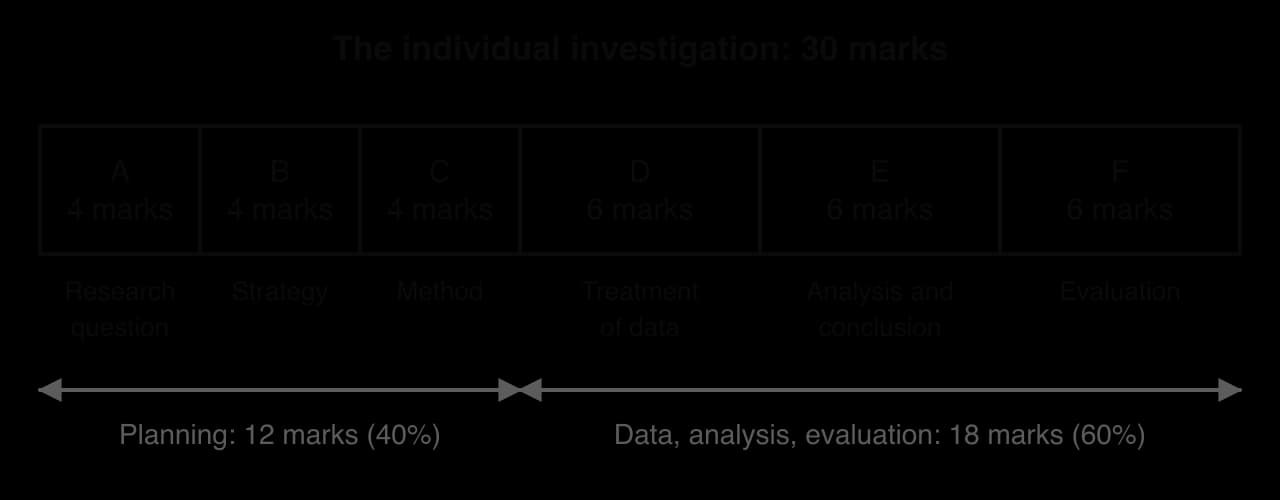
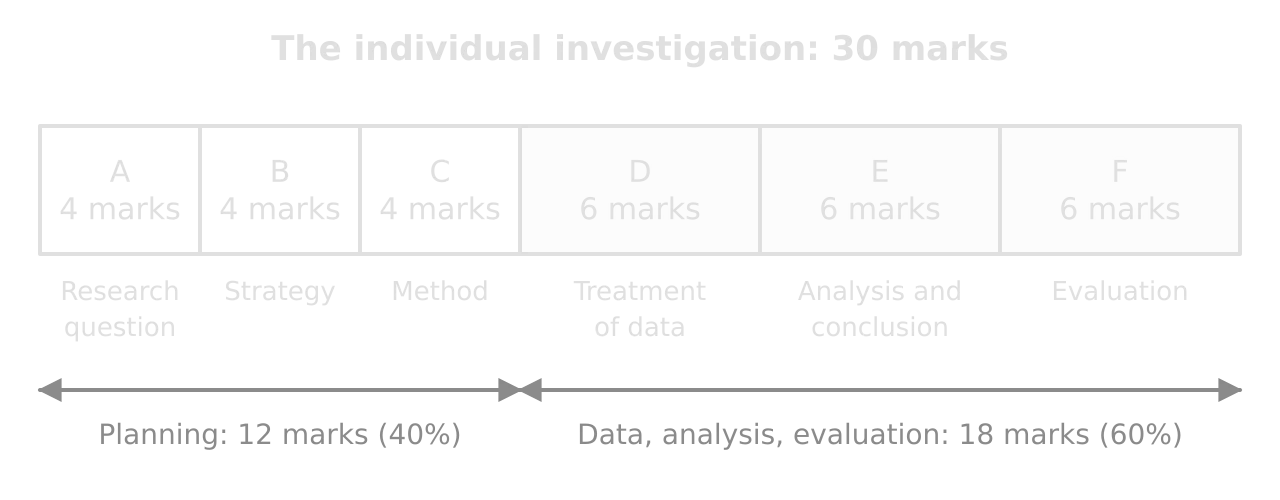
Criterion | Marks | What the top band looks for |
|---|---|---|
A Research question and inquiry | 4 | The issue is explained, supported by enough background research, and leads to a focused research question |
B Strategy | 4 | An existing or developing strategy is described, and a tension between perspectives that results from it is explained |
C Method | 4 | A third party could repeat the method exactly, and it collects enough data to answer the question |
D Treatment of data | 6 | Clear and detailed presentation; processing that fully addresses the question; correct processing |
E Analysis and conclusion | 6 | All relevant patterns and trends explained, with bias, reliability, validity and uncertainty; a conclusion supported by the analysis |
F Evaluation | 6 | Specific weaknesses and limitations evaluated for their effect on the conclusion; improvements evaluated; unresolved questions described |
Each criterion has a few level descriptors (bands). For criteria A, B and C there are two bands, 1–2 and 3–4; for D, E and F there are three, 1–2, 3–4 and 5–6. The verbs inside the descriptors climb in the same way as the command terms in exam questions: the lower bands state, identify or describe, and the top bands explain or evaluate. Knowing those verbs tells you what kind of writing each criterion needs.
How the marks are decided: best fit
Your teacher reads each criterion's descriptors and chooses the one that best describes the work as a whole. This is a best-fit judgement, not a checklist: a report does not need to meet every phrase of a descriptor to be placed in that band, and strengths in one aspect can compensate for weaker aspects of the same criterion. Within a band, the upper mark goes to work that shows the qualities strongly and the lower mark to work that shows them less fully. Only whole marks are given.
The criteria are also independent. A report can earn 4 for its research question and 2 for its evaluation, or the reverse. A weak method does not automatically pull down the data mark, which is why it is always worth processing and analysing your data carefully even if the collection did not go to plan. A sample of each school's reports is then sent to the IB for moderation, which checks the teacher's marking and can lead to marks being adjusted.
The rules: drafts, authenticity and group work
Drafts and teacher support
Your teacher plays an active part in the planning stage. Before you collect data, you discuss your research question and plan with them, and they advise you on whether it is feasible, safe and able to meet the criteria. They do not tell you what to investigate or how to do it. Once you have written a full draft, the teacher reads it once and gives oral or written advice on how to improve it, without editing it. The next version you hand in is the final one, and once it is officially submitted it cannot be withdrawn.
Use the one draft well: submit it complete, with every section written and every calculation done, so the feedback covers the whole report.
Authenticity and academic integrity
The report must be entirely your own work, and you confirm this when you submit it. Your teacher authenticates every report and can check authenticity by discussing the work with you, comparing it with your proposal and draft, checking the references you cite and comparing the writing style with your other work. Plagiarism detection software may also be used. Ideas, data, images and wording taken from any source are acknowledged with a reference. The same piece of work cannot be submitted both as the internal assessment and as an extended essay, and an extended essay in ESS must not use the research question of your internal assessment.
Working in a group
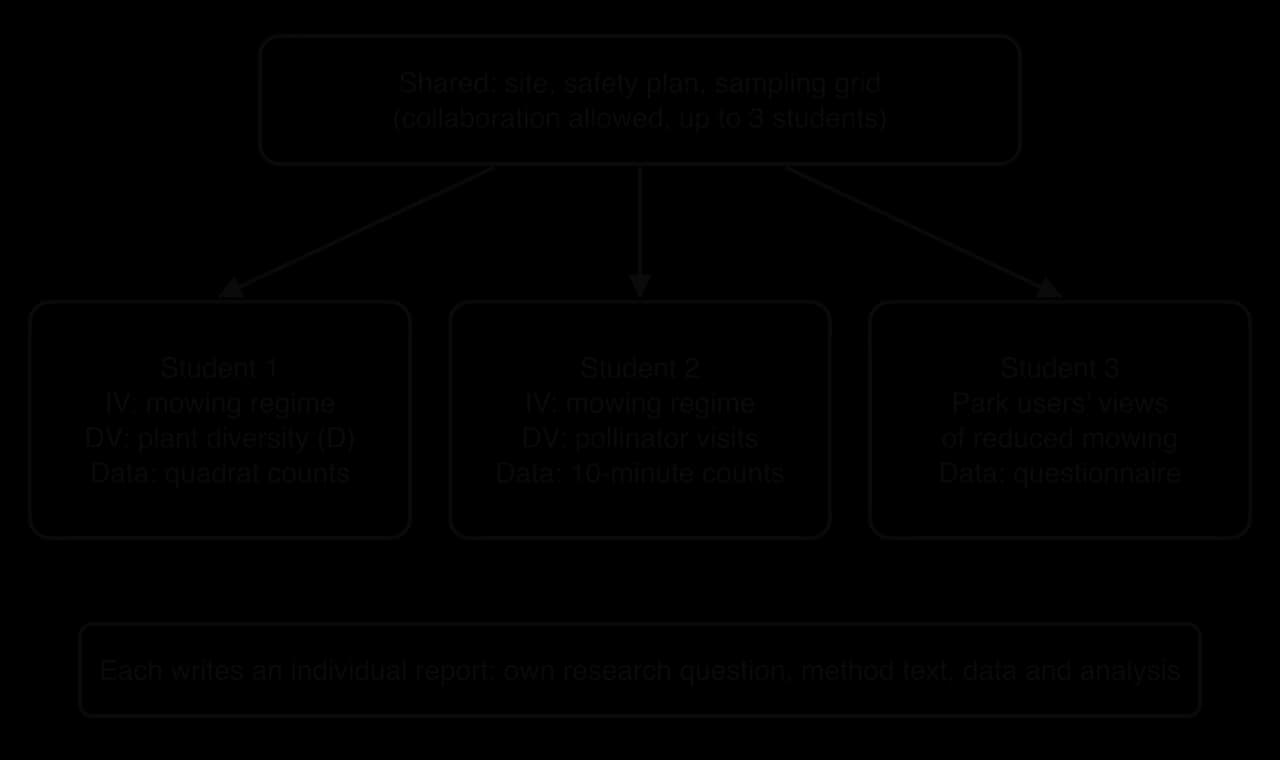
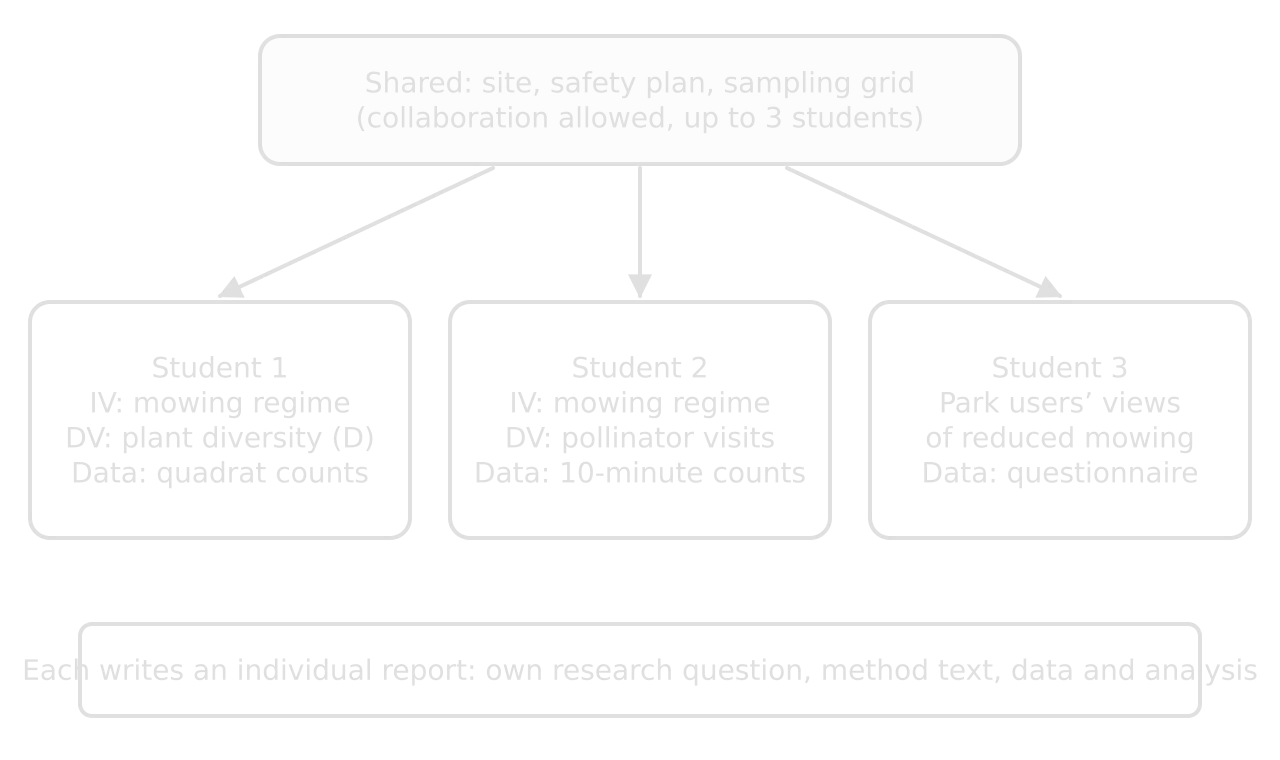
Collaboration is allowed during the development of the research question and the methodology, in groups of three students or fewer. However, each student must end up with a unique research question, a unique methodology and unique data, and each writes their own report: a group report is not permitted, and the method must be described in your own words.
There are three ways in which students sharing a site or a data-collection session can make their investigations unique:
each uses a different independent variable (one compares mowing regimes, another compares distance from a road);
each uses the same independent variable with a different dependent variable (both compare mown and unmown grass, but one measures plant diversity and the other counts pollinators);
each analyses different data from a larger data set that the group collected together.
If a class or school builds a large shared database using standard protocols (for example, years of river water-quality readings), a student who answers their question using that database is treated as carrying out a database investigation. The method then focuses on how the student filtered and sampled data from the whole database, exactly as if it came from an outside source such as a government agency.
Four kinds of investigation
Any approach that collects data to answer an environmental research question with a repeatable method is acceptable. Most ESS investigations fall into one of four kinds, and some combine two. Each has its own strengths, its own sources of error and its own ethical and safety issues.
Kind | What it involves | Example research question (hypothetical) | Strengths | Watch out for |
|---|---|---|---|---|
Field investigation | Measuring organisms and abiotic factors in a real ecosystem: quadrats, transects, capture–mark–release–recapture, water and soil sampling | How does species richness of ground plants change with distance (0–9 m) from a heavily used footpath in a school woodland? | Real systems; strong links to ecology; often cheap | Variables cannot be controlled; weather; identification errors; time on site; damage to the habitat |
Laboratory investigation | A controlled experiment that manipulates one variable and measures another | What is the effect of sodium chloride concentration (0–2.0 g L⁻¹) on the germination of cress seeds, as a model of road-salt run-off? | Control of variables; many replicates; clear cause and effect | Simplified model of a real system; artificial conditions; chemical safety and disposal |
Survey investigation | Questionnaires or interviews about knowledge, attitudes, values or behaviour | Is support for a town's reduced-mowing policy associated with the age group of park users? | Studies the societal side of an issue; links directly to perspectives | Sampling bias; leading questions; consent and anonymity; enough respondents |
Database investigation | Selecting, filtering and sampling secondary data from a published database (national statistics, Our World in Data, World Bank, monitoring networks) | What is the relationship between tree canopy cover and mean summer land surface temperature across districts of one city? | Large, high-quality data sets; global or long-term scales | Must design a repeatable selection method; reliability and definitions of the source; easy to drift into description |
Mixed designs (for example, roadside noise measurements plus a residents' survey) can be strong, but two kinds of data need two methods, analyses and evaluations within 3,000 words. They work best when one kind of data answers the question and the other plays a small supporting role.
Choosing a topic that works
The choice of topic decides much of what follows. A good topic is an environmental issue that involves both a natural system and human society, that can be investigated with data you can actually obtain in about 10 hours, and that will give enough numbers for a meaningful analysis. Pure ecology with no human dimension, or a social survey with no environmental content, both sit awkwardly in ESS; the strongest investigations connect the two.
Where good ideas come from
Your local environment: school grounds, a park, a river, a beach, a street. Local investigations make data collection practical and give a real context for criterion B.
Current local decisions: a new bus lane, a tree-planting scheme, a plastic bag charge, a rewilding project, a ban on lawn pesticides. Each is a strategy with stakeholders, which makes criterion B easier.
Topics from the course that lend themselves to measurement: trampling and soil compaction, water quality and land use, light pollution, urban heat, leaf litter decomposition, waste behaviour, food choices.
Open databases and citizen science projects (emissions, forest cover, bird counts, air-quality stations), which can be filtered and sampled.
Tests for a workable topic
- To do:
It is about an environmental issue with a human dimension, local or global.
- To do:
One variable can be changed, chosen or compared (the independent variable) and another measured (the dependent variable), or two variables can be measured to test for a relationship.
- To do:
The data can be collected in about 10 hours, at a time of year when the system can be studied (plants in flower, insects active, students in school for a survey).
- To do:
It will produce enough data for a statistical test: typically at least 10 values per group or 10 pairs of values, and more for a survey.
- To do:
It is safe, and it has no unacceptable impact on people, animals or the environment.
- To do:
There is published background (theory, a model, studies, local reports) to explain the issue and support a prediction.
- To do:
There is a real strategy linked to the issue, with stakeholders who see it differently (for criterion B).
The worked example: reduced mowing in a town park
The worked example that runs through all three pages is invented, but it is typical of a strong fieldwork-based investigation. A town council has started to leave part of the grassland in its parks unmown from April to August, to provide flowers for pollinators, while the rest is mown every two weeks as usual. A student wonders whether the unmown areas really do support more plant diversity, and decides to compare the two.
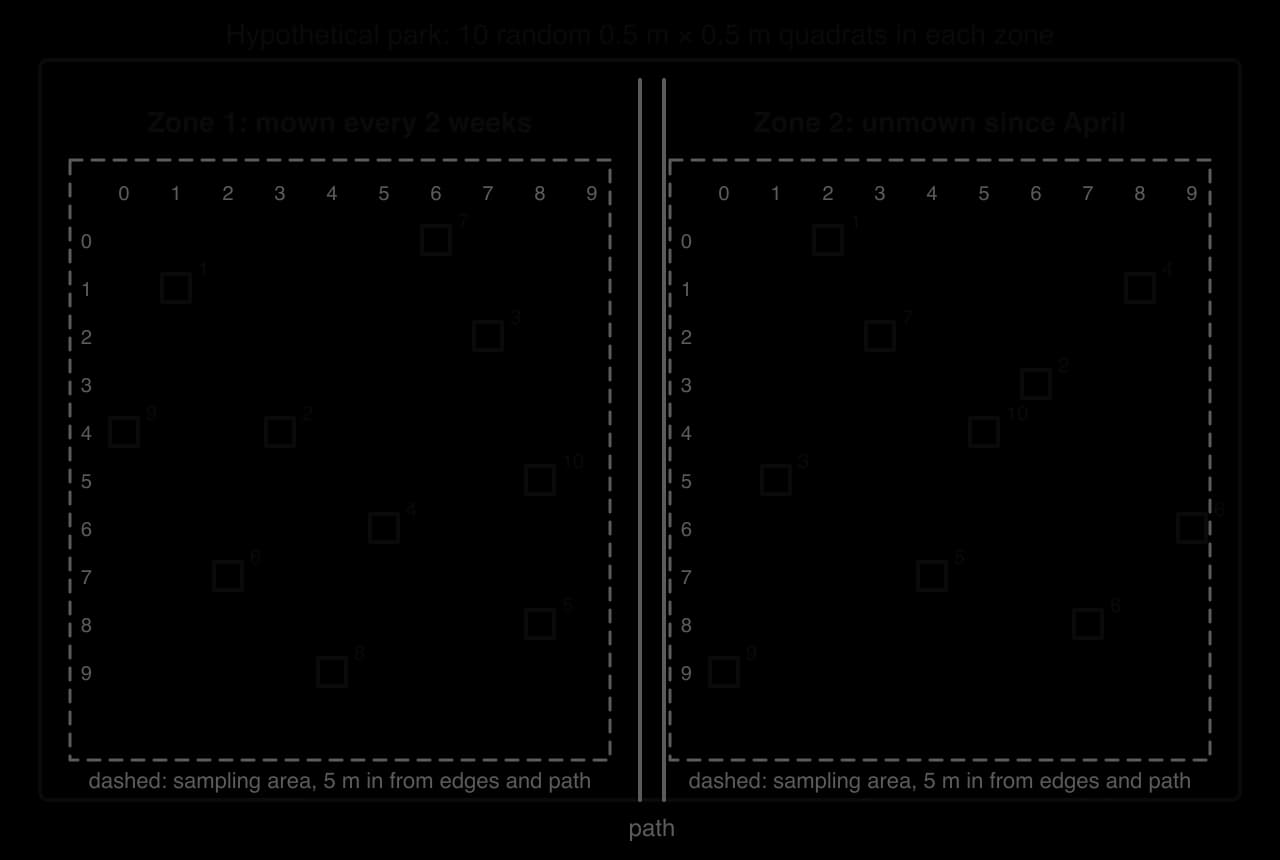
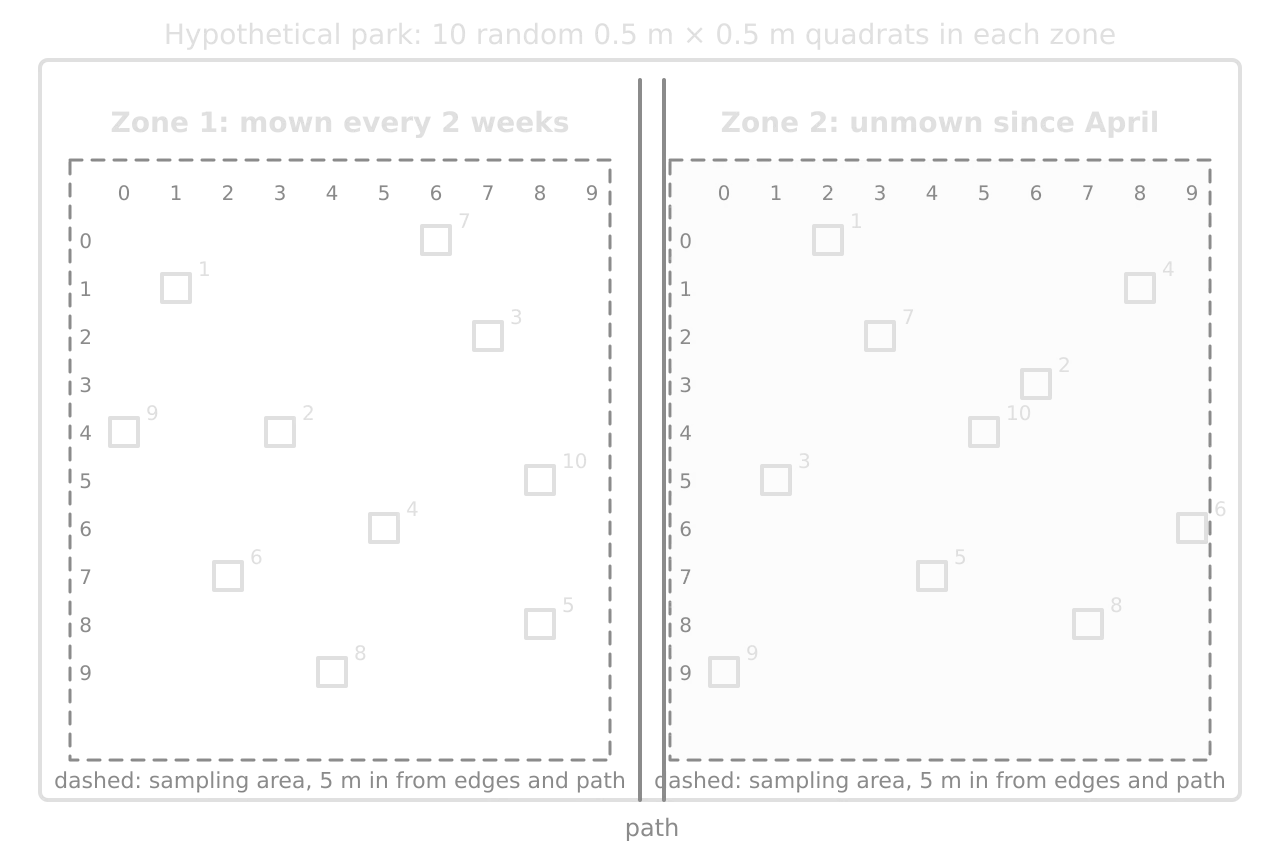
Element | In the worked example (hypothetical) |
|---|---|
Environmental issue | The loss of flower-rich grassland and the decline of pollinating insects; whether urban grassland can be managed to support biodiversity |
Local system | Grassland in one 4-hectare town park, half mown every two weeks, half unmown since April |
Independent variable | Mowing regime (mown every two weeks or unmown) |
Dependent variable | Plant species diversity in each 0.5 m × 0.5 m quadrat, measured as Simpson's reciprocal index (D) of broadleaved plants |
Kind of investigation | Field investigation with stratified random sampling |
Strategy for criterion B | The council's reduced-mowing policy, and the tension between residents who value a tidy, usable park and the council's biodiversity goals |
Statistics | Mean, standard deviation, box plots and an unpaired t-test (criteria D and E) |
The example has the features that make an investigation easy to mark well: a clear issue at local and global scales, two groups to compare, a standard diversity index, a strategy that people disagree about, and weaknesses worth evaluating. Short sibling examples (a survey, a laboratory experiment and a database study) show where other kinds of investigation need a different method or test.
From topic to research question
A research question is the single question the whole investigation sets out to answer. Every later decision depends on it: which variable you change or compare, what you measure, how many samples you need, which statistical test you use and what your conclusion has to say. A vague question produces a vague method and a conclusion that cannot be supported, so time spent sharpening the question is never wasted.
Most good research questions are reached by narrowing in steps, from a broad topic, to an environmental issue, to a particular local system, to two variables, and finally to a question that names them precisely.
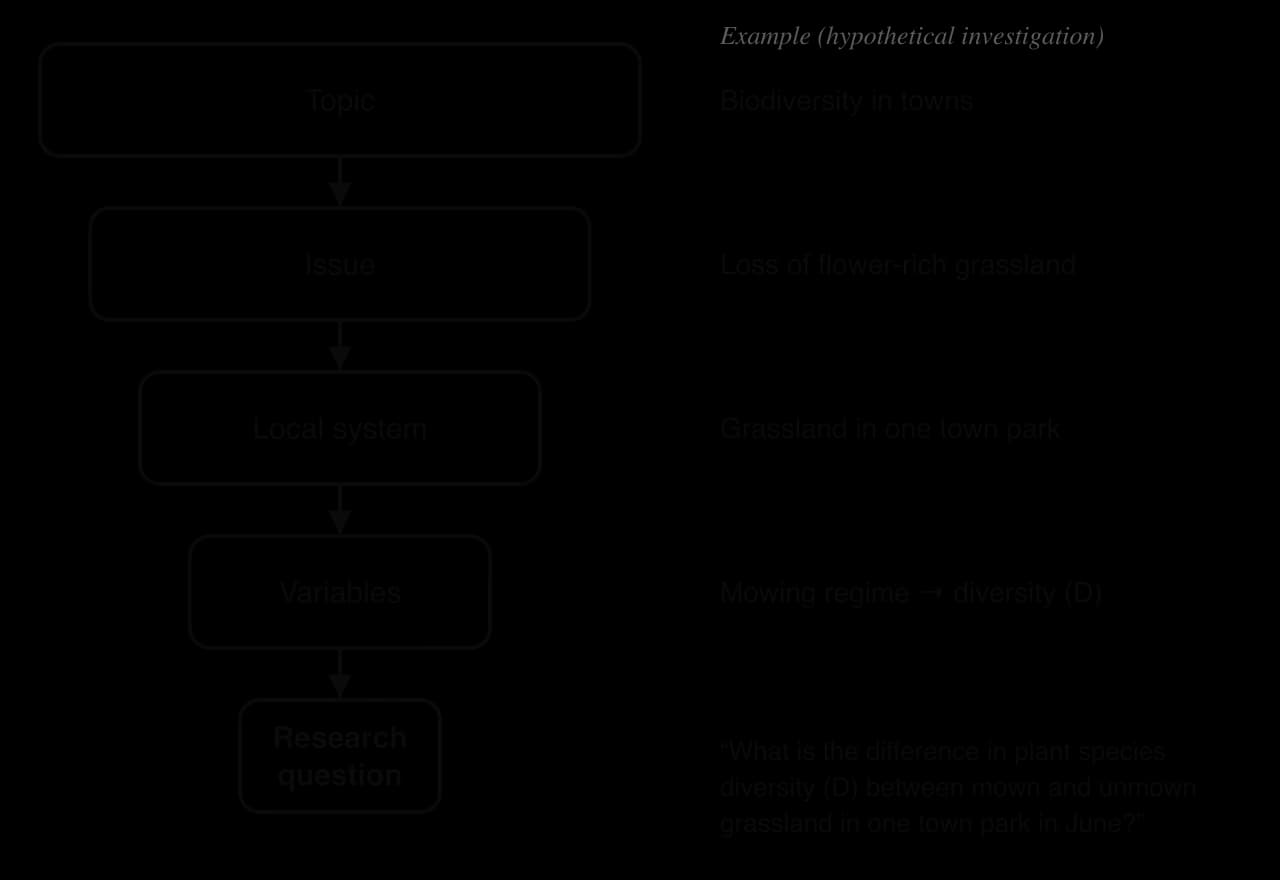
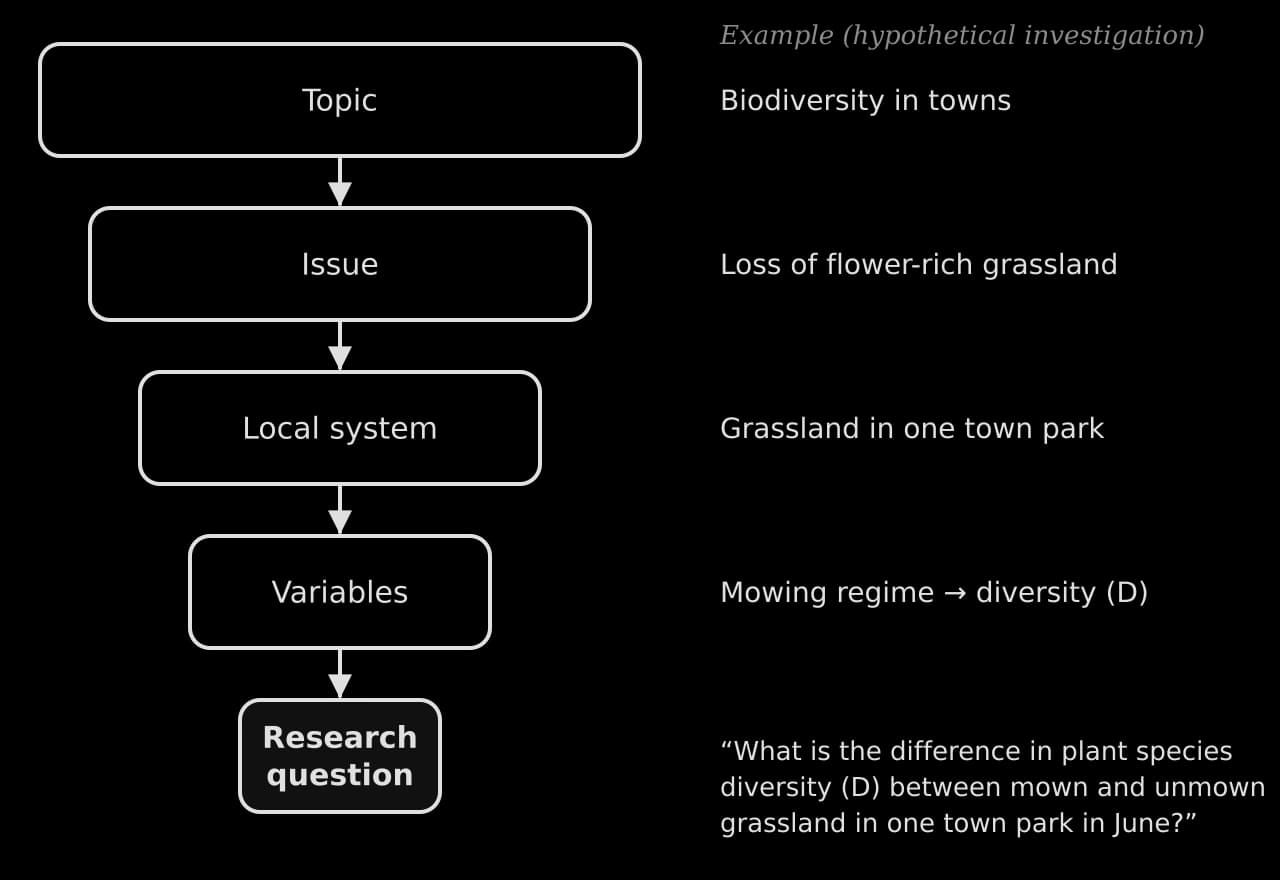
What a focused research question contains
A research question is focused when a reader can tell exactly what will be measured, in what, where and when, and when the data you plan to collect can answer it within the word limit. In practice, a focused question usually names:
the independent variable (what you change, choose or compare) with its levels or range, such as "mown every two weeks or unmown since April", or "distance from the path, 0–9 m";
the dependent variable (what you measure) and how it is expressed, such as "Simpson's reciprocal index (D)", "dissolved oxygen in mg L⁻¹" or "percentage of respondents who support…";
the system or organisms: "broadleaved plants in amenity grassland", "freshwater macroinvertebrates", "park users aged 12 and over";
the place and time, where they matter: "in one town park in June", "along a 2 km stretch of the river in October".
The wording also signals the analysis. "What is the difference between…" points to a comparison of means (a t-test or ANOVA). "What is the relationship between…" points to a correlation (Spearman's rank or Pearson). "Is there an association between…" points to a chi-squared test on counts. Choosing these words deliberately makes the rest of the report consistent.
Weak and focused research questions
Weak research question | Why it is weak | Focused version (hypothetical) |
|---|---|---|
How does mowing affect biodiversity? | No system, place or time; "biodiversity" is not a measured quantity; no levels of mowing | What is the difference in plant species diversity (Simpson's reciprocal index, D) of broadleaved plants between grassland mown every two weeks and grassland unmown since April in one town park in June? |
Is the river polluted? | A yes/no question with no variables; "polluted" is not defined | How does dissolved oxygen concentration (mg L⁻¹) change with distance (0–1,000 m) downstream of a sewage treatment works outfall on a river in October? |
What do people think about climate change? | Far too broad; no comparison or relationship; impossible to answer with a school survey | Is there an association between age group (12–17, 18–59, 60+) and willingness to pay a plastic bag charge among shoppers at one supermarket? |
Does air pollution cause asthma in big cities? | Causation cannot be shown with student data; health data are confidential; not about a measurable environmental variable | What is the relationship between daily traffic flow (vehicles per hour) and PM2.5 concentration (μg m⁻³) at a roadside monitoring station over 60 days in winter? |
The focused versions are longer, and that is normal. A research question of 25–40 words that names its variables precisely is better than a short, catchy one. If a question needs more than about two lines, it is often trying to answer two things at once and should be split, keeping the one your data answer best.
Hypotheses and predictions
Once the question is fixed, most investigations make a prediction about the answer and give a scientific reason for it, based on the background research. A prediction turns the investigation into a test: the data either support it or they do not. Some investigations, especially exploratory surveys, do not have an obvious direction, and then a hypothesis is less useful; where a statistical test is used, however, null and alternative hypotheses are always needed.
Statistical tests do not test your prediction directly. The prediction can state a direction (higher D in unmown grassland) while H₁ is written for a two-tailed test, to match the two-tailed critical values used in the analysis. They test a null hypothesis, which states that there is no difference, relationship or association, and they tell you whether the data give enough evidence to reject it in favour of the alternative hypothesis. Writing both out before collecting data makes the later analysis much clearer.
Worked example (mowing, t-test) | Survey example (chi-squared) | Transect example (Spearman's rank) | |
|---|---|---|---|
Null hypothesis (H₀) | There is no significant difference in mean D between mown and unmown grassland. | There is no significant association between age group and support for reduced mowing. | There is no significant correlation between distance from the path and species richness. |
Alternative hypothesis (H₁) | There is a significant difference in mean D between mown and unmown grassland. | There is a significant association between age group and support for reduced mowing. | There is a significant correlation between distance from the path and species richness. |
Scientific reason for the prediction | Frequent mowing removes flowering stems and favours a few low-growing, mowing-tolerant species, so fewer species reach high abundance and evenness is lower. | Different age groups use parks differently (children's play, dog walking, sport), so their values and priorities for the park may differ. | Trampling compacts soil and damages plants near the path, so only a few tolerant species survive close to it. |
The scientific reason is what turns a guess into a hypothesis, and it is where background research shows. In the worked example, the reason comes from studies of grassland management and from the course's own ideas: frequent disturbance holds a community at an early stage of succession, and a few tolerant species dominate.
Criterion A: research question and inquiry
Criterion A assesses how well the report establishes and explores an environmental issue, at a local or global scale, and develops it into a relevant and focused research question. It is worth 4 marks, in two bands.
Band | In plain words, the report… |
|---|---|
0 | does not reach the descriptors of the 1–2 band. |
1–2 | describes an environmental topic or issue, but with errors or gaps that show a limited understanding; it states a research question, but the question is not focused or is not clearly linked to the issue. |
3–4 | explains an environmental topic or issue, with enough background research to support the research question; it states a focused research question that addresses that issue. |
The jump from 1–2 to 3–4 depends on three things. The issue must be explained (why it happens, why it matters, who and what it affects), not just described. The explanation must rest on background research, such as a review of published studies, a relevant theory or a model, with sources cited in enough detail to be traced. And the question at the end must be focused and clearly answer a part of the issue just explained. A lack of focus can also show as a question that could not be answered within 3,000 words.
What to put in the background
In about 400–500 words, the background should take the reader from the wide issue to your exact question. A sequence that works for almost any topic is:
The environmental issue at a global or regional scale, with one or two facts from reliable sources (what is happening, how large it is, why it matters for ecosystems and for people).
The ESS theory or model that explains the mechanism behind your prediction, for example succession and disturbance, the effect of trampling on soil, eutrophication, the urban heat island, or perspectives and environmental value systems for a survey.
What published studies have found, including any disagreement or gaps, especially in your kind of place.
The local context: your site or population, what makes it relevant, and any local strategy or decision connected to the issue.
The research question, with the hypotheses and the reason for the prediction.
Each step should connect to the next, so that the research question reads as the natural result of the background. Citations matter: give enough detail (author or organisation, date, title, and a URL with an access date for web sources) for every source to be found. Use a consistent referencing style and a bibliography at the end; references do not count towards the word limit.
Judging the reliability of sources
Background research is only as good as its sources. Peer-reviewed papers, government and intergovernmental agencies (national environment agencies, the UN Environment Programme, the IPCC), long-running monitoring programmes and established conservation organisations are usually reliable, although each still has a perspective. Commercial websites, campaign material and unsigned blogs need more care: check who wrote it, when, what evidence it gives and whether it is selling something or campaigning for a cause. A source can be used even if it has a clear perspective, as long as the report recognises it. Criterion B makes good use of exactly such sources.
A model criterion A section
A weaker version of the same section shows what places a report in the lower band.
How a report is laid out
There is no compulsory structure, but a report that follows the order of the criteria is easier to write and easier to mark, because each criterion's evidence sits in one place. Short headings such as "Background and research question", "Strategy", "Method" and "Evaluation" help the reader find that evidence. Headings do not count towards the word limit.
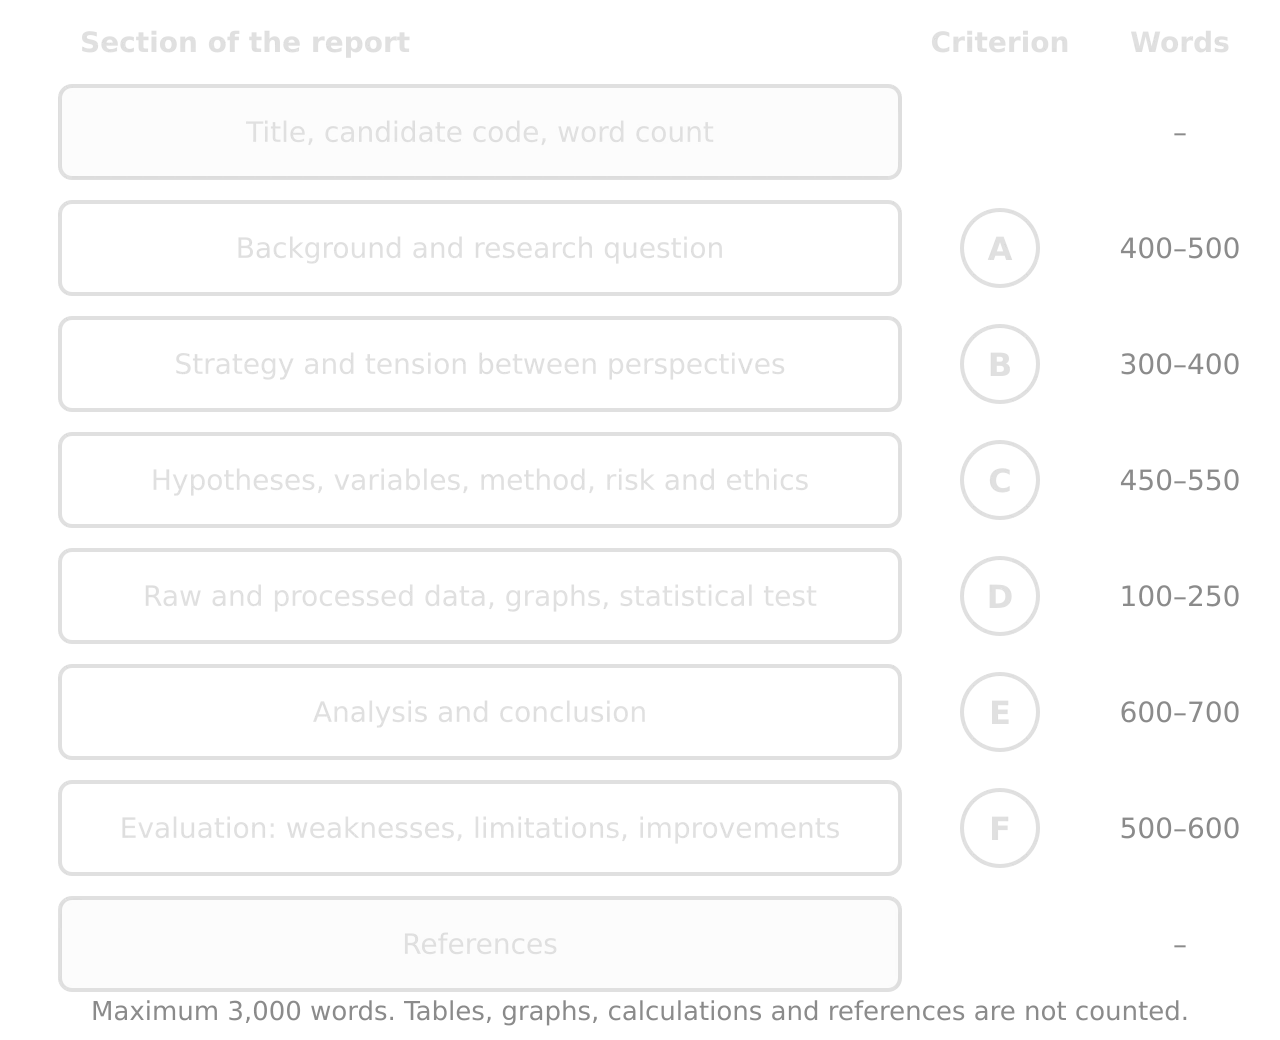
The budget is a guide: a survey may need more words for its method, a database study more for its selection rules. Its purpose is to stop the background growing to 1,200 words and leaving 300 for the evaluation, a common reason good investigations lose marks.
Planning the 10 hours
Ten hours is not much, and most students also spend time outside class reading and writing. A realistic plan protects the time for data collection and, above all, for analysis and evaluation.
Stage | Approximate class time | What you produce |
|---|---|---|
Introduction to the task and criteria | 1 hour | Notes on the criteria; a list of possible topics |
Background reading and consultation with the teacher | 1–1.5 hours | A proposal: issue, research question, hypotheses, planned method, strategy, risks |
Pilot study and refining the method | 0.5–1 hour | A tested method; changes recorded |
Data collection | 3–4 hours | Complete raw data tables and qualitative notes |
Processing, graphs and statistics | 1.5–2 hours | Processed tables, graphs, test results |
Writing and checking the draft | 1–1.5 hours | A complete draft for the one round of feedback |
Common mistakes in criterion A
Other frequent problems are listed here with their fixes.
Problem | Why it loses marks | Fix |
|---|---|---|
No references, or references that cannot be traced ("Google", "Wikipedia") | Background research must be traceable | Give author/organisation, date, title, URL and access date; use the original source behind an encyclopaedia entry |
The question and the data do not match (the question asks about "biodiversity", the data are counts of one species) | The question is not focused on what is actually measured | Rewrite the question to name exactly what was measured |
A question that cannot be answered within the word limit (several variables, several sites, several years) | Lack of focus | Keep one independent and one dependent variable |
 YouTube
Checklist for criterion A
- To do:
The report opens with the title, candidate code (and group members' codes, if any) and the word count.
- To do:
The environmental issue is explained (causes, scale, effects on ecosystems and people), not just described.
- To do:
The background uses a theory, model or published studies, with every source traceable in the references.
- To do:
The background moves from the wider issue to the local system studied.
- To do:
There is exactly one research question, clearly stated.
- To do:
The question names the independent variable and its levels or range, the dependent variable and how it is measured, the organisms or population, and the place and time.
- To do:
The null and alternative hypotheses are written out, with a scientific reason for the prediction.
- To do:
The question can be answered by the data collected, within 3,000 words.
Carry on with ESS in Augment
With a free account, Augment remembers where you stopped in the notes and which questions you have marked.