Criteria B and C: strategy and method
Describe a strategy linked to your research question and explain the tension between perspectives it creates, then design a safe, ethical, repeatable method that collects enough data.
- IB Environmental Systems and Societies
- Internal assessment
- SL and HL
Criteria B and C assess the two halves of planning that come after the research question. Criterion B asks you to step back from your data and look at a real strategy for dealing with the environmental issue, and at the tension it creates between people who see it differently. Criterion C asks for a method precise enough that someone else could repeat your investigation and collect the same kind of data for the same research question. Both are worth 4 marks, and both can usually be secured in full with careful planning before any data are collected.
Criterion B: strategy
Criterion B is the most distinctive part of the ESS internal assessment, and it has no direct equivalent in the sciences. It reflects the fact that environmental issues are never only scientific: whatever the data show, what happens next depends on decisions made by people with different values, needs and power. The criterion assesses how well you understand how tensions between perspectives can affect the environmental or societal outcomes of a strategy that addresses an issue central to your investigation.
Band | In plain words, the report… |
|---|---|
0 | does not reach the descriptors of the 1–2 band. |
1–2 | states an existing or developing strategy that addresses an environmental issue linked to the research question, and describes a tension between different perspectives (economic, social, cultural, political or environmental) that results from the strategy. |
3–4 | describes an existing or developing strategy that addresses an environmental issue linked to the research question, and explains a tension between different perspectives (economic, social, cultural, political or environmental) that results from the strategy. |
Two verbs separate the bands. The strategy must be described (what it is, who runs it, where, since when, how it works and what it is meant to achieve) rather than just named. The tension must be explained (why the groups' goals conflict, and what the conflict means for how well the strategy works), rather than just described.
What counts as a strategy
A strategy is any planned action intended to address an environmental issue. It can be existing (already in place, like a law or a protected area) or developing (proposed, being trialled or being debated, like a planned low-traffic zone). It can operate at any scale, from a school's recycling scheme to an international agreement, but local strategies are often the easiest to describe in detail and the easiest to link to your own data.
Type of strategy | Examples |
|---|---|
Laws, regulations and bans | A ban on lightweight plastic carrier bags (Kenya since 2017); a ban on lawn pesticides in public parks; fishing quotas; protected-area rules |
Economic instruments | A plastic bag charge; a congestion or emissions charge (London's Ultra Low Emission Zone, £12.50 a day, since 2019); subsidies for solar panels; deposit-return schemes |
Land and resource management | Reduced mowing of parks and verges; tree planting to cool streets; rewilding; buffer strips along rivers; boardwalks on eroding paths |
Technology and infrastructure | Constructed wetlands to treat run-off; cycle lanes; upgrades to sewage treatment; water meters |
Education, campaigns and community action | Plantlife's "No Mow May" campaign; beach cleans; school energy-saving campaigns; citizen science monitoring |
Sources: Wikipedia, "Ultra Low Emission Zone" and "Phase-out of lightweight plastic bags" (accessed 2026); Plantlife, "No Mow May" (accessed 2026).
Linking the strategy to the research question
The strategy must address an environmental issue that is linked to your research question. The issue or the strategy can be different from the one you investigated, but the connection must be clearly stated and credible. The clearest links are where the strategy directly affects the system you measured, as in the worked example, where the council's reduced mowing created the very unmown areas being sampled. A strategy that addresses the same broad issue somewhere else can also work, provided the report explains in a sentence or two why it is relevant to the question.
Research question (hypothetical) | Linked strategy | Why the link is credible |
|---|---|---|
Difference in D between mown and unmown grassland in a town park | The council's reduced-mowing policy (30% of park grassland unmown, April–August) | The strategy created the unmown areas sampled; the data test whether it achieves its aim |
Plastic fragments per kg of sand at three beaches with different visitor numbers | A deposit-return scheme for plastic drinks bottles | Bottles break down into the fragments measured; the scheme aims to reduce the input |
Association between age group and support for reduced mowing (survey) | The same reduced-mowing policy | The survey measures one of the perspectives in the tension directly |
Effect of salt concentration on cress germination (laboratory) | A city's switch from rock salt to brine or grit on roads in winter | Road salt reaches roadside soils; the experiment models its effect on plant establishment |
Relationship between tree cover and land surface temperature across districts (database) | A city tree-planting programme for street cooling | The programme assumes the relationship the data test |
Perspectives and tensions
A perspective is how an individual or group views a situation, shaped by their values, beliefs and interests. Criterion B names five kinds of perspective: economic (costs, jobs, profits, prices), social (health, safety, access, fairness, quality of life), cultural (traditions, identity, aesthetics, the meaning a place or practice has), political (decisions, power, elections, laws, who is heard) and environmental (ecosystems, species, pollution, resources). Most real disputes involve several at once.
A tension arises when a strategy serves the goals and needs of some groups while working against those of others. Tensions are not a sign that a strategy is bad: almost every strategy creates them. What matters for the criterion is understanding why the goals conflict and how the conflict shapes what the strategy achieves, for the environment and for people. The worldviews and environmental value systems studied in the course (ecocentric, anthropocentric, technocentric) are useful here, because they help explain why different stakeholders value the same outcome differently.
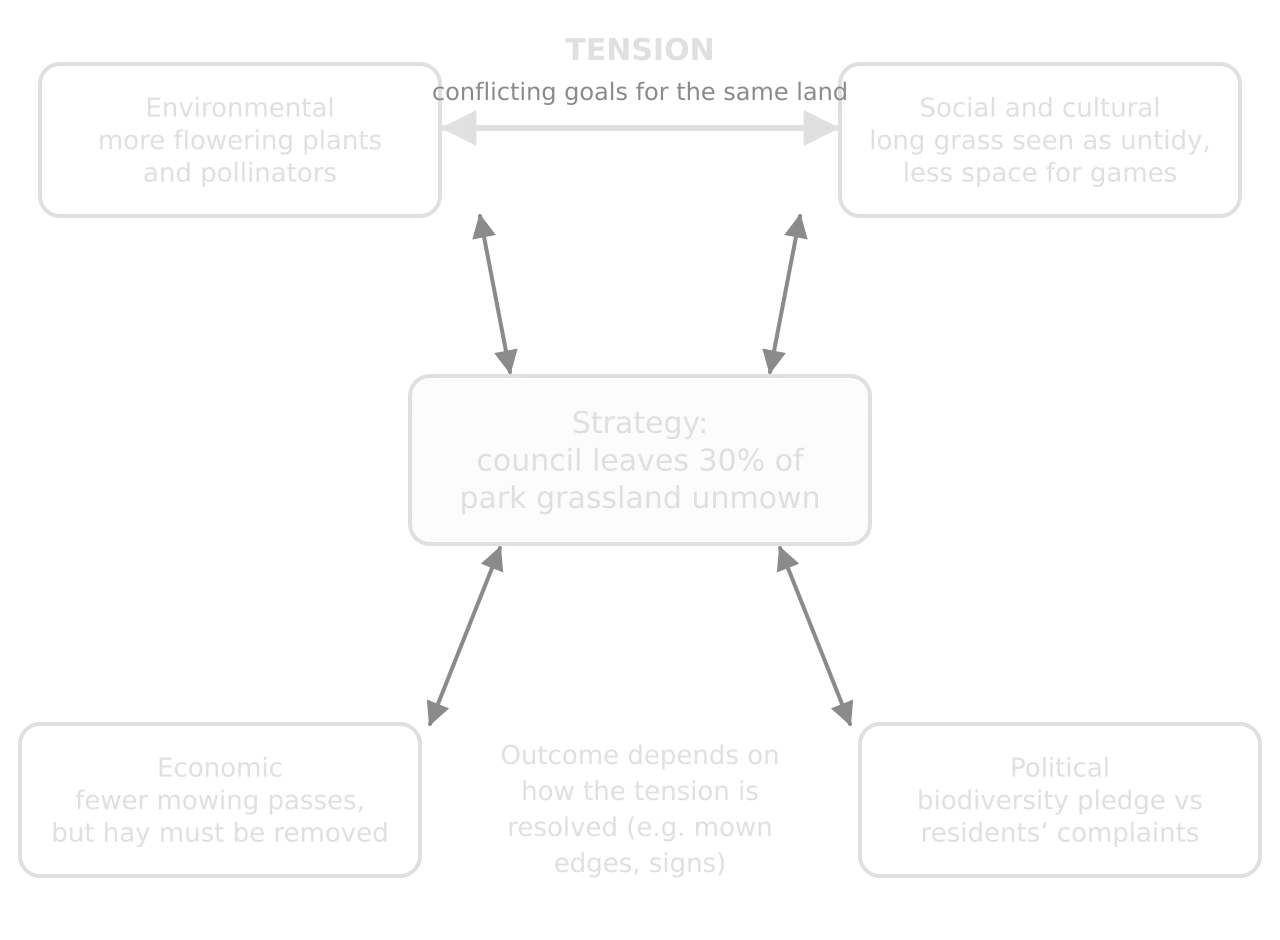
One tension explained well is worth more than four tensions listed. Choose the tension that matters most for the outcome of the strategy, ideally one your own data or your background reading can say something about.
State, describe, explain: three levels of writing
The same strategy can be written up at three levels. Only the last one reaches the top band.
Level | Strategy | Tension |
|---|---|---|
States (1–2, low) | "The council has a no-mow policy." | "Some people do not like it." |
Describes (1–2, high, or 3–4 for the strategy) | "Since last year, the council has left about 30% of its park grassland unmown between April and August, cutting it once in late summer, to provide flowers for pollinators and to meet its biodiversity pledge." | "Some residents complain that the long grass looks untidy, while the council's ecologists support it because it helps wildlife." |
Explains (3–4) | As above, with how it works (cutting regime, which areas, signs, cost) and what it aims to achieve. | Why the goals conflict: for many residents, a closely mown park is a sign of care, safety and a usable space for play and sport, so long grass is read as neglect; for the council's ecologists, short grass is a habitat of low value. Because the council depends on public support, complaints can lead it to reduce the unmown area, which would limit the biodiversity gain the strategy was designed for. A compromise (mown edges and paths through the meadow, signs explaining the aim) may keep support while keeping most of the benefit. |
A model criterion B section
A weak version shows the most common problems.
Where criterion B goes in the report
There is no fixed position for the strategy section. Many reports place it straight after the background and research question, because the strategy is part of the context that makes the question worth asking. Some return to it briefly in the conclusion, where the results can be used to comment on whether the strategy is working; that link is valuable in criterion E but does not replace a full criterion B section. Whatever the position, give it its own heading so that it is easy to find.
 YouTube
Checklist for criterion B
- To do:
A real, named strategy (existing or developing) is chosen, with a clearly stated, credible link to the research question.
- To do:
The strategy is described: who, where, since when, how it works and what it aims to achieve.
- To do:
One main tension is identified between two groups with different perspectives (economic, social, cultural, political or environmental).
- To do:
The tension is explained: why each group holds its view, why the goals conflict, and how the conflict affects the environmental or societal outcome of the strategy.
- To do:
Sources for the strategy and the views are referenced.
Criterion C: method
Criterion C assesses whether you have developed an appropriate method that collects data relevant to the research question, described in enough detail to be repeated. The data can be primary or secondary, qualitative or quantitative. The criterion has two bands.
Band | In plain words, the report… |
|---|---|
0 | does not reach the descriptors of the 1–2 band. |
1–2 | describes a method that is not repeatable, and the method does not collect enough data to address the research question. |
3–4 | describes a repeatable method, and the method does collect enough data to answer the research question. |
Two ideas carry the whole criterion: repeatability and sufficiency. A method is repeatable when another person, with only your report in hand, could set up the investigation, sample in the same way and collect the same kinds of data. It collects sufficient data when there are enough measurements, over a wide enough range, to answer the question with the planned processing and statistical test.
What a repeatable method describes
A repeatable method includes four things: the set-up (site or apparatus, with a map, diagram or photo where useful), your own contribution (what you designed or decided, as opposed to what was given), the sampling or survey technique (how sites, quadrats, samples or respondents were chosen, and how many), and how the data were collected (equipment with its precision, units, timing and order of steps). Writing the procedure as numbered steps, each with a short reason, makes it easy to follow and easy to check.
Site or source: location described well enough to be found (a sketch map, grid reference or coordinates), with dates and times; for a database, its name, URL, version and date accessed.
Equipment: each item with its size or precision (0.5 m × 0.5 m quadrat divided into 25 squares; pH meter ±0.1; electronic balance ±0.01 g).
Sampling: the design (random, systematic or stratified), the sample size and how positions or respondents were chosen.
Procedure: what was measured, how, in what order and in what units, including how organisms were identified.
Controls: the variables kept constant, and how; the variables that could not be controlled, and how they were monitored.
Risk, ethics and environmental impact: briefly, what was done to keep people and the environment safe.
Variables
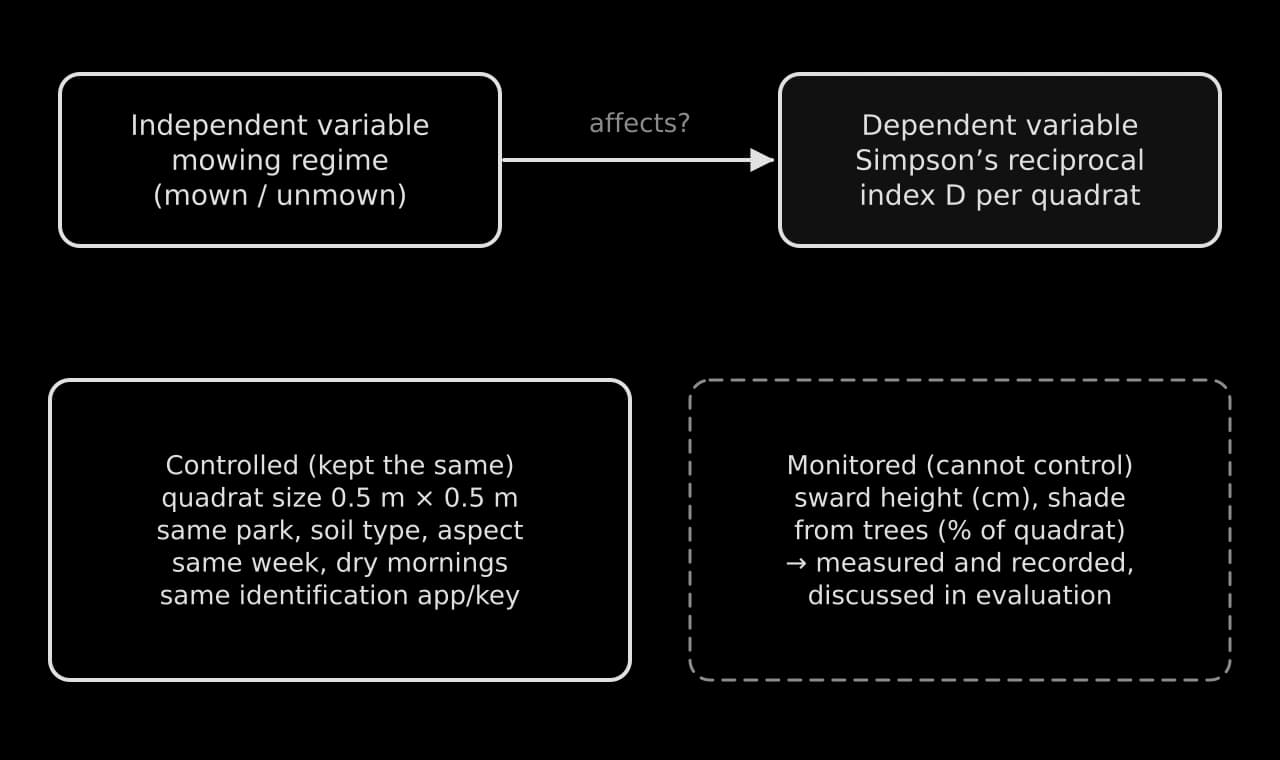
Before writing the procedure, list the variables. The independent variable is the one you change, choose or compare. The dependent variable is the one you measure. Controlled variables are everything else that could affect the dependent variable and is therefore kept the same. In the laboratory, almost all variables can be controlled. In the field and in surveys, many cannot, so the method records them instead (monitored variables), and the evaluation discusses their effect.
Controlled variable (worked example) | Why it matters | How it was controlled or monitored |
|---|---|---|
Quadrat size | Larger quadrats contain more species and individuals, which changes D | The same 0.5 m × 0.5 m quadrat for all 20 samples |
Date and time of sampling | Plants flower and become identifiable at different times | All quadrats sampled in the same week of June, 9:00–12:00, in dry weather |
Soil type, slope and aspect | Affect which species can grow | Both zones are on the same level ground with the same soil (checked with a soil texture test at five points in each zone) |
Identification | Misidentification changes species counts | The same field guide and the same plant identification app used throughout; uncertain plants photographed and checked later |
Trampling and shade (monitored) | Can reduce species near paths and under trees | Quadrats more than 5 m from paths and edges; percentage of quadrat in shade recorded |
Collecting enough data
Enough data means enough to see a pattern clearly and to run the planned statistical test (a t-test, for example) with confidence. Three decisions determine it: the sample size (how many quadrats, samples or respondents per group), the number of replicates (repeat measurements under the same conditions) and, for relationships, the range and number of levels of the independent variable.
Kind of analysis | Practical minimum | Why |
|---|---|---|
Mean and standard deviation of a group | At least 5 values, preferably 10 or more | Standard deviation needs at least five values to mean anything |
t-test or ANOVA comparing groups | About 10 or more values per group | Small samples give little power to detect a real difference |
Spearman's rank or Pearson correlation | At least 10 pairs, over a wide range of the independent variable | With fewer pairs, only very strong correlations are significant |
Chi-squared test | Enough responses that every expected frequency is 5 or more (often 50–100+ respondents) | The test is unreliable with small expected values |
Laboratory dose–response | At least 5 levels of the independent variable, each with 3–5 replicates | Shows the shape of the relationship and the variation at each level |
A pilot study is a small trial run of the method before the main data collection. It shows whether the method works in practice (whether a 0.5 m quadrat contains enough plants to calculate D, how long each quadrat takes, whether questionnaire wording is understood) and allows changes to be made before time is wasted. The changes made after the pilot are worth reporting briefly in the method, because they show your own contribution and judgement.
Sampling strategies and sampling bias
Unless every individual in a population can be measured, a sample is taken, and the way it is chosen decides whether it represents the population. Random, systematic and stratified sampling each suit different situations. Random sampling avoids bias when a habitat is fairly uniform. Systematic sampling at fixed intervals, often along a transect, suits gradients such as distance from a path or up a shore. Stratified sampling divides an area into zones that differ (here, the two mowing regimes) and samples each zone randomly or systematically.
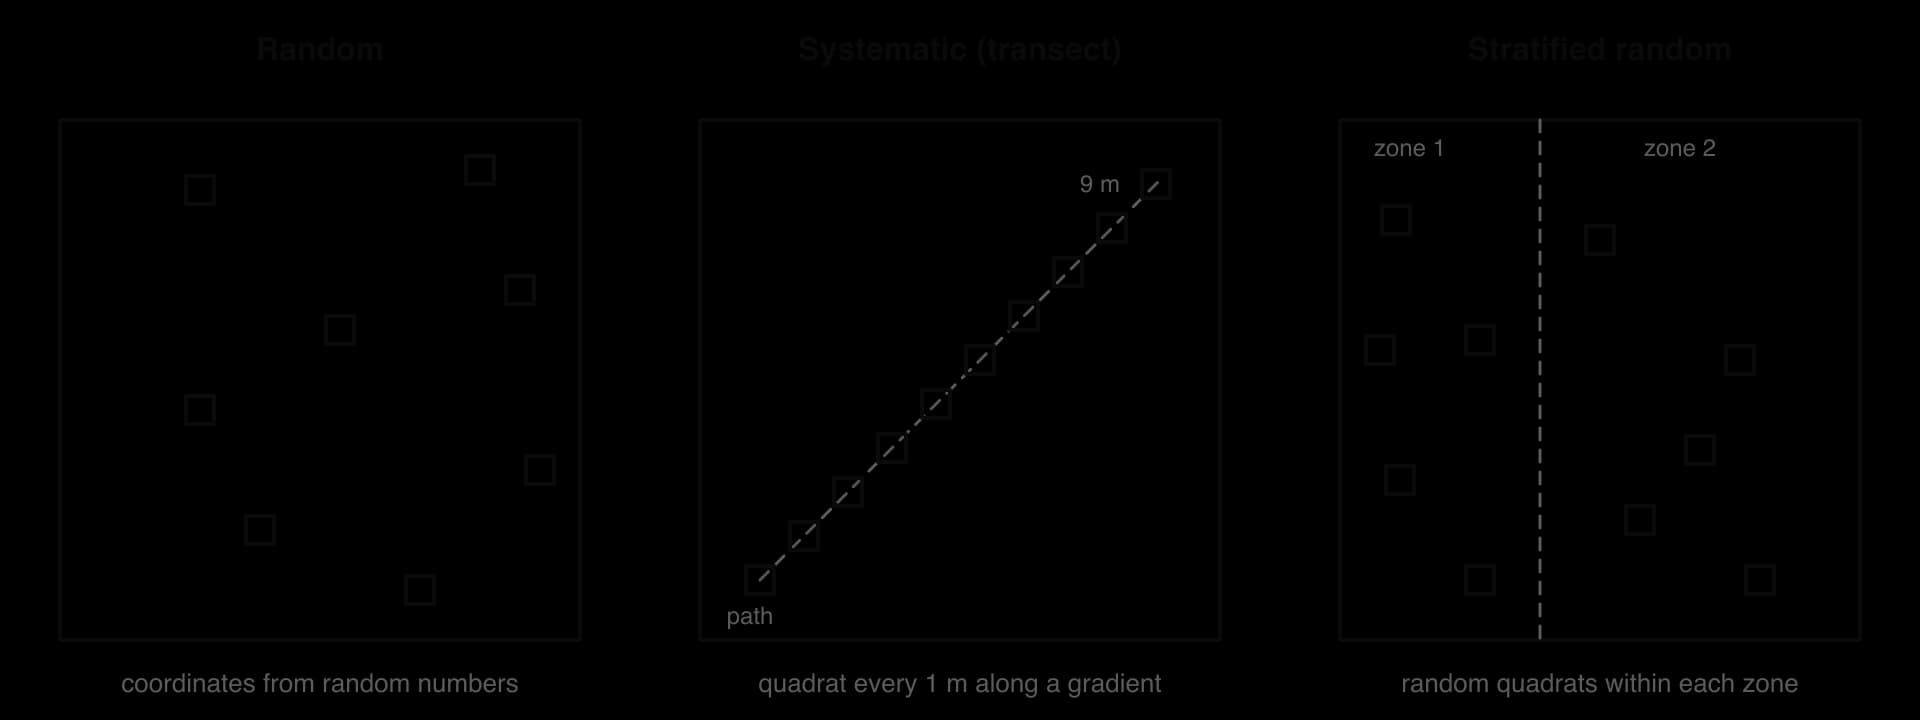
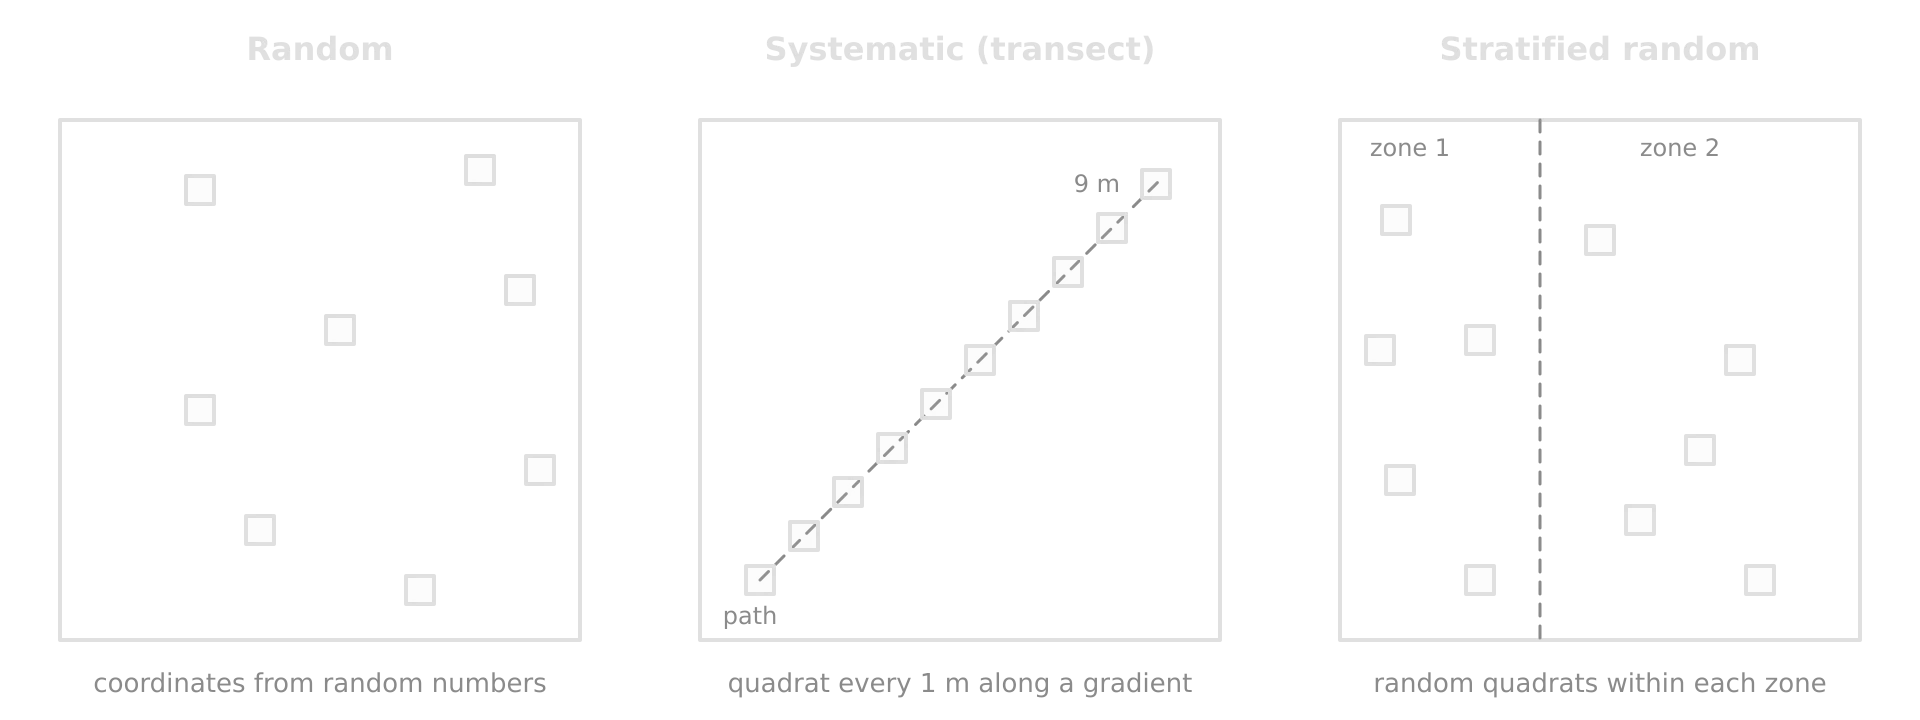
Sampling bias occurs when some members of a population are more likely to be chosen than others, so the sample is not representative. In the field, it happens when quadrats are placed where plants "look interesting" or where it is easy to walk. In surveys, it happens when only friends, or only people at one time of day, are asked. Random numbers (from a calculator, spreadsheet or random number table) to set coordinates or choose respondents are the main defence.
Methods for the four kinds of investigation
Field investigations: the worked example
Laboratory investigations
A laboratory investigation models part of an environmental system under controlled conditions. Its strength is control: one variable can be changed while others are kept constant, and many replicates can be run. Its limitation is realism: the conditions are simpler than the real system, so the conclusion must be applied to the environment with care.
Survey investigations
Surveys investigate the human side of environmental issues: knowledge, attitudes, values and behaviour. They are a natural fit for ESS, because they can measure the perspectives that criterion B discusses. They also need as much care in their method as fieldwork, because a badly designed questionnaire produces biased data.
Target audience and sampling
First decide who the target audience is and why: park users, residents of one street, students in one school, shoppers at one supermarket. Then choose and justify the sampling method and the sample size. Each method has a typical bias.
Sampling method | How respondents are chosen | Main risk of bias |
|---|---|---|
Random | Every member of the target population has an equal chance (e.g. every fifth person passing a point, at times chosen at random) | Lowest, but slow; some people refuse |
Whoever is easiest to reach (classmates, family, people near the school) | High: the sample may share age, background and views | |
People choose to take part (an online link, a poster) | High: people with strong views are more likely to answer | |
People chosen deliberately because they have relevant knowledge or roles (park staff, councillors, farmers) | Not representative of the public, but useful for expert views |
Writing the questions
Questions can be closed (respondents choose from given answers, such as yes/no, multiple choice or a Likert scale from "strongly disagree" to "strongly agree") or open (respondents answer in their own words). Closed questions give data that can be counted and tested statistically; open questions give richer qualitative data that are harder to analyse. Most investigations use mainly closed questions, with one or two open ones to explain the answers.
Problem | Weak question | Improved question |
|---|---|---|
Leading (suggests the answer) | Do you agree that the wildflower areas are good for bees? | How do you feel about the unmown areas in this park? (Likert scale: strongly dislike … strongly like) |
Two questions in one | Do you use the park for sport and walking? | Which of these do you use the park for? (tick all that apply) |
Vague terms | Do you often visit the park? | How many times did you visit this park in the past 7 days? (0, 1–2, 3–5, 6 or more) |
Sensitive or unnecessary | What is your address and income? | Ask only what the research question needs (e.g. age group in bands) |
A survey is always piloted with a few people from the target audience, who are then asked whether any question was unclear. Questions that are misunderstood are rewritten before the main survey.
Ethics in surveys
Respondents take part only with informed consent: they are told the purpose of the survey, how their answers will be used and that they can stop at any time, and they agree before answering. A consent statement at the start of a paper or online questionnaire serves as written consent. Respondents should be over the age of 12 (younger children are surveyed only if school rules allow it, with a parent's or guardian's consent), answers are anonymous (no names, contact details or anything that identifies a person), and the data are stored securely and used only for the investigation.
Database investigations
In a database investigation, the data are secondary: collected by someone else, such as a national statistics office, a monitoring network, a research group or a citizen science project. The method is then about selection: which database, why it is reliable, and exactly how the data were filtered and sampled to answer the question. Without these rules, the investigation cannot be repeated, and it risks becoming a description of whatever data happened to be found.
Risk assessment, ethics and environmental impact
Every method includes a short account of how risks to people and the environment were assessed and reduced. Two rules apply to all practical work in IB sciences: no investigation involving other people takes place without their written consent and their understanding of what it involves, and no investigation inflicts pain on, or causes distress to, humans or live animals. Schools also follow their own national and local safety rules.
Hazard (worked example) | Risk | Precaution |
|---|---|---|
Working near water, roads or in public places | Accidents; getting lost; personal safety | Work in pairs or a small group; teacher informed of times and place; phone carried |
Ticks, stinging plants, sharp litter, dog faeces | Bites, infection, cuts | Long trousers and closed shoes; gloves when handling the quadrat; check for ticks afterwards; hands washed |
Sun and heat | Sunburn, dehydration | Sun cream, hat, water; work in the morning |
Damage to the habitat | Trampling the unmown area; removing plants | Walk along the same route to each quadrat; kneel, do not lie in the grass; photograph rather than pick plants |
Disturbing park users | Complaints; distress to others | Permission from the council's park manager; explain the work if asked |
Ethical and environmental questions differ between the four kinds of investigation. Field investigations should minimise trampling and disturbance, return any animals unharmed to where they were caught, keep sample sizes no larger than needed and have the landowner's permission. Laboratory investigations should dispose of chemicals and organisms safely and responsibly. Surveys need consent, anonymity and respect for people's time and privacy. Database investigations should use data that are openly published and use them in line with their licence, and should acknowledge the source.
Weak and strong methods compared
Checklist for criterion C
- To do:
The independent, dependent and controlled variables are listed, with monitored variables for anything that cannot be controlled.
- To do:
The site or data source is described well enough to be found again (map, coordinates, database name, URL, date accessed).
- To do:
The sampling or survey design is stated and justified, with how positions or respondents were chosen at random.
- To do:
The sample size and number of replicates are enough for the planned statistical test.
- To do:
Equipment is listed with its size or precision, and units are given for every measurement.
- To do:
The procedure is written as numbered steps that someone else could follow.
- To do:
Your own contribution is clear, including changes made after a pilot study.
- To do:
Risks, ethics (consent, anonymity, animal welfare) and the environmental impact of the investigation are addressed.
Carry on with ESS in Augment
With a free account, Augment remembers where you stopped in the notes and which questions you have marked.