Paper 2 Section B: structured essays
Write high-scoring Section B essays: how the 4 + 7 + 9 marks work, the markbands in plain words, planning, using case studies, perspectives and conclusions, with two complete model essays and commentary.
- IB Environmental Systems and Societies
- Exam skills
- SL and HL
Section B of Paper 2 is made up of structured essay questions worth 20 marks each. SL students answer one question from a choice of two; HL students answer two from a choice of three. Each question is split into parts that build from knowledge to evaluation, usually 4 + 7 + 9 marks, and the final 9-mark part is marked with markbands rather than individual marking points.
The essays are where ESS is most itself: an issue seen as a system, explained with precise concepts, illustrated with real places and data, viewed from several perspectives and finished with a supported judgement. Strong essays are not longer than weak ones. They are better planned, use fewer but sharper examples, and end with a conclusion that actually answers the question.
How the 20 marks are split
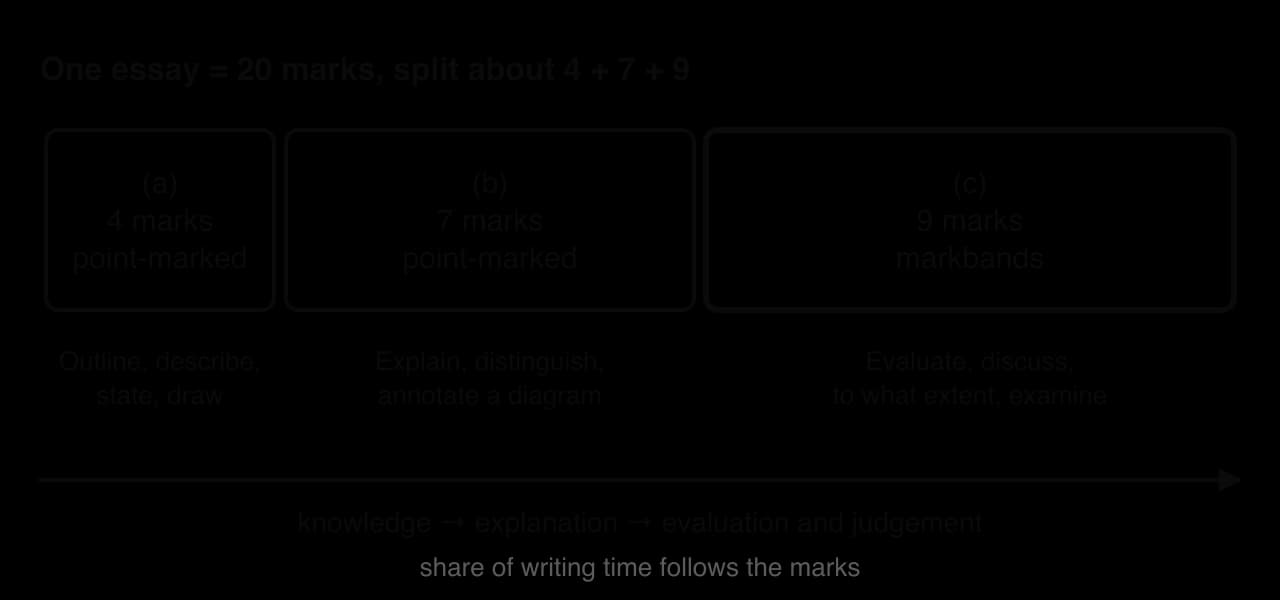
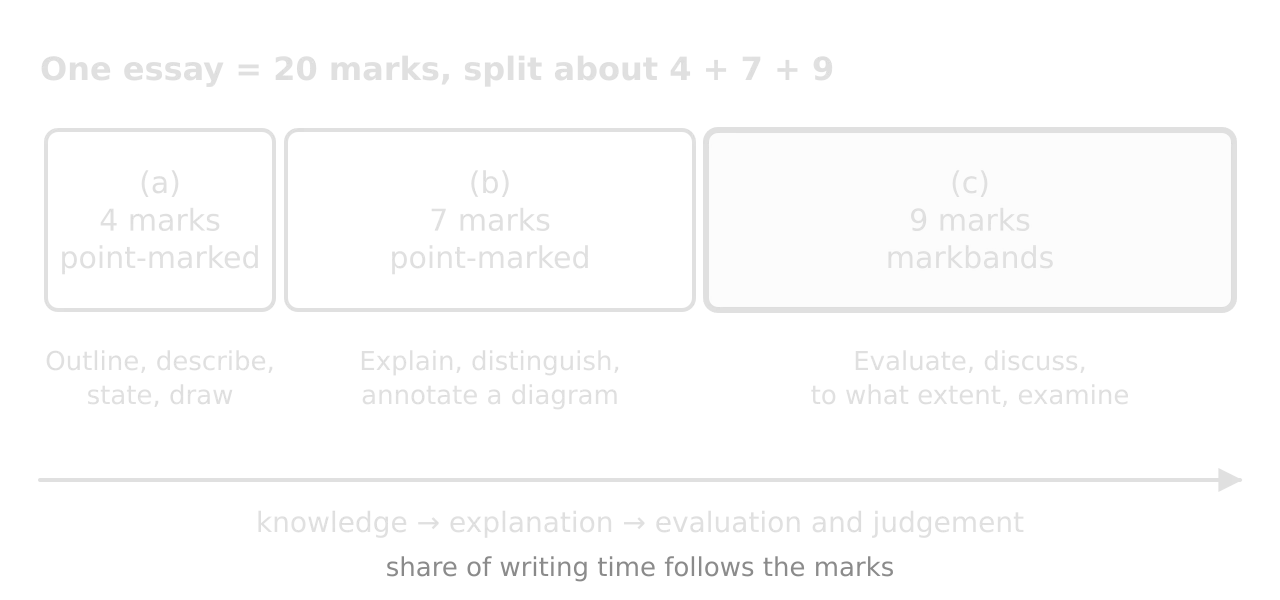
Part | Typical marks | Typical command terms | How it is marked | What it needs |
|---|---|---|---|---|
(a) | 4 | Outline, describe, state, draw, identify | Markscheme points, one mark each | Four distinct, precise points, or a labelled diagram |
(b) | 7 | Explain, distinguish, describe, annotate | Markscheme points, one mark each | Seven or more linked points: mechanisms, a diagram, a named example |
(c) | 9 | Evaluate, discuss, to what extent, examine, justify | Markbands, judged as a whole | Balanced argument, well-explained examples, perspectives and a supported conclusion |
Parts (a) and (b) are marked exactly like Section A: each valid, distinct point earns a mark up to the maximum. A relevant labelled diagram can earn several of those points at once, as long as its labels carry the content. Part (c) is different. It is judged as a whole: the marker decides which band of descriptors fits the answer best, and then chooses a mark within that band.
Parts (a) and (b): writing for marking points
Part (a) usually tests knowledge: a definition with an outline, a list of factors, a simple diagram. Part (b) asks for more developed understanding, typically an explanation of a process, a comparison, or an annotated diagram with an example. Both are written as a sequence of clear points, without introduction or conclusion.
For 7 marks, aim for eight or nine points so that the maximum is reached even if one or two are not credited. A short paragraph per stage of the process works well: each paragraph contains two or three marking points, joined by “because”, “so” and “which”.
The markbands for part (c), in plain words
The markbands describe the qualities of an answer at each level. They are the same at SL and HL; at HL the descriptors also look for knowledge of the HL lenses (law, economics and ethics) used in the argument. The table restates each band in plain words.
Band | Knowledge and understanding | Examples | Analysis | Judgement |
|---|---|---|---|---|
0 | Nothing that reaches the band 1–3 descriptors | — | — | — |
1–3 | A little relevant knowledge, in fragments, loosely linked to the question; some correct terms | Missing, or named without explanation or relevance | Superficial: a list of points rather than an argument | Vague or unsupported |
4–6 | Sound knowledge, clearly linked to the question; mostly correct terms | Some relevant examples, but not fully explained | Clear, with some balance (more than one side) | Some clear judgements, supported by limited evidence |
7–9 | Substantial, wide-ranging knowledge whose ideas are linked to each other and to the question; precise terms throughout | Well-chosen examples, explained and used as evidence, with some originality | Thorough, well balanced and insightful | Explicit conclusions, well supported by evidence and argument, with some critical reflection |
What moves an answer up a band
The differences between bands come down to a small number of habits. Each can be practised.
Linking, not listing. A list of five strategies is band 1–3 analysis. Showing how they interact (“tariffs only worked because restrictions were enforced at the same time”) is band 7–9 analysis.
Examples used as evidence. Naming a case earns little; using two precise facts from it to support or challenge a point earns a great deal. “Some originality” means examples that are less obvious, local, recent or used from an unexpected angle.
Balance. “Evaluate”, “discuss” and “to what extent” all need arguments on more than one side. One-sided answers rarely leave band 4–6, however detailed.
Perspectives. Different environmental value systems and stakeholders judge the same strategy differently; saying who gains and who loses is a form of balance.
A real conclusion. An explicit answer to the question, weighed and justified, with some critical reflection: what the judgement depends on, what is uncertain, where it might not apply.
The same argument written at three bands
Question: “Discuss the effectiveness of international agreements in protecting the stratospheric ozone layer. [9]”
Band 1–3 extract: “The Montreal Protocol banned CFCs. This was good because CFCs destroy ozone. The ozone layer is getting better now. Some countries did not follow it. So it was quite effective.” Fragmented, no evidence, no mechanism, judgement unsupported.
Band 4–6 extract: “The Montreal Protocol (1987) phased out CFCs, which release chlorine in the stratosphere that breaks down ozone. Production of ozone-depleting substances has been cut by about 99%, and the Antarctic ozone hole has stopped growing. However, some illegal CFC-11 production was found later, so enforcement is a weakness. The Protocol has been mostly effective.” Sound knowledge and some balance, but the example is not developed and the judgement is brief.
Band 7–9 extract: “The Montreal Protocol is the clearest success of international environmental law: all 198 parties have ratified it, production of ozone-depleting substances has fallen by about 99%, and recovery over Antarctica is projected for about 2066. Its success depended on conditions that are rarely met together: a small number of producers, cheap substitutes, a fund to help lower-income countries, and a dramatic, visible signal in the ozone hole. Those conditions also show its limits. HFC substitutes protected ozone but are powerful greenhouse gases, which needed the Kigali Amendment (2016), and illegal CFC-11 production shows that agreements need monitoring. The agreements have been highly effective for ozone, but mainly because the problem was unusually tractable, which is why the same model has been far less effective for climate change.” Linked ideas, precise evidence, balance and a conclusion that reflects on why.
Planning the essay
A plan stops the two commonest faults of part (c) answers: running out of examples halfway through, and writing a conclusion that does not match the argument. A plan for part (c) can be written in a few lines and should take only a small share of the time.
Decode the question. Underline the command term, the issue and any limits (“in a named country”, “for a named ecosystem”). Define any key term the argument depends on.
Choose a line of argument. Decide the likely answer first, then the evidence for and against it. The conclusion is easier to write when the direction is clear from the start.
Allocate examples. Two or three named examples, ideally from different scales, places or income levels, each with one or two numbers.
Add perspectives and scale. Who gains and who loses; ecocentric, technocentric and anthropocentric views; short term and long term; local and global.
Write the conclusion in the plan. One sentence that answers the question and says what the answer depends on.
Using case studies well
Examples are the evidence of an ESS essay. The markbands reward examples that are pertinent (chosen for this question), well explained (their link to the point is made clear) and used with some originality. The same case study can be used weakly or strongly.
Weak use | Strong use |
|---|---|
“For example, Cape Town nearly ran out of water.” | “In Cape Town, restrictions tightened from 100 to 50 litres per person per day between 2017 and 2018, and total use fell by more than half, which shows that demand management can work quickly when it is enforced and the threat is visible.” |
Narrates the whole case from start to finish | Selects the two facts that support the point being made |
The same famous case in every essay | A mix: one well-known case, one less familiar or local example, from different regions |
Examples at the end of a paragraph, unconnected | Point → evidence from the example → explanation of the link → a qualifying comment |
A reliable paragraph structure for part (c) is point, evidence, explanation, evaluation. State the argument; support it with a fact from a named case; explain how the fact supports the point; then qualify it (“however, this depended on…”, “this was less effective for…”). Each paragraph then contributes to the balance and the judgement, not just to knowledge.
Perspectives, evaluation and conclusions
Evaluation in ESS weighs strengths and limitations against criteria. The most useful criteria are effectiveness (does it solve the problem, by how much, how fast?), sustainability (environmental, social and economic, and over what time), equity (who gains and who pays, now and in the future) and feasibility (cost, technology, politics, enforcement). Naming the criterion makes the evaluation explicit.
Perspectives add depth to the same criteria. A technocentric view may judge a desalination plant a success because it supplies water reliably; an ecocentric view may judge it a failure because of its brine and energy use; an anthropocentric view may ask whether the water is affordable to the poorest households. Showing that the answer depends on the perspective is itself a judgement, and a sophisticated one.
Writing the conclusion
A conclusion answers the question in the words of the question, says how far the answer holds, and reflects briefly on the evidence. It does not introduce new examples or simply summarise each paragraph.
Model essay 1: water systems and water security
The first model essay is on water. It shows a point-marked part (a), an explanation in part (b) that uses systems language and two short examples, and a part (c) evaluation built around one case with a second for comparison. The answers are written at the standard of a high-scoring SL candidate; the commentary after each part explains the marks.
Part (a) [4]
Physical water scarcity occurs when there is not enough water in a region to meet the demands of its people and ecosystems, because of a dry climate or because abstraction has exceeded the supply. Economic water scarcity occurs when enough water exists, but a lack of money, infrastructure or effective institutions prevents people from obtaining it.
The first difference is the cause: physical scarcity is a shortage of the resource itself, while economic scarcity is a shortage of access to a resource that is present. The second difference is the solution: physical scarcity requires demand to be reduced or new sources found, such as desalination or imported water, while economic scarcity can be reduced by investment in wells, pipes, storage and water treatment.
Commentary on part (a): 4/4
Two differences are stated for both types of scarcity [2], and each is developed with the reason or an example [2]. The opening definitions are not wasted: they make the differences precise. A third difference (typical regions, such as arid North Africa for physical scarcity and much of sub-Saharan Africa for economic scarcity) would be a useful extra point if one of the four were not credited.
Part (b) [7]
A lake or an aquifer can be treated as a storage in a system: its volume changes by the difference between its inputs (precipitation, river inflow, infiltration and percolation) and its outputs (evaporation, outflow, seepage and abstraction). Human activities change the volume whenever they change one side of this balance more than the other.
Diverting rivers reduces the inputs to a lake. From the 1960s, water from the Amu Darya and Syr Darya was taken to irrigate cotton in Central Asia, so inflow to the Aral Sea fell to a small fraction of its former size while evaporation from its surface continued. With outputs much greater than inputs, the lake level fell by 80–90 cm a year in the 1980s and the lake split into separate northern and southern parts.
Abstraction adds an output to an aquifer. When water is pumped faster than rainfall and rivers recharge it, the water table falls. In Punjab, India, the spread of irrigated rice since the Green Revolution means that groundwater use was about 26 billion m³ a year in the 2025–26 assessment against a recharge of about 19 billion m³, so the aquifer is being depleted year after year.
Land-use change alters inputs indirectly. Urbanisation replaces soil and vegetation with impermeable surfaces, so more rain becomes surface run-off and less infiltrates to recharge groundwater. Deforestation reduces interception and transpiration, which can increase run-off and flooding downstream while reducing water held in the soil. Dams create new stores, but they increase evaporation from a large open surface and reduce flow to stores downstream. Some activities increase inputs deliberately, for example artificial recharge, where surplus surface water is fed into an aquifer.
Commentary on part (b): 7/7
The answer earns marks for the systems framing (storage changes with inputs minus outputs) [1]; river diversion reducing inflow [1] with the Aral Sea as evidence [1]; abstraction exceeding recharge [1] with the Punjab figures [1]; urbanisation reducing infiltration [1]; deforestation [1]; dams adding evaporation and reducing downstream flow [1]; and artificial recharge [1]. That is nine creditable points for seven marks, which protects the score if a marker does not accept one. Both examples are used as evidence of a mechanism, not narrated.
Part (c) [9]
Water security is reliable access to enough safe water to sustain the health, livelihoods and well-being of a population over time. Cape Town, South Africa, is a strong test of strategies to achieve it, because between 2015 and 2018 the city came close to turning off its household taps on a date it called “Day Zero”, when its reservoirs would fall to 13.5% of capacity.
The crisis had physical and human causes. Three consecutive dry winters from 2015 to 2017 reduced the input to the six reservoirs that supply the city, and 2017 was the driest year since records began in 1933. However, the city’s population grew by about 71% between 1995 and 2015, while its dam storage capacity rose by only 17%, so the system had little buffer. A climate attribution study found that climate change had made such a drought about three times more likely, which means the risk is rising.
The most effective strategy was demand management. Legal restrictions tightened from 100 litres per person per day in June 2017 to 50 litres in February 2018, backed by steeply rising tariffs for high users, fines and devices that cut off supply to households that repeatedly exceeded their limit. Total use fell by more than half, to about 500 million litres a day, and farmers in the Western Cape cut their use by about 60%.
This shows that demand can fall far faster than new supply can be built, and at much lower cost. Communication was part of the strategy: a specific Day Zero date turned an abstract risk into a deadline that households, schools and businesses responded to.
Supply augmentation played a smaller role. The city pumped extra groundwater from the Atlantis aquifer and contracted three small temporary desalination plants, but it dropped plans for a large permanent plant because of its high cost per unit of water. From a technocentric perspective, this was a missed opportunity to make the city independent of rainfall; from an ecocentric perspective, avoiding the brine and energy use of large-scale desalination was sensible when demand could be cut instead.
Equity was the weakest part of the response. About a fifth of Cape Town’s people live in informal settlements, where many already relied on communal taps and used very little water, so they could not cut further, while wealthier households could drill boreholes or buy tanks. Around 37,000 jobs were lost in the Western Cape, mostly in agriculture, and the city lost nearly R2 billion in water sales because people used less, making it harder to pay for new supply. From an anthropocentric, social perspective, a strategy that relies on everyone cutting use places the heaviest relative burden on those with the least choice.
Restrictions also had a limit in time. Day Zero never arrived mainly because rain returned: above-average winter rainfall in 2018 refilled the dams to 76%, and Day Zero was postponed indefinitely in June 2018. They bought time but did not change the city’s reliance on a single rain-fed source. Singapore offers a contrast: through its Four National Taps it combines local catchment, imported water, recycled NEWater and desalination with pricing and conservation, so no single dry period can threaten supply. Since the crisis, Cape Town’s Water Strategy (2020) has committed the city to diversify its supply in the same way, adding more than 300 million litres a day from groundwater, water reuse and desalination.
On balance, Cape Town’s strategies were highly effective in the short term: a large, middle-income city halved its water use within about two years and avoided disaster. They were less successful as a long-term solution to water security, because they relied on rain returning, imposed unequal costs and left the city dependent on one type of source. The experience suggests that demand management should be the first and cheapest response to scarcity, but that lasting water security in a warming climate needs a diversified supply as well, as Singapore shows, with attention to who pays for each strategy.
Commentary on part (c): band 7–9, 9/9
Markband quality | Where the answer shows it |
|---|---|
Substantial knowledge, linked to the question | Defines water security; separates physical and human causes; explains why demand management worked (enforcement, tariffs, communication) |
Precise terminology | Water security, demand management, supply augmentation, input, buffer, technocentric, ecocentric, anthropocentric |
Pertinent, well-explained examples with some originality | Cape Town used as evidence throughout with dated figures; Singapore used briefly as a contrast, not a second narrative |
Balanced, insightful analysis | Strengths and limitations of each strategy; equity; short-term versus long-term success; the role of rainfall |
Explicit, well-supported conclusion with critical reflection | Distinguishes short-term from long-term success, says what lasting security would need, and notes who pays |
A lower-scoring answer on the same case would describe the crisis in sequence and end with “Cape Town managed its water well”. The facts would be the same; the analysis and judgement would not.
Model essay 2: biodiversity and conservation
The second model essay is on biodiversity. Part (b) shows how to explain a process using a single case as evidence at each stage, and part (c) shows a “to what extent” answer that reaches a conditional judgement. As before, the commentary follows each part.
Part (a) [4]
Biodiversity provides goods directly: food, timber, fibres and medicines come from wild and farmed species, and wild relatives of crops hold genetic variation used to breed crops resistant to disease or drought. It supports ecosystem services such as pollination of crops, decomposition and nutrient cycling, and the regulation of climate and water by forests and wetlands. It has cultural, spiritual and aesthetic value, for example in recreation, tourism and the identity of Indigenous peoples whose cultures are tied to particular species and places. Many people also hold that species have intrinsic value, a right to exist regardless of their usefulness to humans.
Commentary on part (a): 4/4
Four distinct reasons, each with a brief example: goods and genetic resources [1], ecosystem services [1], cultural and aesthetic value [1], intrinsic value [1]. Splitting “food” and “medicine” into separate reasons would risk being counted as one point (provisioning).
Part (b) [7]
An invasive species is a non-native species that spreads rapidly in a new ecosystem and harms native species. Invasive species often reduce biodiversity because they arrive without the predators, parasites and diseases that controlled them in their native range, so their populations can grow exponentially.
The Nile perch (Lates niloticus), a large predatory fish, was released into the Lake Victoria basin in Uganda in the 1950s to create a commercial fishery. The lake held more than 500 species of haplochromine cichlids, almost all endemic. The perch remained rare for about twenty years, making up only about 0.15% of fish biomass in the early 1970s, then its population grew explosively: near Jinja its share of the commercial catch rose from 13.4% in 1981 to 75.1% in 1982.
Predation was the main mechanism. The cichlids had evolved without a large fish predator of this kind, so they had no effective defences, and the perch ate them faster than they could reproduce. At least 200 cichlid species, about 40% of the haplochromines, are estimated to have become extinct. Because many were endemic, their extinction was a global loss of species diversity, not only a local one.
The loss spread through the food web. Many cichlids fed on algae and detritus, so their disappearance allowed more organic matter to sink and decompose, which, together with nutrients from farm run-off and sewage, reduced oxygen in deeper water and removed a refuge for the remaining fish. Other mechanisms by which invasive species reduce biodiversity include competition for food or space, the introduction of disease and hybridisation with native species.
Commentary on part (b): 7/7
Credited points: definition of an invasive species [1]; absence of natural controls leading to exponential growth [1]; the named species and place [1]; endemic cichlid diversity [1]; evidence of explosive growth with data [1]; predation on prey without defences [1]; extinction figures and why endemism makes the loss global [1]; food-web effects on oxygen [1]; other mechanisms (competition, disease, hybridisation) [1]. Nine points for seven marks. The data are short and each is used to support a stage of the explanation.
Part (c) [9]
A protected area is an area of land or sea set aside in law, and managed, mainly to conserve biodiversity, ranging from strict reserves to national parks where people live and work. Under the Kunming–Montreal Global Biodiversity Framework, adopted in 2022, governments aim to conserve 30% of land and sea by 2030, so the question of how well protected areas work is central to global conservation.
Protected areas can conserve biodiversity very effectively where the main threats are local and can be controlled. Gorongosa National Park in Mozambique lost about 96% of its large herbivore biomass during the civil war of 1977–1992, mainly to hunting. Once protection was restored, and particularly after a public–private partnership began managing the park in 2008, herbivore biomass in the surveyed area recovered to about 95% of its pre-war level by 2018. Most of the recovery came from natural population growth once hunting stopped, which shows that protection alone can regenerate populations if enough survivors remain.
However, recovering numbers is not the same as recovering the ecosystem. In Gorongosa, waterbuck now dominate the herbivore biomass, while buffalo, zebra and large predators remain far below their former numbers, so the community is very different from the one that was lost. Protected areas conserve what remains inside them; they cannot easily restore species that have been lost, and reintroductions such as Gorongosa’s wild dogs and leopards depend on sustained funding. Small or isolated reserves also lose species over time, because populations are small and edge effects are large, which is why corridors linking reserves are important.
Protected areas are least effective against threats that cross their boundaries. The Great Barrier Reef has been a marine park since 1975 and a World Heritage Site since 1981, yet a marine heatwave in 2016 killed an estimated 29–50% of its coral, and mass bleaching has recurred repeatedly since. No management inside the park can stop ocean warming caused by global greenhouse gas emissions, so protection must be combined with climate mitigation. Similarly, pollution, invasive species and changes in river flow can enter a reserve from outside.
Effectiveness also depends on governance and people. Many protected areas are “paper parks”, declared in law but without the staff, funding or enforcement to stop poaching, logging or settlement. Where protection has excluded local people, as when the Twa were displaced from land that became Volcanoes National Park in Rwanda, it has caused injustice and can turn communities against conservation. From an ecocentric perspective, strict protection gives nature priority; from an anthropocentric perspective, protected areas succeed only when local people share the benefits, as Gorongosa’s investment in health care, schools and shade-coffee incomes on Mount Gorongosa attempts to do.
Protected areas can therefore conserve biodiversity to a large extent where threats are local, management is well funded and local communities support it, as Gorongosa’s recovery shows. Their effect is much more limited against global pressures such as climate change, and where they exist only on paper.
The evidence suggests that protected areas are necessary but not sufficient: they work best as part of a wider strategy that includes corridors, sustainable use of the land and sea around them, and global action on emissions. A limitation of this judgement is that most evidence measures numbers of a few large species, while changes in less visible groups, such as invertebrates, are rarely monitored.
Commentary on part (c): band 7–9, 9/9
Markband quality | Where the answer shows it |
|---|---|
Substantial knowledge, ideas linked | Links protection to threat type, ecosystem structure, reserve size and isolation, and governance; each paragraph builds on the last |
Precise terminology | Protected area, biomass, community, reintroduction, corridors, edge effects, paper parks, ecocentric, anthropocentric |
Pertinent examples with some originality | Gorongosa as the main case with data; the Great Barrier Reef for the opposite argument; the Twa and Volcanoes National Park as a justice point from a third region |
Balanced, insightful analysis | Separates numbers from ecosystem recovery; local from global threats; law from enforcement |
Explicit judgement with critical reflection | “To a large extent where…”, “necessary but not sufficient”, and a limit to the evidence itself |
The final sentence of the conclusion is the clearest example of critical reflection: it questions the evidence on which the judgement rests. One sentence of this kind is enough; a whole paragraph of caveats would weaken the judgement.
Common mistakes in Section B
Most lost marks in part (c) come from the structure of the argument, not from a lack of knowledge. The table lists the most common faults and how to fix them.
Fault | Effect on the markband | Fix |
|---|---|---|
Describing a case study from start to finish | Knowledge without analysis: band 4–6 at best | Select the facts that support each point |
Only advantages, or only disadvantages | No balance | At least one substantial counter-argument |
Examples without numbers, places or dates | Examples “lack explanation” | Two precise facts per example |
A conclusion that summarises, or sits on the fence | Judgement “vague or unsupported” | Answer the question on a scale, say what it depends on |
Ignoring perspectives and stakeholders | Narrow analysis | Who gains, who pays; ecocentric, technocentric and anthropocentric views |
Drifting from the question | Knowledge not linked to the question | Return to the wording of the question in each paragraph |
Checklist for every essay
The question was chosen for its part (c), with examples ready.
Part (a) and part (b) are written as distinct points, with more points than marks and no introduction.
Any diagram has every box and arrow labelled and is referred to in the text.
Part (c) has a plan with a line of argument, two or three named examples and a one-sentence conclusion.
Each paragraph of part (c) follows point, evidence, explanation, evaluation.
Perspectives and stakeholders appear as part of the evaluation, not as a separate list.
The conclusion answers the question in its own words, on a scale, with a reason and a limit.
For HL, at least one lens (law, economics or ethics) supports the judgement.
Carry on with ESS in Augment
With a free account, Augment remembers where you stopped in the notes and which questions you have marked.