Augment Education
    • Question bank
    • Quick fire
    • Worksheets
    • Flashcards
    • Notes
    • Try a quick-fire round
    • All features
    • Business
    • Digital Society
    • Economics
    • Geography
    • Global Politics
    • History
    • Philosophy
    • Psychology
    • Anthropology
    • World Religions
    • Biology
    • Chemistry
    • Physics
    • Computer Science
    • Design Technology
    • ESS
    • SEHS
    • Language and literature
    • Language acquisition
    • Maths AA
    • Maths AI
    • Dance
    • Film
    • Music
    • Theatre
    • Visual Arts
    • Grade calculator
    • Grade boundaries
    • Subject checker
    • Focus timer
    • Exam countdown
    • All free tools
    • IB guide
    • All subjects
  • Blog

Search

Search subjects, the syllabus, glossary terms, the booklets, the IB guide, help and the blog

Log inStart free
augment

Augment Education

IB Diploma revision built around the syllabus.

contact@augment-education.com

Product

  • Features
  • Question bank
  • Quick fire
  • Worksheets
  • Flashcards
  • Notes
  • Subjects
  • What's new

Learn

  • IB guide
  • Booklets, explained
  • Glossary
  • Blog
  • Free tools
  • Grade calculator
  • Subject checker

Company

  • About
  • Help
  • For parents
  • For teachers
  • Comparisons

Subjects

  • English A Lit
  • English A Lang & Lit
  • Chinese A Lit
  • Chinese A Lang & Lit
  • Spanish A Lit
  • Spanish A Lang & Lit
  • English Lit & Perf
  • Spanish Lit & Perf
  • English B
  • Mandarin B
  • Spanish B
  • English ab initio
  • Mandarin ab initio
  • Spanish ab initio
  • Business
  • Digital Society
  • Economics
  • Geography
  • Global Politics
  • History
  • Philosophy
  • Psychology
  • Anthropology
  • World Religions
  • Biology
  • Chemistry
  • Physics
  • Computer Science
  • Design Technology
  • ESS
  • SEHS
  • Maths AA
  • Maths AI
  • Dance
  • Film
  • Music
  • Theatre
  • Visual Arts

Augment Education is developed independently of the International Baccalaureate Organization and is not endorsed by it. “IB” and “International Baccalaureate” are its trademarks.

© 2026 Augment Education. All rights reserved.

  • Privacy
  • Terms
  1. Subjects
  2. ESS
  3. Paper 2 Section A: short-answer and data-based questions

Paper 2 Section A: short-answer and data-based questions

Earn every mark in Paper 2 Section A: read command terms and marks, write distinct marking points, describe and calculate from data, construct systems diagrams and use named examples precisely.

  • IB Environmental Systems and Societies
  • Exam skills
  • SL and HL

21 min readLast reviewed 15 Oct 2026

Section A of Paper 2 is a set of compulsory short-answer and data-based questions worth 40 marks. It has the same format and the same 40 marks at SL and HL, and it can draw on any topic of the course, from the foundation ideas of perspectives, systems and sustainability to urban air pollution. Questions are usually built around a short stimulus, such as a graph, a table, a photograph, a diagram or a few lines of text, and then split into parts worth 1 to 4 marks, with an occasional longer part.

Because every question is compulsory, Section A rewards breadth. There is no choice to hide a weak topic, and each mark is earned by a short, precise statement rather than by a long argument. The skills are learnable: reading the command term, counting the marks, writing one clear point per mark, handling data with values and units, and drawing clean diagrams.

How Section A is marked

Section A is marked with a question-specific markscheme. For each part, the markscheme lists the acceptable marking points, each worth one mark, often with more points than there are marks available. An examiner awards a mark for each valid, distinct point up to the maximum, and nothing for points that repeat, contradict or only restate the question.

Three consequences follow from point marking. First, the number of marks tells you how many separate points are needed. Second, length earns nothing on its own: a 4-mark answer with four precise sentences scores more than a page of general discussion. Third, a point must be specific enough to be recognisable as one of the markscheme points, so vague words such as “affects”, “harms” or “impacts the environment” rarely earn credit.

Command term

What earns a mark

Typical marks

State, identify, list

Each correct name, value or item (no explanation needed)

1–2

Define

A precise meaning using course terminology; sometimes a second mark for a qualifying detail

1–2

Outline

Each brief, distinct point, often a factor, method or impact

2–4

Describe

Each detailed feature, with data or sequence where relevant

2–4

Distinguish

Each clear difference, stated for both items

2

Explain

Each step in a chain of cause and effect, or each reason with its link

2–4

Calculate

Correct working and a correct answer with its unit

1–2

Suggest

Each plausible reason or solution applied to the stimulus

1–3

Annotate, draw, construct

Each correctly labelled component, arrow or note on the diagram

2–4

Evaluate (short)

Each strength and limitation, plus a brief judgement

3–4

Each command term has a fixed meaning. What matters most in Section A is how the command term combines with the number of marks: “Outline two…” for 2 marks wants two brief points, while “Explain two…” for 4 marks wants two points, each followed by its reason.

Exam tip

Read every question in this order: the command term, the number of marks, then the subject. Underline all three. The command term sets the depth, the marks set the number of points, and the subject sets what the points must be about.

What a mark looks like

The clearest way to see point marking is to compare three answers to the same question. All three students know the topic; only one writes in marking points.

Worked example

Outline two reasons why the population of a species may fall below the carrying capacity of its habitat. [2]

Show three answers and their marks

Answer A (0/2): “Because of the environment and humans. The population can change a lot.”

Comment: no specific reason is given. “The environment” and “humans” name the areas where reasons might lie, but neither is a reason.

Answer B (1/2): “Disease can kill many individuals. Also, predators eat them and there could be disease.”

Comment: disease earns a mark. Predation could earn the second mark, but it is weakened by repeating disease, and a marker reading “predators eat them” may want more precision. One clear mark.

Answer C (2/2): “An outbreak of disease can raise the death rate above the birth rate, so numbers fall [1]. A new predator, such as an introduced species, can increase mortality faster than the prey population can reproduce [1].”

Comment: two distinct reasons, each linked to birth or death rates. It uses the language of carrying capacity correctly and needs no more length than Answer B.

Answer C also shows a useful habit: each point ends with the mark it is aiming for, at least in your head. When you can see where each mark will come from, you know the answer is complete.

Common mistake

Giving opposites as two points. “Deforestation reduces biodiversity” and “reforestation increases biodiversity” are one idea seen from two sides, so a markscheme usually credits it only once. Two points must be about two different processes or factors.

A method for every short-answer question

A short routine, used every time, keeps answers focused and stops marks leaking away through misreading. It takes a few seconds per question once it is habitual.

  1. Read the stem and the stimulus first. Note the place, the organism, the dates, the units and anything labelled “hypothetical”. Most data questions use only what is in front of you.

  2. Underline the command term, the marks and the subject. “Explain how … [3]” needs three linked steps about exactly what follows “how”.

  3. Count the marks and plan that many points. For 3 or more marks, plan one extra point in case one is not credited.

  4. Write one point per sentence. Start with the point, then add the reason or the evidence. Avoid restating the question as an opening line.

  5. Use course terms. Write “positive feedback”, “eutrophication”, “biochemical oxygen demand”, “transfer”, “transformation” where they fit: precise terms are often the marking points themselves.

  6. Check numbers, units and the question. Is every value quoted with its unit? Has the answer given the number of items asked for, no more?

Tip

If a question asks for two reasons and you can think of four, write the two strongest first. A marker may credit only the number of answers asked for, starting with the first, so it is safest not to rely on a strong third reason rescuing a weak first one.

Question types and how to answer them

Section A questions fall into a small number of types. Each has a recognisable shape, and each has a typical way of losing marks.

Define and state

Definitions earn 1 or 2 marks and are where precise wording matters most. A definition should place the term in its category (“a storage of…”, “the process by which…”, “the maximum number of…”) and include the qualifier that makes it exact.

Worked example

Define the term “carrying capacity”. [1]

Show the answers

Weak (0): “How many animals can live somewhere.”

Strong (1): “The maximum number of individuals of a species that an environment can sustainably support, set by competition for limited resources.”

Why: the weak answer misses “maximum”, “sustainably” and the link to limiting resources, which together separate carrying capacity from the current population size.

“State” items want a name, value or brief fact with no explanation. Adding explanation does no harm, but it costs time that longer questions need.

Outline and describe

“Outline” asks for brief points; “describe” asks for a more detailed account. In Section A the difference is mostly one of detail per point. A 4-mark “describe” question about a method expects the sequence of steps; a 4-mark “outline” question expects four distinct points.

Worked example

Outline how the capture–mark–release–recapture method is used to estimate the population size of a beetle species. [3]

Show a model answer

Model answer:

  • A sample of beetles is caught using a standardised method, such as pitfall traps, and counted, then marked in a way that does not harm them or make them more visible to predators [1].

  • The marked beetles are released back into the same area and given time to mix randomly with the rest of the population [1].

  • A second sample is caught with the same method; the numbers of marked and unmarked beetles are counted and the Lincoln index (M × N ÷ R) is used to estimate the population [1].

Why it scores: each sentence is one stage of the method, in order, with the reason that keeps the estimate valid. The formula earns credit only because it is placed in context.

Explain

“Explain” questions are where most marks are lost. An explanation is a chain: something happens, which causes something else, which leads to the outcome named in the question. Each link in the chain is usually one mark. Answers that state the outcome without the mechanism, or the mechanism without reaching the outcome, are incomplete.

Worked example

Explain how the melting of Arctic sea ice can act as a positive feedback on global temperature. [3]

Show two answers and their marks

Weak answer (1/3): “Ice melts because of global warming, so there is less ice and it gets hotter, which is positive feedback.”

Comment: the loop is named, but the mechanism is missing. Why would less ice make it hotter? Only the idea that warming causes melting is credited.

Strong answer (3/3): “Sea ice has a high albedo and reflects most incoming solar radiation, while open ocean is dark and absorbs most of it [1]. As warming melts the ice, more dark ocean is exposed, so more solar energy is absorbed and the water and air warm further [1]. This extra warming melts more ice, so the original change is amplified rather than reduced, which is positive feedback [1].”

Why it scores: three links: the albedo contrast, the extra absorption, and the loop back to more melting. The final sentence names the concept and shows why it fits.

Exam tip

Words such as “so”, “because”, “therefore”, “which leads to” and “as a result” are the joints of an explanation. If an “explain” answer has none of them, it is probably a description.

Distinguish

A “distinguish” answer makes the difference clear for both items. Writing about one item and leaving the reader to infer the other usually earns only part of the marks. The safest structure is a pair of contrasting sentences, or a sentence with “whereas”.

Worked example

Distinguish between a primary pollutant and a secondary pollutant. [2]

Show a model answer

Model answer: “A primary pollutant is released directly from a source, such as carbon monoxide from a vehicle exhaust [1], whereas a secondary pollutant forms in the atmosphere when primary pollutants react with each other or with other substances, often in sunlight, such as tropospheric ozone [1].”

Why it scores: both pollutants are defined in the same terms (where they come from), and each has an example. An answer that only said “secondary pollutants are made by reactions” would earn 1.

Suggest

“Suggest” questions give an unfamiliar situation and ask for a reasonable answer. There is rarely one right answer: the markscheme accepts any plausible reason that applies course concepts to the stimulus. The skill is to use the information given rather than to recall a learned list.

Worked example

A city’s natural increase rate has been close to zero for ten years, but its population has continued to grow. Suggest two reasons for this. [2]

Show a model answer
  • More people move into the city than leave it (net in-migration), for example from rural areas in search of work [1].

  • The city boundary may have been extended to include surrounding settlements, adding their population without any births or migration [1].

Why it scores: natural increase is births minus deaths, so growth must come from something outside it. Migration is the obvious answer; a boundary change is a second, distinct and plausible one. “More babies are born” contradicts the stimulus and earns nothing.

Short evaluations

Section A sometimes includes an “evaluate” or “discuss” part worth 3 or 4 marks. These are marked by points, not markbands, but the points must include both strengths and limitations, and usually a brief judgement. A one-sided answer cannot reach full marks, however good it is.

Worked example

Evaluate the use of quadrats to estimate the abundance of plant species in a meadow. [4]

Show a model answer

Model answer:

  • Strength: quadrats are cheap, simple and quick, so many samples can be taken and the mean is more reliable [1].

  • Strength: random placement using a grid and random numbers reduces sampler bias [1].

  • Limitation: estimating percentage cover is subjective, so two people may record different values for the same quadrat [1].

  • Limitation: small or rare species may be missed, and species that flower at other times of year may not be identified [1].

  • Judgement: quadrats give a reasonable estimate of the abundance of common plants if enough random samples are taken, but they underestimate rare species [1].

Why it scores: the answer is balanced, and each point is specific to quadrat sampling rather than to “fieldwork” in general. Any four of the five points reach the maximum.

In Section A, marks come from distinct, specific points matched to the command term. Length, repetition and general statements earn nothing on their own.

Data-based questions

Many Section A questions open with data: a line graph, a table, a bar chart, a map or a short extract. The data are often hypothetical, invented to test a skill rather than knowledge of a particular place. The questions then move from reading the data, to calculating with it, to explaining it, to judging what it can and cannot show.
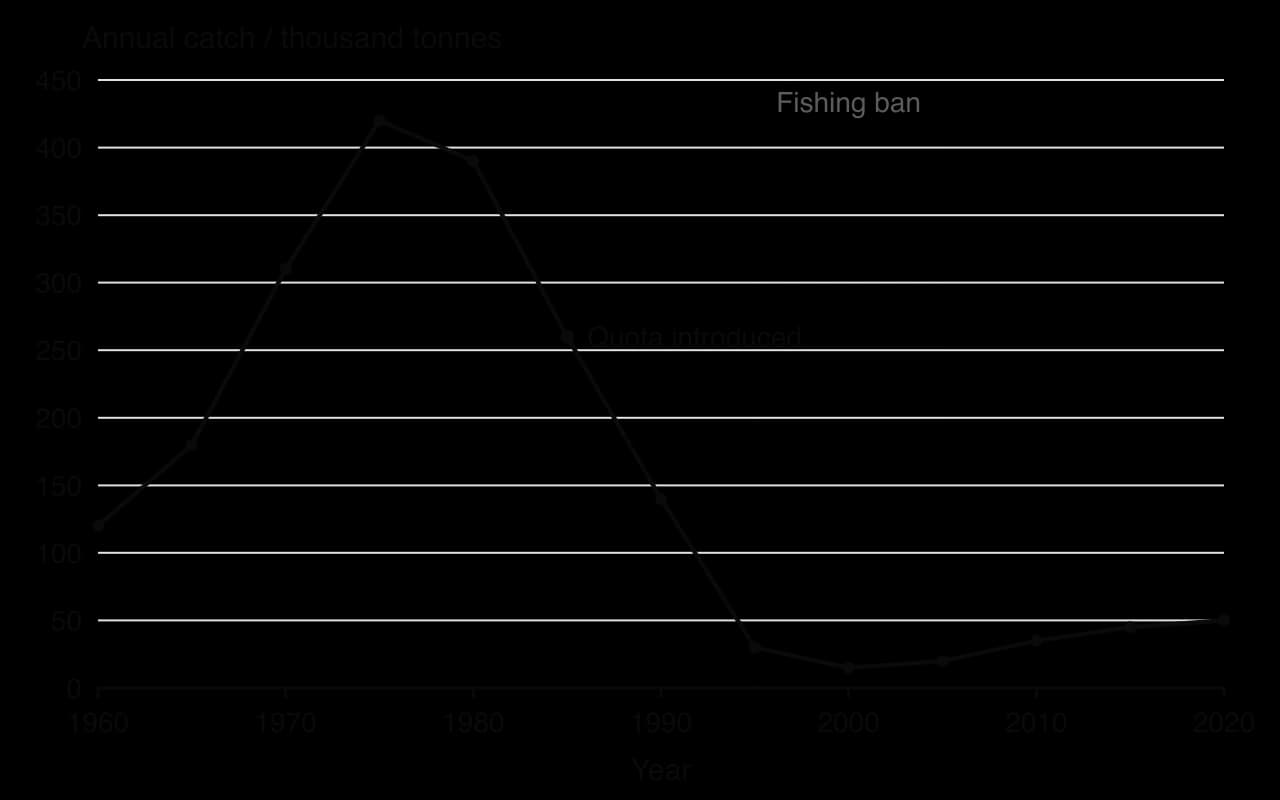
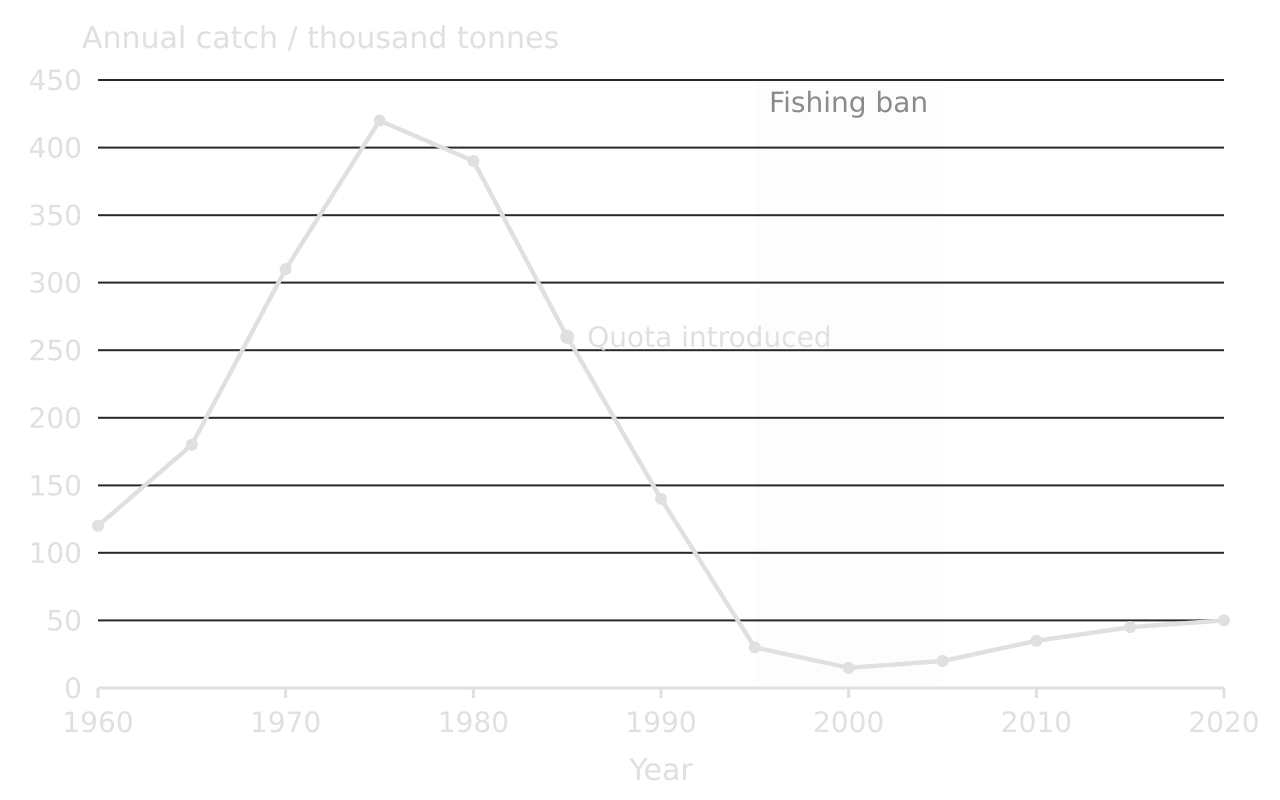
Line graph of hypothetical annual catch of a fish stock, 1960–2020: 120 thousand tonnes in 1960, peak of 420 in 1975, quota introduced 1985 at 260, 30 in 1995, low of 15 in 2000 during a 1995–2005 fishing ban, then slow rise to 50 by 2020.Line graph of hypothetical annual catch of a fish stock, 1960–2020: 120 thousand tonnes in 1960, peak of 420 in 1975, quota introduced 1985 at 260, 30 in 1995, low of 15 in 2000 during a 1995–2005 fishing ban, then slow rise to 50 by 2020.
Hypothetical data for a data-based question. Catches rise to a peak in 1975, fall by more than 90% by 1995 and recover only slowly after a ban on commercial fishing (the small catches during the ban are bycatch and limited local fishing). Each phase is worth describing with years and values.

The graph shows the annual catch of a hypothetical fish stock. It is used in the worked examples that follow, which together cover the most common data skills.

Describing a trend

A description of a graph needs three things: the overall trend, the key values with their years and units, and any change of direction or anomaly. Writing “it goes up and then down” describes the shape but earns little, because it uses no data.

Worked example

Using the graph, describe the changes in the annual catch between 1960 and 2020. [3]

Show two answers and their marks

Weak answer (1/3): “The catch went up a lot and then went down a lot and then went up a little.”

Comment: the general pattern is right, so one mark may be given, but there are no values, no years and no units.

Strong answer (3/3): “The catch rose from 120 thousand tonnes in 1960 to a peak of 420 thousand tonnes in 1975 [1]. It then fell steeply to 30 thousand tonnes by 1995, with the lowest value of 15 thousand tonnes in 2000 [1]. After 2000 it increased slowly to 50 thousand tonnes in 2020, still only about an eighth of the peak [1].”

Why it scores: each phase is described with a start, an end and a unit. Comparing 2020 with the peak adds precision without explanation, which a “describe” question does not ask for.

Tip

Read values off a graph to the precision the scale allows, and write the unit every time. If a value falls between gridlines, “about 260 thousand tonnes” is acceptable; an answer without a unit is often not.

Calculations

Calculations in Section A are usually worth 1 or 2 marks: one for the working and one for the answer with its unit. The most common are percentage change, rates of change, means, the Lincoln index, Simpson’s reciprocal index, efficiency of energy transfer, natural increase and doubling time. Whatever the formula, the habit that earns the marks is setting out the working so that a marker can follow it.

Worked example

Calculate the percentage change in the annual catch between 1975 and 1995. [2]

Show the working

Step 1: write the formula.

percentage change=new value−original valueoriginal value×100percentage change=original valuenew value−original value​×100

Step 2: substitute values from the graph. (30 − 420) ÷ 420 × 100 [1]

Step 3: calculate and round sensibly. = −390 ÷ 420 × 100 = −92.9% (a decrease of about 93%) [1].

Marking note: the minus sign or the word “decrease” is needed. Dividing by the new value (30) instead of the original value is the most common error and gives a meaningless answer of −1,300%.

A second calculation, typical of the population topic, uses rates given per thousand. The rule of 70 gives the doubling time.

Worked example

A country has a crude birth rate of 18 per 1,000 and a crude death rate of 8 per 1,000. Calculate its natural increase rate as a percentage and its doubling time. [2]

Show the working

Step 1: natural increase. 18 − 8 = 10 per 1,000 = 10 ÷ 10 = 1.0% per year [1].

Step 2: doubling time. 70 ÷ 1.0 = 70 years [1].

Marking note: the unit “years” is part of the answer. A doubling time calculated from 10 instead of 1.0 (7 years) shows a percentage error and earns nothing for the second mark.

Common mistake

Mixing up a percentage change and a change in percentage points. If forest cover falls from 40% to 30% of a country’s area, it has fallen by 10 percentage points, which is a percentage change of −25%. Say which one the answer gives.

Explaining and suggesting from data

After describing and calculating, questions usually ask why the data look as they do. The answer must still be anchored in the data: name the phase or value being explained, then give the reason.

Worked example

(a) Suggest two reasons why the catch continued to fall after the quota was introduced in 1985. [2] (b) Suggest why the catch recovered only slowly after the fishing ban ended in 2005. [2]

Show model answers

(a) The quota may have been set above the maximum sustainable yield, so the stock was still being fished faster than it could reproduce [1]. Illegal, unreported fishing or the discarding of bycatch may have removed more fish than the recorded catch shows [1].

(b) By 1995 most large, mature fish had been removed, so few adults were left to spawn [1]. Other species may have taken over the stock’s niche in the food web during the collapse, reducing food or increasing predation on young fish [1].

Why it scores: every reason is tied to a dated part of the graph and uses a fisheries concept. These reasons echo the collapse of the northern cod off Newfoundland, which peaked at 810,000 tonnes in 1968 before the 1992 moratorium, but the question asks only for plausible reasons, not for a named case.

Tables and comparisons

Tables often compare two sites, two years or two groups. “Compare” items need a statement about both, ideally with values, and a comparative word (“higher”, “three times”, “whereas”).

Site (hypothetical data)

Number of plant species

Simpson’s reciprocal index (D)

Mean soil compaction (kg cm⁻²)

A: beside a footpath

6

2.1

4.5

B: 20 m from the footpath

14

6.8

1.2

Worked example

(a) Using the data, compare the plant diversity of the two sites. [2] (b) Suggest a reason for the difference. [2] (c) State one reason why the data may not be reliable. [1]

Show model answers

(a) Site B has more than twice as many species as site A (14 compared with 6) [1], and its Simpson’s reciprocal index is more than three times higher (6.8 compared with 2.1), showing greater species richness and evenness [1].

(b) Trampling beside the footpath compacts the soil (4.5 compared with 1.2 kg cm⁻²) and damages plants [1], so only a few trampling-tolerant species survive and dominate, lowering both richness and evenness [1].

(c) Only one site of each type was sampled, so the difference could be due to other factors such as shade or soil moisture [1].

Correlation is not causation

Some questions ask whether data prove a cause. Two variables can change together because one causes the other, because both are caused by a third factor, or by chance. A strong answer recognises the relationship, then names the alternative explanation and what extra evidence would be needed.

Worked example

A survey of 12 streams found that streams with higher nitrate concentrations had fewer mayfly nymphs. Discuss whether these data show that nitrate causes the decline in mayfly nymphs. [3]

Show a model answer

The data show a negative correlation between nitrate and mayfly numbers [1]. However, nitrate often comes from farmland that also releases organic matter such as manure, which raises the BOD and lowers dissolved oxygen, and mayfly nymphs are sensitive to low oxygen, so oxygen rather than nitrate may be the cause [1]. To show causation, dissolved oxygen and other variables would need to be measured as well, or nitrate tested on its own under controlled conditions [1].

Diagrams in Section A

Diagram questions use the command terms draw, label, annotate and construct. Each correct component earns a mark, so a diagram must be clear enough for a marker to find every one. In ESS the most common is the systems diagram: storages in boxes and flows as arrows labelled with the process, with inputs and outputs crossing the system boundary.

Worked example

Construct a systems diagram of a reservoir showing its storage, two inputs and two outputs. Label each flow as a transfer or a transformation. [4]

Show the marking points and a model diagram

Marking points: the storage drawn as a box and named [1]; two correct inputs as arrows into the box, such as river inflow and precipitation [1]; two correct outputs as arrows out, such as evaporation and abstraction for water supply [1]; flows correctly identified, for example evaporation as a transformation (a change of state) and inflow as a transfer (a change of location) [1].

Systems diagram of a reservoir: one storage, water in the reservoir, inside a dashed system boundary. Inputs: river inflow and precipitation (transfers). Outputs: evaporation (transformation), abstraction for supply, seepage to groundwater and outflow downstream (transfers).Systems diagram of a reservoir: one storage, water in the reservoir, inside a dashed system boundary. Inputs: river inflow and precipitation (transfers). Outputs: evaporation (transformation), abstraction for supply, seepage to groundwater and outflow downstream (transfers).
A model answer. One clearly named storage, arrows pointing the right way, every flow labelled with its process and type, and a dashed system boundary. Extra outputs do no harm.

Common errors: arrows without labels, labelling the arrow with a storage (“groundwater”) instead of a process (“seepage”), and calling evaporation a transfer.

Exam tip

“Label” means adding names to parts; “annotate” means adding brief notes that explain or describe. An annotation on a food web, for example, says what an arrow represents (“energy and biomass passed by feeding; about 90% lost as heat in respiration”), not only its name.

Using named examples in short answers

Some Section A parts say “with reference to a named example” or “for a named ecosystem”. These marks are only available if the example is named precisely and if a detail from it is used to support the point. One accurate, specific fact is worth more than a paragraph of general narrative.

Worked example

With reference to a named example, outline how overfishing can lead to the collapse of a fishery. [3]

Show two answers and their marks

Weak answer (1/3): “Overfishing means people catch too many fish so the fish die out, like cod in the Atlantic.”

Comment: the general idea is there, but the example is vague and no mechanism is outlined.

Strong answer (3/3): “Off Newfoundland, factory trawlers with sonar caught northern cod far faster than before, and the catch peaked at 810,000 tonnes in 1968 [1]. Quotas stayed high in the 1980s, and trawlers removed most of the large, old spawning fish, so too few young fish joined the stock to replace those caught [1]. By 1992 the stock had fallen to about 1% of its historic level and the fishery was closed by a moratorium [1].”

Why it scores: the example is named with a place, a species, a date and a number, and each sentence adds a stage of the process.

Tip

For each subtopic, keep one example ready in three lines: name and place, one or two numbers with dates, and the concept it shows. These short examples cover nearly every “named example” part in Section A.

Common ways to lose marks

What happens

Why it costs marks

What to do instead

Vague verbs: “affects”, “impacts”, “harms the environment”

No specific process is named, so no marking point matches

Say what changes and how: “reduces dissolved oxygen”, “raises the death rate”

Restating the question

Earns nothing and uses time

Start with the first point

Opposites or repeats as separate points

Counted as one idea

Choose points about different processes or factors

Values without units, or a misread scale

The value is incomplete or wrong

Quote values with units and check the axis

Description when the question says “explain”

Mechanism missing

Add “because…”, “which leads to…”

More answers than asked for

Extra answers may not be marked, and contradictions can cancel a mark

Give the number asked for, strongest first

One-sided “evaluate”

Cannot reach full marks, however good

Include a strength, a limitation and a judgement

Diagram arrows without labels

Components cannot be credited

Label every box and arrow with what it is

Common mistake

Ignoring “hypothetical data” or the scale of the stimulus. If the data are about one lake over four years, an answer that claims “eutrophication is increasing worldwide” goes beyond the evidence. Keep claims to the scale and period of the data.

A complete practice question

Section A questions are usually built as a sequence of parts on one stimulus. The question that follows is in that style, with a full model answer and the marks each part would earn.

Month (hypothetical city)

Mean PM2.5 (µg m⁻³)

Days with a temperature inversion

Mean air temperature (°C)

January

92

14

−4

April

48

6

12

July

21

1

24

October

63

9

10

Worked example

(a) Identify the month with the highest mean PM2.5 concentration. [1] (b) Calculate how much higher, as a percentage, the January mean is than the July mean. [2] (c) Explain how a temperature inversion can increase the concentration of PM2.5 near the ground. [3] (d) Suggest one reason, other than inversions, why PM2.5 concentrations are higher in winter. [1] (e) Outline two strategies the city could use to reduce PM2.5, each at a different level of the pollution management model. [4]

Show the model answer and marks

(a) January [1].

(b) (92 − 21) ÷ 21 × 100 [1] = 338% higher [1].

(c) Normally air near the ground is warmer than the air above, so it rises and carries pollutants upwards and away [1]. In an inversion, a layer of warm air lies above cooler air near the ground, so the cool air cannot rise [1]. Pollutants such as PM2.5 from vehicles and heating are trapped in the shallow layer near the ground and their concentration builds up [1].

(d) More fuel, such as coal or wood, is burned for heating in cold months, releasing more particulates [1].

(e) Altering the human activity that produces the pollutant: for example, subsidising the switch from coal heating to electric heat pumps, so less fuel is burned [1–2]. Controlling the release of the pollutant: for example, requiring particulate filters on diesel vehicles or a low-emission zone in the city centre [1–2]. Two marks for each strategy that is outlined and placed at the correct level.

Total: 11 marks. The parts climb from reading data, through calculation and explanation, to applying a management model, which is the usual shape of a Section A question.

Add to your notes: a one-page Section A checklist: the command terms with the number of points each mark needs, the six steps of the method, the common calculations with their formulas and units, and one three-line named example for each subtopic.

Before moving to the next question

  • The answer matches the command term: points for “outline”, mechanisms for “explain”, both sides for “distinguish” and “evaluate”.

  • There are at least as many distinct points as marks, with no repeats or opposites.

  • Every value from the stimulus has its unit and year; every calculation shows its working.

  • Course terms are used exactly (transfer, transformation, positive feedback, carrying capacity, BOD).

  • Diagrams have every box and arrow labelled.

  • Named examples have a place, a date or a number, and a link to the point.

Keep your place

In Augment the notes remember where you stopped and which pages you have finished.

Open in Augment

More IB ESS notes

  • Paper 1: the unseen case studyThe page before this.
  • Paper 2 Section B: structured essaysThe next page.
  • ESS assessmentEach ESS paper, the internal assessment and grade boundaries.
  • IB ESSThe ESS syllabus, how it is assessed and every notes page.

Carry on with ESS in Augment

With a free account, Augment remembers where you stopped in the notes and which questions you have marked.

Start free