Augment Education
    • Question bank
    • Quick fire
    • Worksheets
    • Flashcards
    • Notes
    • Try a quick-fire round
    • All features
    • Business
    • Digital Society
    • Economics
    • Geography
    • Global Politics
    • History
    • Philosophy
    • Psychology
    • Anthropology
    • World Religions
    • Biology
    • Chemistry
    • Physics
    • Computer Science
    • Design Technology
    • ESS
    • SEHS
    • Language and literature
    • Language acquisition
    • Maths AA
    • Maths AI
    • Dance
    • Film
    • Music
    • Theatre
    • Visual Arts
    • Grade calculator
    • Grade boundaries
    • Subject checker
    • Focus timer
    • Exam countdown
    • All free tools
    • IB guide
    • All subjects
  • Blog

Search

Search subjects, the syllabus, glossary terms, the booklets, the IB guide, help and the blog

Log inStart free
augment

Augment Education

IB Diploma revision built around the syllabus.

contact@augment-education.com

Product

  • Features
  • Question bank
  • Quick fire
  • Worksheets
  • Flashcards
  • Notes
  • Subjects
  • What's new

Learn

  • IB guide
  • Booklets, explained
  • Glossary
  • Blog
  • Free tools
  • Grade calculator
  • Subject checker

Company

  • About
  • Help
  • For parents
  • For teachers
  • Comparisons

Subjects

  • English A Lit
  • English A Lang & Lit
  • Chinese A Lit
  • Chinese A Lang & Lit
  • Spanish A Lit
  • Spanish A Lang & Lit
  • English Lit & Perf
  • Spanish Lit & Perf
  • English B
  • Mandarin B
  • Spanish B
  • English ab initio
  • Mandarin ab initio
  • Spanish ab initio
  • Business
  • Digital Society
  • Economics
  • Geography
  • Global Politics
  • History
  • Philosophy
  • Psychology
  • Anthropology
  • World Religions
  • Biology
  • Chemistry
  • Physics
  • Computer Science
  • Design Technology
  • ESS
  • SEHS
  • Maths AA
  • Maths AI
  • Dance
  • Film
  • Music
  • Theatre
  • Visual Arts

Augment Education is developed independently of the International Baccalaureate Organization and is not endorsed by it. “IB” and “International Baccalaureate” are its trademarks.

© 2026 Augment Education. All rights reserved.

  • Privacy
  • Terms
  1. Subjects
  2. ESS
  3. Paper 1: the unseen case study

Paper 1: the unseen case study

Read a Paper 1 resource booklet efficiently, recognise each question type and what earns its marks, and practise on a complete invented case study with model answers, from data questions to the final evaluation.

  • IB Environmental Systems and Societies
  • Exam skills
  • SL and HL

24 min readLast reviewed 15 Oct 2026

Paper 1 tests whether you can apply ESS knowledge to a place you have never studied. You are given a resource booklet about one unfamiliar location or issue, full of maps, graphs, tables, diagrams, photographs and short texts, and every question is based on it. Nothing in the booklet needs to be memorised in advance. What is tested is your ability to read data accurately, link it to ESS concepts and models, and make supported judgements about the place.

Because the place is unseen, Paper 1 rewards skills more than recall. Students who have practised describing trends, calculating from data, drawing systems diagrams and weighing up management strategies on unfamiliar material usually do well, even if the place is in a part of the world they have never studied.

How Paper 1 works

  • The paper is an unseen case study: one place, ecosystem or issue, presented in a resource booklet with data in many forms.

  • All questions are compulsory. There is no choice, so every part of the course could be drawn on, although each paper focuses on the topics that fit its case.

  • Questions are based on the analysis and evaluation of the data in the booklet. Most ask you to use a specific figure or table, and the markscheme gives marks for quoting from it.

  • The paper is worth 35 marks at SL and 70 marks at HL. The HL paper has the same format at twice the length.

  • It is marked with a question-specific markscheme: each question has its own list of acceptable points. There are no markbands.

  • A calculator is needed for calculations such as percentage change, rates, indices and doubling times.

  • Questions typically build from short items worth 1–2 marks (identify, state, calculate, describe) to longer ones worth 3–4 marks (explain, suggest, distinguish) and end with one or more extended questions that ask you to evaluate, discuss or justify a strategy for the place.

Definition

Resource booklet: a collection of maps, graphs, tables, photographs, diagrams and short texts about one previously unseen place or issue, on which every question of an unseen case study paper is based.

The paper tests three assessment objectives. AO1 questions check that you know the concepts and terms; AO2 questions ask you to apply them to the data; AO3 questions ask you to explain, evaluate and justify. Because almost every question asks you to work with the resources, most of the paper tests application, analysis and evaluation rather than recall.

Definition

Case study: a detailed, real example of a place, event, ecosystem or policy, studied in depth to show how general ideas apply and used as specific evidence in extended answers.

The video is an ESS teacher’s overview of how to approach the resource booklet and the question types in the current Paper 1.

YouTube
IB ESSentials with Mr Kremer: strategies for the Paper 1 resource booklet. Watch for the advice on annotating the booklet and on using data in every answer.

What a resource booklet contains

A booklet presents one place through several types of resource. Each type needs a slightly different way of reading. The table lists the common ones and what to look for in each.

Resource

What to look for

Typical questions

Map (location, land use, sketch map)

Scale, north arrow, key; where things are in relation to each other (upstream, downwind, nearby).

Identify a feature; measure a distance; suggest why a site is polluted.

Line graph

Axes and units, overall trend, highest and lowest values, changes in rate, anomalies, when two lines cross.

Describe the trend; calculate percentage change; suggest reasons.

Bar or column chart

Which categories changed most, absolute and relative change, whether the bars are percentages or totals.

Compare two years or places; identify the largest change.

Table of data

Units in the headings, the time or place of each row, patterns down columns and across rows.

Calculate a mean, rate or index; compare sites.

Systems or flow diagram

Storages, flows, inputs, outputs, feedback loops, the system boundary.

Complete or construct a diagram; identify a positive feedback loop.

Photograph or satellite image

Evidence of processes: erosion, algal blooms, land use, settlement, vegetation.

Identify evidence of an impact; describe the land use.

Fact file or text extract

Dates, numbers, policies, laws, stakeholders and the problem as each sees it.

Outline a strategy; distinguish perspectives; evaluate.

Stakeholder statements

Whose view it is, what they value, what they want, which environmental value system it reflects.

Distinguish perspectives; discuss conflicts.

Exam tip

Read the title, axes, units and key of every figure before reading the data. Many lost marks come from misreading units, for example writing “7.2 tonnes” when the axis says “thousand tonnes”, or treating percentages as totals.

How to read the booklet

There is no single right way to work through a booklet, but students who read actively, with a pencil, find the answers faster and miss less. A routine that works for most students is set out in the steps.

  1. Skim the questions first. Knowing what you will be asked tells you what to look for in the resources.

  2. Read the introduction and fact file closely. Note the place, its system (lake, forest, city, coast), the main problem, the stakeholders and any strategies proposed.

  3. Annotate each figure. Write the overall trend beside every graph, circle the highest and lowest values, and mark anomalies. Note any link to another resource (“land clearing in Figure 3 → turbidity in Table 1?”).

  4. Label the ESS concepts you can see. Write the concept beside the evidence: “eutrophication”, “invasive species”, “tragedy of the commons”, “positive feedback”, “ecocentric”.

  5. Answer in order, but keep the final evaluation question in mind. Evidence you find for short questions is often the evidence the last question needs.

Tip

A booklet usually contains links that are not stated: a change in one figure explains a change in another. Drawing arrows between figures while reading (land use → water quality → fish catch) often sets up the whole of the final extended answer.

Question types and how to answer them

The same handful of question types appears on almost every Paper 1. Each has a recognisable shape and a way of earning full marks.

Question type

What earns the marks

Pitfall

Identify / state from a figure

The exact item or value, with units.

Giving a value from the wrong line, year or column.

Calculate (percentage change, rate, mean, index, doubling time)

Working shown, correct answer, units and sensible rounding.

No working, no units, or the wrong original value in a percentage change.

Describe a trend or pattern

Overall trend, quoted values with units and dates, changes in rate, anomalies.

Explaining instead of describing; no figures quoted.

Explain a pattern

A chain of reasons using named ESS processes, linked to evidence in the booklet.

General answers that could apply to any place.

Construct / complete a diagram

Correct storages and labelled flows, arrows in the right direction.

Unlabelled arrows; processes written in boxes.

Suggest reasons or strategies

Plausible, specific ideas tied to evidence in the resources.

Ideas that ignore the place (e.g. suggesting a dam where there is no river).

Distinguish / compare perspectives

Paired contrasts showing what each stakeholder values, ideally naming the value system.

Describing each stakeholder separately without contrast.

Evaluate / discuss / justify a strategy

Strengths and limitations, evidence from several resources, more than one perspective, a clear judgement.

A one-sided list; no data; no conclusion.

In Paper 1, an answer that does not use the resources rarely reaches full marks, even if the ESS content is correct. Quote values, name figures (“Table 1 shows…”) and refer to places on the map. The booklet is the evidence.

Common mistake

Writing about a famous case study instead of the place in the booklet. A paragraph about the Aral Sea or the Great Barrier Reef earns little or nothing on a question about the place in the resources, unless the question asks for a comparison. Use your knowledge of concepts, and the booklet for the evidence.

A worked mini case study: Lake Melora

Lake Melora is an invented place, and every number, statement and figure in this resource booklet is invented for practice. The booklet is shorter than a real one, but its questions follow the same pattern and add up to 35 marks, the length of an SL paper.

The booklet describes a tropical highland lake whose fishery, water quality and surrounding land have changed quickly since 2000. Read all the resources first, annotating as you go, then attempt each question before opening the model answer.

Resource 1: fact file

  • Lake Melora is a freshwater lake at 1,600 m above sea level in a tropical highland region. Area 620 km²; mean depth 9 m. The Kaso River is its main inflow; the Ashani stream drains a forest reserve on the eastern hills.

  • About 410,000 people live in the catchment (2024). Most farm small plots of maize, beans and coffee. Since 2005, flower farms on the west shore have grown roses in greenhouses for export, using lake water for irrigation.

  • Nile tilapia (Oreochromis niloticus) was introduced to the lake in 1996 to increase fish catches. Native cichlid fish are endemic: they are found nowhere else.

  • Registered fishing canoes: 410 in 2000; 1,150 in 2024. Total fish catch: 9,200 tonnes in 2000; 7,200 tonnes in 2024.

  • Water hyacinth (Pontederia crassipes, formerly Eichhornia crassipes), a floating plant from South America, was first recorded in the lake in 2011. In 2024 it covered 14% of the lake surface.

  • Melora town’s sewage receives primary treatment only. About 60% of households are connected to the sewer.

  • Strategies proposed in the district’s 2025 lake plan: (1) a closed fishing season of three months each year in the breeding bays, with a minimum net mesh size; (2) buffer strips of native trees 20 m wide along the Kaso River; (3) secondary and tertiary sewage treatment for Melora town; (4) biological control of water hyacinth with weevils, plus mechanical harvesting of the mats for compost; (5) payments to Ashani forest communities for protecting the forest.

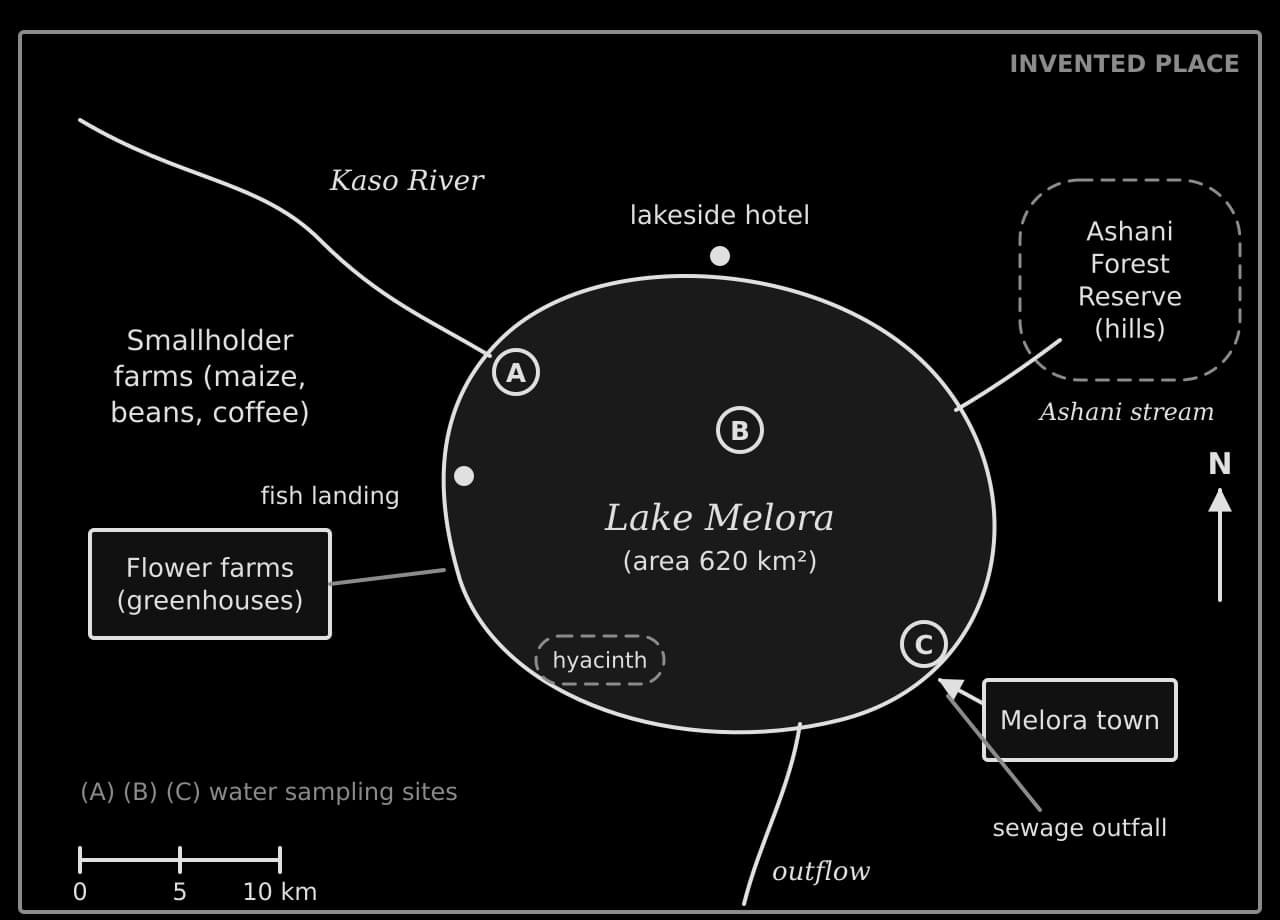
Resource 2: map of the catchment
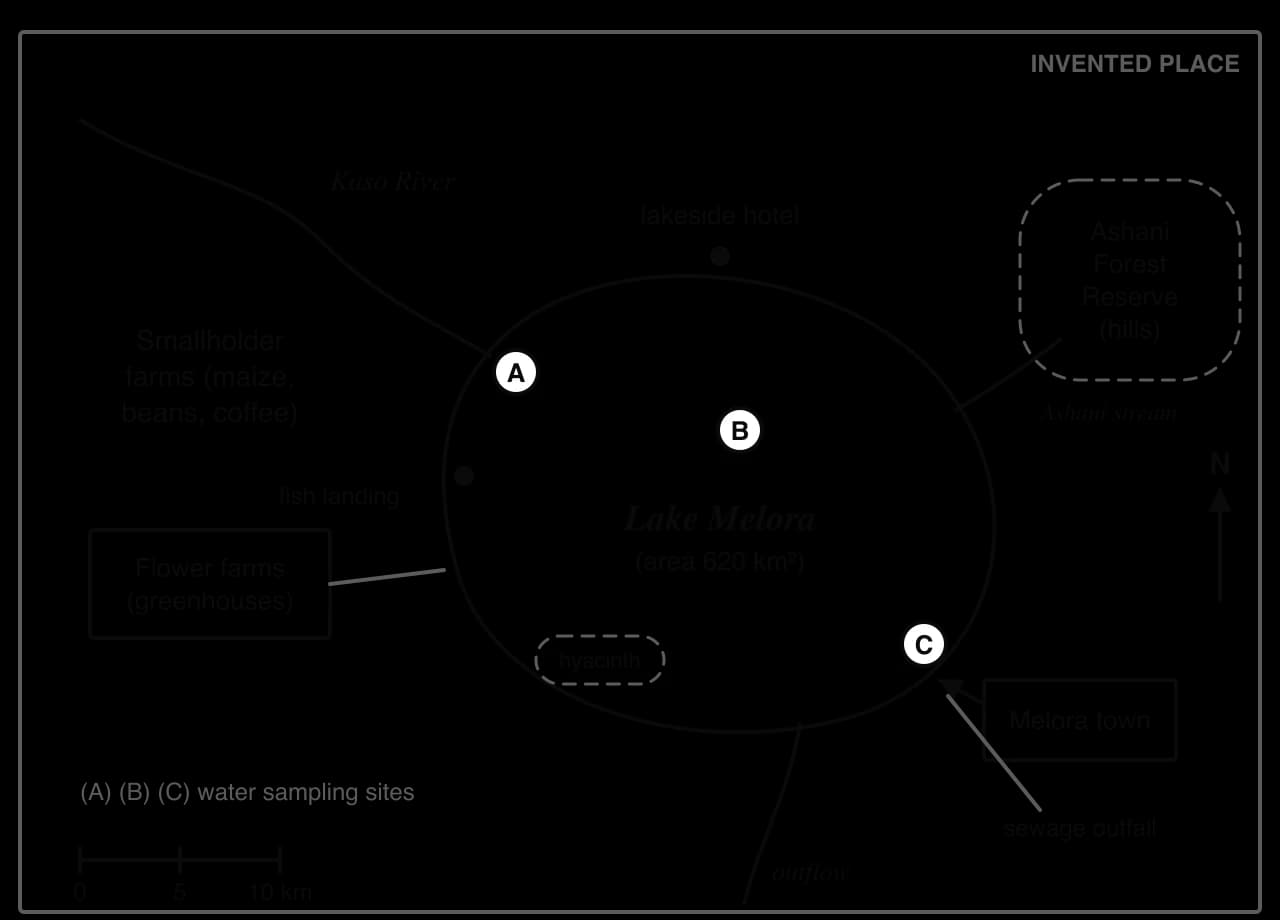
Sketch map of the invented Lake Melora (620 km²). The Kaso River enters in the north-west through smallholder farms; flower farms on the west shore; Ashani Forest Reserve and stream to the east; Melora town and sewage outfall in the south-east; sites A, B, C.Sketch map of the invented Lake Melora (620 km²). The Kaso River enters in the north-west through smallholder farms; flower farms on the west shore; Ashani Forest Reserve and stream to the east; Melora town and sewage outfall in the south-east; sites A, B, C.
Figure 1. Sketch map of Lake Melora and its catchment (invented place). Sites A, B and C are where water samples in Table 1 were taken.

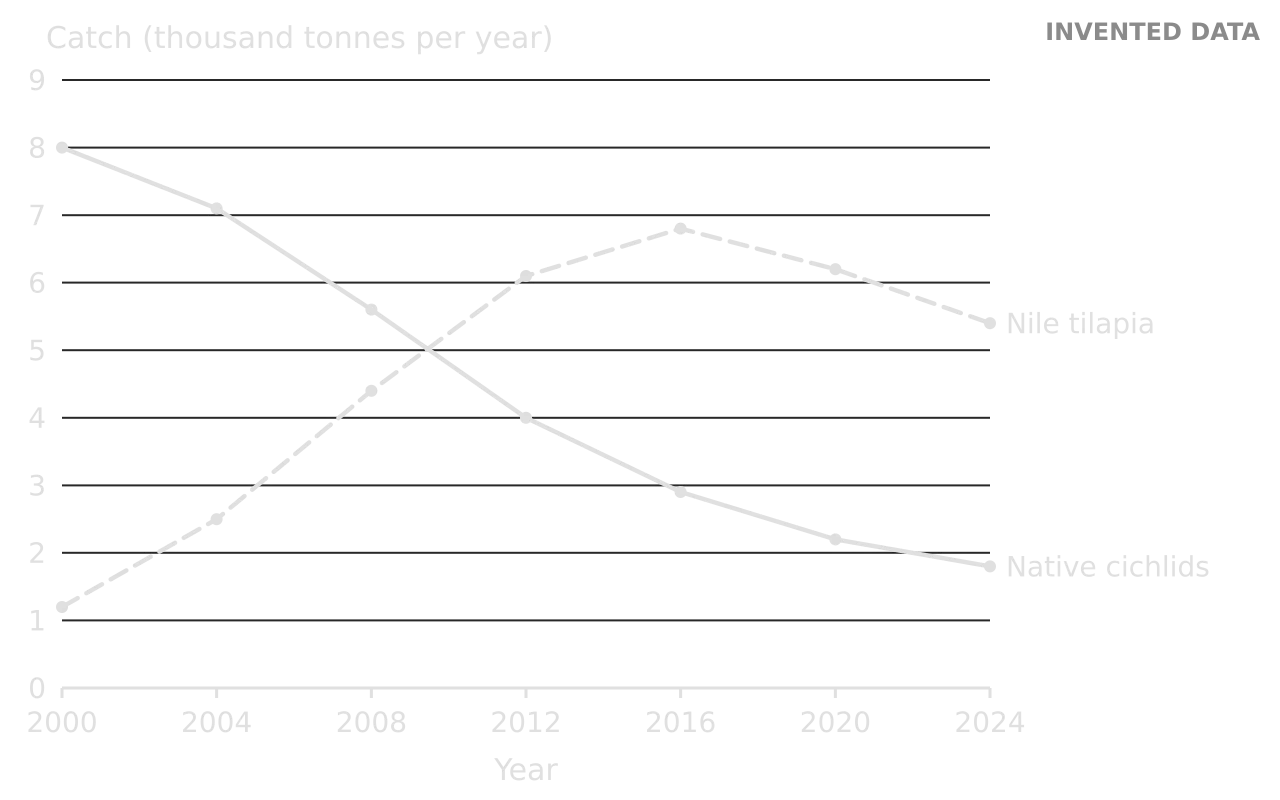
Resource 3: fish catch, 2000–2024

The district fisheries office records the annual catch landed at the lake’s landing sites.
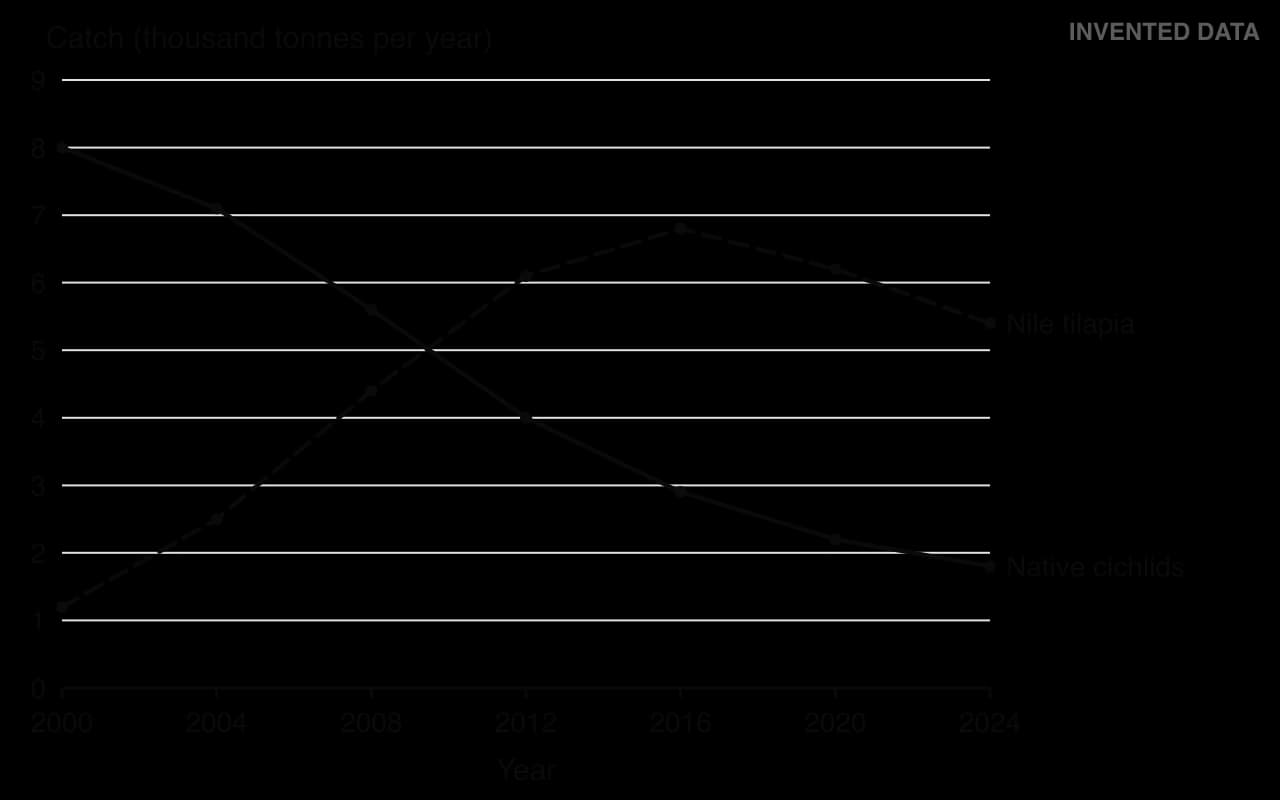
Line graph of invented catches, 2000–2024, thousand tonnes per year. Native cichlids fall steadily from 8.0 to 1.8. Nile tilapia rise from 1.2 to a peak of 6.8 in 2016, then fall to 5.4 in 2024.Line graph of invented catches, 2000–2024, thousand tonnes per year. Native cichlids fall steadily from 8.0 to 1.8. Nile tilapia rise from 1.2 to a peak of 6.8 in 2016, then fall to 5.4 in 2024.
Figure 2. Annual catch of native cichlids and Nile tilapia in Lake Melora, 2000–2024 (invented data).

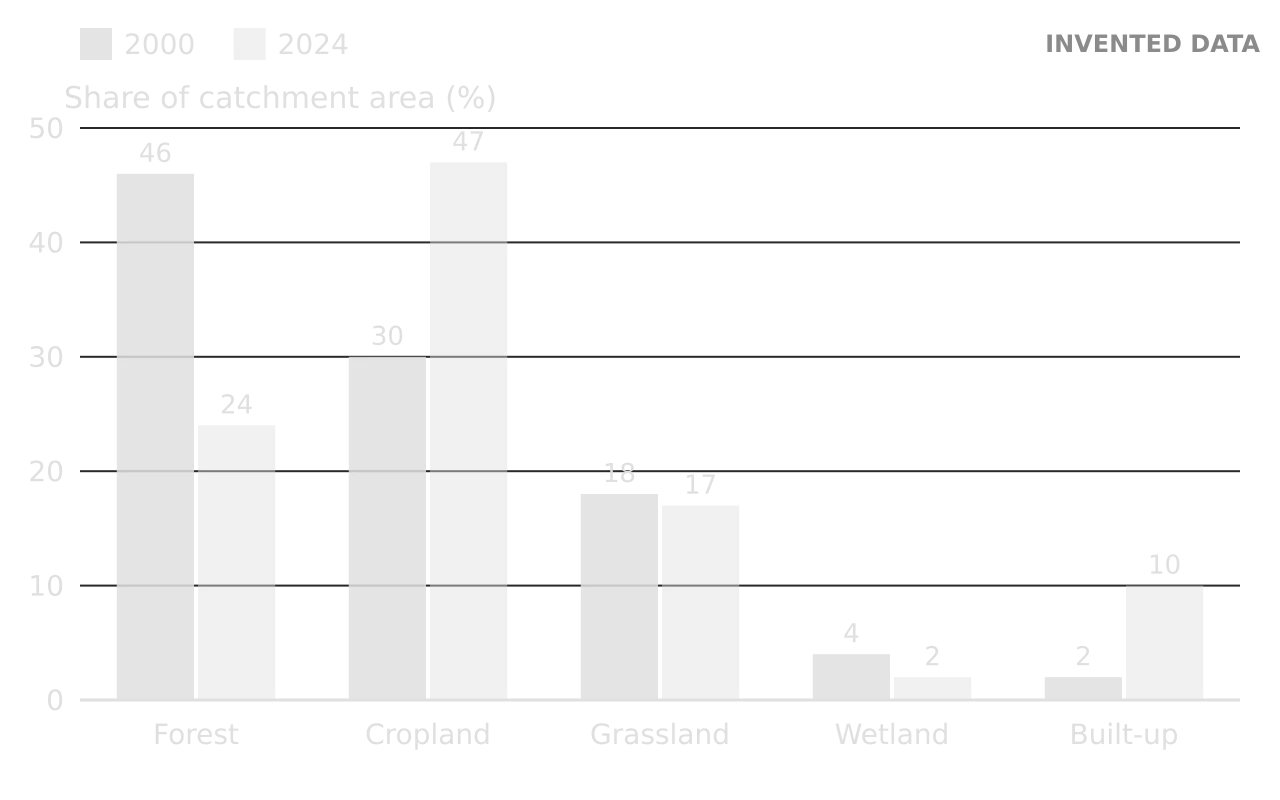
Resource 4: land cover in the catchment

Land cover was mapped from satellite images in 2000 and 2024.
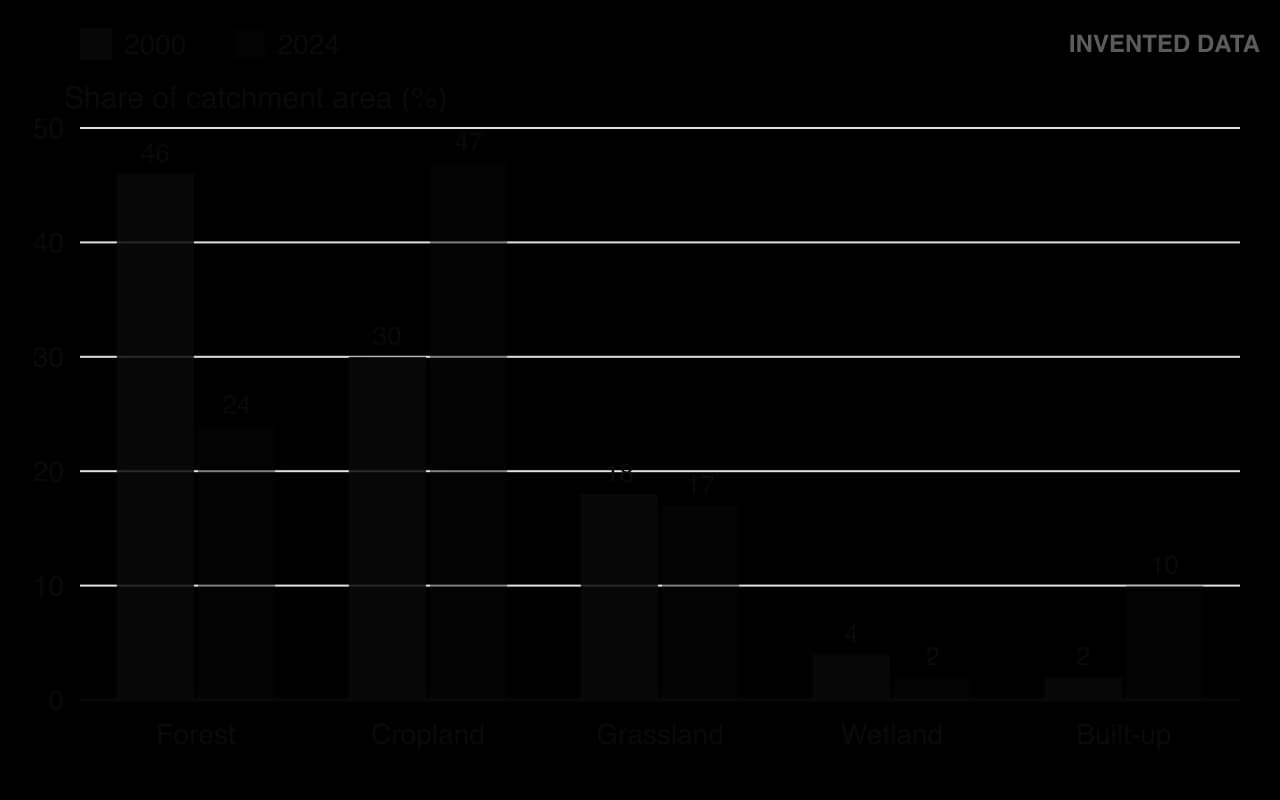
Column chart of invented land cover in the Lake Melora catchment, per cent, 2000 then 2024: forest 46 and 24, cropland 30 and 47, grassland 18 and 17, wetland 4 and 2, built-up 2 and 10.Column chart of invented land cover in the Lake Melora catchment, per cent, 2000 then 2024: forest 46 and 24, cropland 30 and 47, grassland 18 and 17, wetland 4 and 2, built-up 2 and 10.
Figure 3. Land cover of the Lake Melora catchment as a percentage of its area, 2000 and 2024 (invented data).

Resource 5: water quality and population

Table 1. Water quality at the three sites on the map, measured in the dry season of 2024, with the district’s target values (invented data).

Measure

Site A (Kaso River mouth)

Site B (open lake)

Site C (off Melora town)

District target

Nitrate (mg L⁻¹)

4.8

1.1

3.2

below 2.0

Phosphate (mg L⁻¹)

0.42

0.08

0.65

below 0.05

Dissolved oxygen (mg L⁻¹)

5.1

7.6

3.4

above 6.0

BOD (mg L⁻¹)

6.5

2.0

11.2

below 3.0

Secchi disc depth (m)

0.4

2.1

0.6

above 1.5

Table 2. Population of Melora town, from national censuses and a 2024 estimate (invented data).

Year

1990

2000

2010

2024

Population of Melora town

18,000

31,000

52,000

84,000

Resource 6: stakeholder statements

The statements were collected at a public meeting on the 2025 lake plan (invented statements).

Stakeholder

Statement

Chair, Lake Melora Fishers’ Association

“Our native fish are a quarter of what they were. Young men use nets with smaller mesh because there are no big fish left. A closed season will mean three months with no income. We need help, not bans.”

Manager of a flower farm

“The flower farms employ 6,000 people and earn foreign currency for the country. We use lake water and fertiliser, but we are testing drip irrigation that uses less of both.”

District environment officer

“Phosphate near the river mouth and the town is far above what the lake can absorb. Without sewage treatment and buffer strips, the hyacinth will keep spreading.”

Owner of the lakeside hotel

“Visitors come for clear water and birdwatching. Hyacinth mats and the smell near town are driving them away.”

Elder of an Ashani forest community

“Our forest keeps the stream clean. We have cared for it for generations, but outsiders now cut trees for charcoal.”

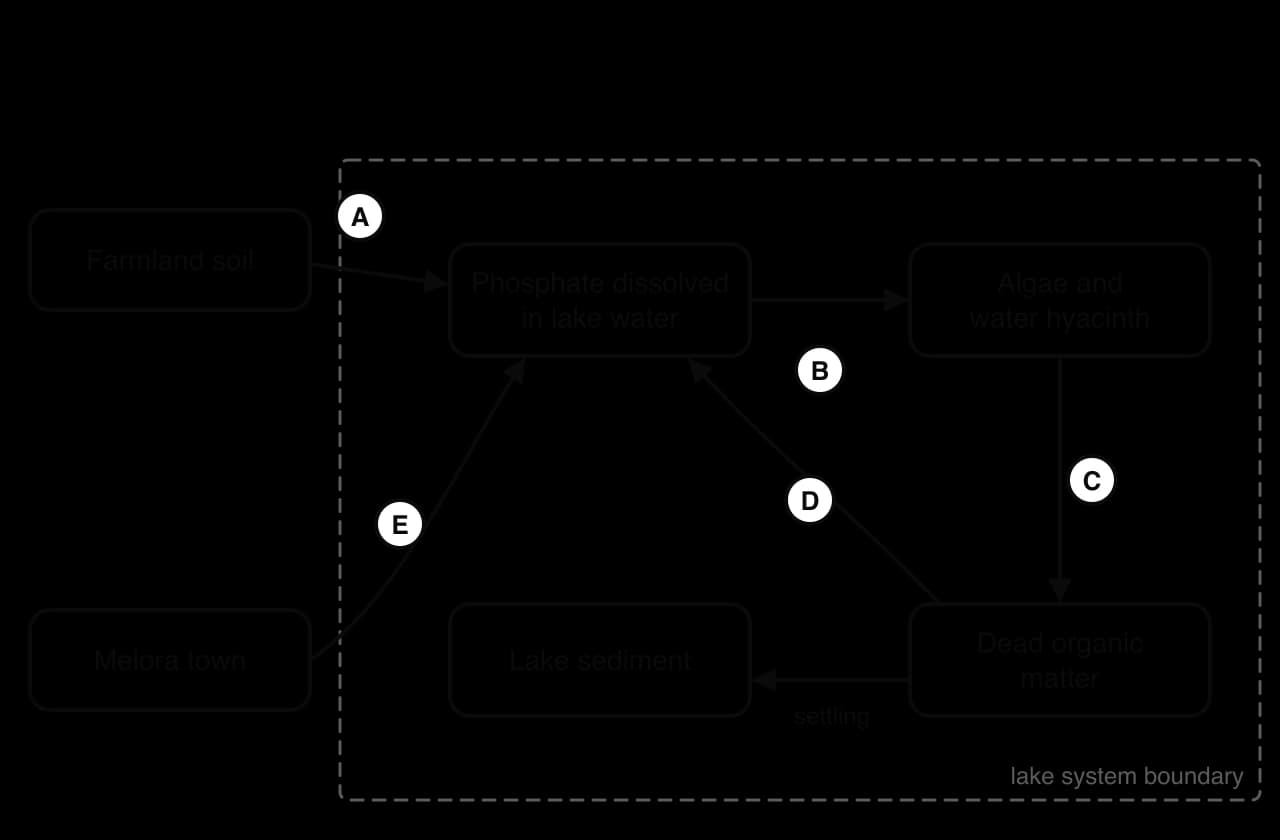
Resource 7: a systems diagram

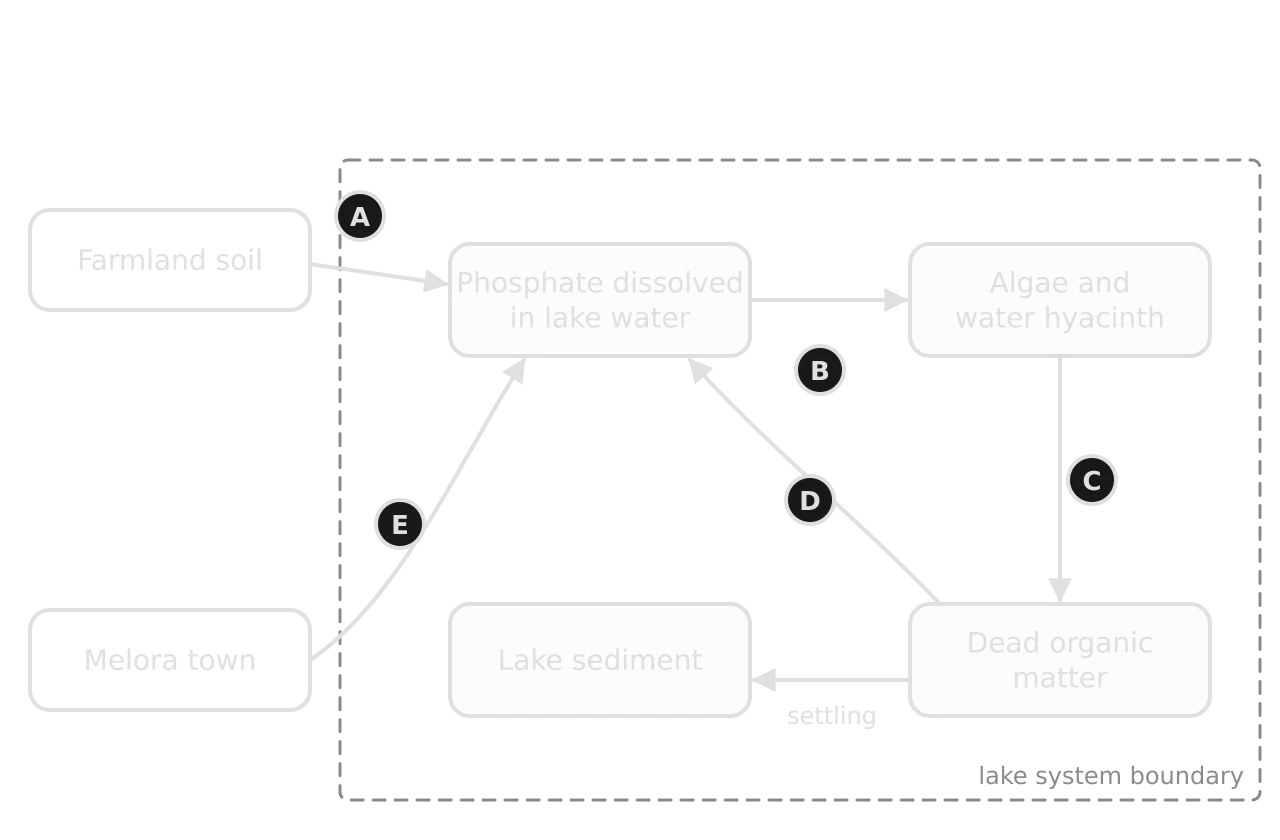
Incomplete systems diagram of phosphorus in Lake Melora. Farmland soil and Melora town outside the lake boundary; inside, dissolved phosphate, algae and water hyacinth, dead organic matter and lake sediment, linked by flows labelled A to E without names.Incomplete systems diagram of phosphorus in Lake Melora. Farmland soil and Melora town outside the lake boundary; inside, dissolved phosphate, algae and water hyacinth, dead organic matter and lake sediment, linked by flows labelled A to E without names.
Figure 4. Incomplete systems diagram of phosphorus in Lake Melora (invented place). The flows are labelled A to E.

Questions and model answers

Each question below is followed by a model answer and the marking points it would earn. Try every question yourself first. Marks are in square brackets.

Question 1: reading the map and graph

Worked example

(a) Using Figure 1, identify the land use on the shore nearest to sampling site C. [1] (b) Calculate the percentage change in the catch of Nile tilapia between 2000 and 2024. [2] (c) Describe the changes in the catch of native cichlids shown in Figure 2. [2]

Show the model answers

(a) Melora town / built-up land (with the sewage outfall) [1].

(b) (5.4 − 1.2) ÷ 1.2 × 100 [1] = +350% (an increase of 350%) [1]. The units cancel because both values are in thousand tonnes.

(c) The native cichlid catch fell throughout, from 8.0 thousand tonnes in 2000 to 1.8 thousand tonnes in 2024 [1]. The fall was steepest between 2004 and 2012 (from 7.1 to 4.0 thousand tonnes) and slowed after 2016 [1].

Examiner’s view: in (c), a description with no values earns at most 1 mark. Giving reasons (“because of tilapia”) earns nothing extra, as the command term is “describe”.

Question 2: fishing effort

Worked example

(a) Using the fact file, calculate the total catch per registered canoe in 2000 and in 2024. [2] (b) Comment on your answer to (a). [2]

Show the model answers

(a) 2000: 9,200 t ÷ 410 canoes = 22.4 t per canoe [1]. 2024: 7,200 t ÷ 1,150 canoes = 6.3 t per canoe [1].

(b) The catch per canoe fell by more than 70% while the number of canoes nearly tripled, so much more effort now produces less fish [1]. This suggests the fishery is being overexploited: the catch is above the sustainable yield and the stocks, especially of native cichlids, are declining [1].

Why it scores: the comment uses the calculated values and draws an ESS conclusion (overexploitation, sustainable yield). A comment that only says “it went down” earns 1 mark at most.

Exam tip

When a question says “Comment on your answer”, the marks are for what the number means in context. Say whether it is high or low, what it shows about the system, and, if relevant, one limitation of the data (for example, that registered canoes may not all fish every day).

Question 3: water quality and land use

Worked example

(a) Compare and contrast the water quality at sites A and C shown in Table 1. [3] (b) Explain how the changes in land cover shown in Figure 3 may have contributed to the water quality at site A. [4]

Show the model answers

(a) Up to 3 marks; at least one similarity and one difference for full marks:

  • Similarity: both sites fail every district target, with phosphate (0.42 and 0.65 mg L⁻¹) many times above the target of 0.05 mg L⁻¹ [1].

  • Similarity: both have low Secchi depths (0.4 and 0.6 m), showing turbid water compared with 2.1 m at site B [1].

  • Difference: site A has higher nitrate (4.8 mg L⁻¹) than site C (3.2 mg L⁻¹), whereas site C has a much higher BOD (11.2 compared with 6.5 mg L⁻¹) and lower dissolved oxygen (3.4 compared with 5.1 mg L⁻¹) [1].

(b) Up to 4 marks:

  • Forest cover fell from 46% to 24% while cropland rose from 30% to 47% of the catchment [1].

  • With less forest, less rain is intercepted and soil is exposed, so more surface run-off and soil erosion carry sediment into the Kaso River, making the water turbid (Secchi depth 0.4 m) [1].

  • More cropland means more fertiliser use; nitrate and phosphate are carried into the river by run-off and leaching, raising nitrate to 4.8 mg L⁻¹ at site A [1].

  • The loss of wetland (from 4% to 2%), which filtered sediment and absorbed nutrients before they reached the lake, means more pollutants reach site A [1].

  • Organic matter in the run-off (soil, manure) is decomposed by bacteria, raising BOD to 6.5 mg L⁻¹ and lowering dissolved oxygen [1].

Common mistake

Answering “compare and contrast” with two separate lists, one for each site. Each marking point should mention both sites and, wherever possible, quote values from the table for both.

Question 4: the systems diagram

Worked example

Identify the flows labelled A to E in Figure 4. [3]

Show the answer

Answer: A: run-off and leaching of fertiliser from farmland; B: uptake (absorption) by algae and water hyacinth; C: death; D: decomposition (release of phosphate by decomposers); E: discharge of sewage effluent.

Marking: all five correct [3]; three or four correct [2]; one or two correct [1].

Completed systems diagram: A run-off and leaching from farmland soil to dissolved phosphate; E sewage effluent from Melora town; B uptake by algae and hyacinth; C death to dead organic matter; D decomposition back to dissolved phosphate; settling to sediment.Completed systems diagram: A run-off and leaching from farmland soil to dissolved phosphate; E sewage effluent from Melora town; B uptake by algae and hyacinth; C death to dead organic matter; D decomposition back to dissolved phosphate; settling to sediment.
The completed diagram (invented place). Flows B, C and D form a loop: phosphate released by decomposition is taken up again, which keeps the lake productive even if inputs fall.

Extension: flows B, C and D form a cycle inside the lake. Phosphate stored in the sediment can be released again when the water near the bottom loses oxygen, so a lake may stay eutrophic for years after inputs are cut. This is a time lag that any management plan has to allow for.

Question 5: population growth

Worked example

(a) The population of Melora town is growing at 3.5% per year. Calculate its doubling time. [1] (b) Suggest two consequences for Lake Melora if this growth continues. [2]

Show the model answers

(a) Doubling time = 70 ÷ 3.5 = 20 years [1].

(b) Any two, linked to the resources: more sewage, raising phosphate and BOD at site C further unless treatment is improved [1]; more demand for fish, increasing fishing effort on stocks that are already declining [1]; more land cleared for housing and farms, increasing run-off and sediment [1]; more demand for charcoal, increasing deforestation in the Ashani reserve [1].

Question 6: water hyacinth

Worked example

Outline two ways in which the mats of water hyacinth may affect the ecosystem of Lake Melora. [2]

Show the model answer

Model answer: The mats shade the water below, so phytoplankton and submerged plants cannot photosynthesise, reducing primary productivity and oxygen production [1]. When the plants die and decompose, decomposers use dissolved oxygen, which can kill fish and invertebrates beneath the mats [1].

Also accepted: competition with native plants; blocking canoe access and landing sites; habitat for disease vectors such as snails and mosquitoes; increased water loss by transpiration.

Question 7: explaining a decline

Worked example

Using the resources, suggest three reasons for the decline in the catch of native cichlids. [3]

Show the model answer

Model answer (one mark per developed reason, up to 3):

  • Overfishing: the number of canoes almost tripled and smaller-mesh nets catch young fish before they breed, so recruitment falls below the catch [1].

  • Competition or predation by an introduced species: Nile tilapia, introduced in 1996, increased as the cichlids declined, suggesting it competes with them for food or breeding sites [1].

  • Pollution: low dissolved oxygen near the town (3.4 mg L⁻¹) and the river mouth, caused by organic pollution and eutrophication, may kill fish or their eggs [1].

  • Habitat change: turbid water from sediment and hyacinth mats may damage breeding areas or reduce the food supply [1].

Why it scores: each reason is linked to evidence in a named resource. “Climate change” with no evidence from the booklet would not be credited.

Question 8: perspectives

Worked example

Distinguish between the perspectives of the chair of the fishers’ association and the elder of the Ashani forest community. [2]

Show the model answer

Model answer: The fishers’ chair takes a largely anthropocentric view focused on short-term livelihoods, opposing a closed season because of lost income, whereas the Ashani elder values the forest for its role in keeping water clean and for long-term stewardship, a more ecocentric view shaped by traditional knowledge [1]. The fishers want support to keep fishing now, while the elder wants charcoal cutting by outsiders stopped so the forest is protected for future generations [1].

Tip

Stakeholder statements in a booklet often line up with the environmental value systems: a business focused on jobs and growth (anthropocentric or technocentric), an official relying on technical fixes (technocentric), a community stressing care for the land (ecocentric). Naming the value system is one easy way to show analysis.

The final evaluation question

Most Paper 1s end with a longer question that brings the whole booklet together. It is usually the single part worth the most marks, and it is where the strongest answers pull ahead. The question for the Lake Melora booklet is given in full, followed by a weak and a strong answer and how each would be marked.

Worked example

Question 9. With reference to the resources, evaluate the strategies proposed in the 2025 lake plan for making the use of Lake Melora more sustainable. [6]

Show the weak and strong answers

Weak answer (about 2 out of 6): “The closed season is a good idea because it lets the fish breed. Buffer strips will stop pollution. Sewage treatment is good but expensive. Weevils will eat the hyacinth. Paying the forest people is fair. Overall the plan is good because it has lots of strategies.”

Why it is weak: every point is a bare statement with no evidence from the resources and no limitation explained, so there is no real evaluation. The conclusion counts strategies instead of judging them.

Strong answer (6 out of 6):

The plan tackles the three main pressures shown in the resources: overfishing, nutrient pollution and catchment degradation. The closed season and minimum mesh size target overfishing directly: catch per canoe fell from 22.4 to 6.3 tonnes, so protecting breeding fish should help native cichlid stocks recover. Its weakness is social, since the fishers’ chair says it means three months with no income; without compensation or alternative work, compliance and enforcement may be poor.

Sewage treatment addresses the worst site in Table 1: site C has a BOD of 11.2 mg L⁻¹ and phosphate thirteen times the target. Tertiary treatment removes phosphate and would reduce the nutrient supply to the hyacinth, but it is expensive and only 60% of households are connected, so it must be combined with extending the sewer as the town doubles in about 20 years.

Buffer strips and payments to Ashani communities treat the causes in the catchment: forest fell from 46% to 24% and nitrate at site A is 4.8 mg L⁻¹. Trees along the river trap sediment and nutrients, and paying the community that already protects the forest supports both the clean Ashani stream and local livelihoods. They work slowly, however, because trees take years to grow and phosphate stored in the sediment keeps being released.

Biological control of hyacinth treats a symptom: weevils and harvesting can reduce the 14% cover and turn the mats into compost, but without lower phosphate inputs the hyacinth is likely to return.

Taken together, the plan can make the lake substantially more sustainable, because together its strategies act on the causes (nutrients, deforestation, fishing effort) as well as the symptoms. Its success depends on two things the plan does not yet include: support for fishers during the closed season and controls on fertiliser use by the flower farms, which use lake water and apply fertiliser on the shore.

Why it scores: every strategy is weighed (strength and limitation), evidence is quoted from four different resources, several stakeholders’ perspectives appear, cause and symptom are distinguished, and the conclusion makes a judgement with conditions. It also spots a gap in the plan, which shows critical thinking.

Exam tip

In the final question, aim to use evidence from at least three different resources, consider at least two perspectives, give a strength and a limitation for each strategy you discuss, and end with a judgement in the words of the question (“substantially”, “only partly”, “in the short term but not the long term”).

Covering every strategy is not always necessary. If time is short, two or three strategies evaluated in depth, with evidence and a judgement, usually score better than five strategies each given one line.

Common mistakes on Paper 1

Examiners see the same errors every session. Most cost one or two marks each, but across a whole paper they add up to a large share of the marks.

Common mistake

Quoting data without units or with the wrong units. “The catch fell to 1.8” is incomplete; “the catch fell to 1.8 thousand tonnes per year” is correct. Check whether a figure shows totals, percentages, rates or values per person before using it.

A related error is reading the wrong series. When a graph has two lines or a table has several columns, put a finger or a ruler on the right line before reading a value, and name the series in the answer.

Common mistake

Treating correlation as proof. Figure 2 shows native cichlids declining as tilapia increased, but the data alone do not prove that tilapia caused the decline: overfishing and pollution changed at the same time. Strong answers say “suggests” or “may have contributed” and name the other possible causes.

Generic answers are the third common problem. A suggestion such as “the government should educate people” could apply anywhere and earns little. Make it specific to the place: who should be educated about what, and why the resources show it is needed.

Common mistake

Spending too long on short questions. A 1-mark “identify” needs one word or value; a 2-mark calculation needs two lines. Save time and detail for the explain and evaluate questions, which carry more marks each.

How SL and HL papers differ

The SL and HL Paper 1s have the same format: one unseen case study, a resource booklet and compulsory questions marked with a question-specific markscheme. The HL paper is twice as long, with twice the marks, so it has more questions on the booklet and may include more resources and more extended questions.

HL students study additional content in most topics and the three HL lenses (environmental law, environmental economics and environmental ethics). An HL booklet may give the chance to use that material, for example by naming the legal status of a protected area, using an economic tool such as payments for ecosystem services, or discussing the intrinsic value of an endemic species. Bringing a lens in where it fits, briefly and accurately, strengthens an evaluation.

Worked example

(HL) Using the resources, discuss whether paying the Ashani forest communities to protect the forest is likely to succeed. [4]

Show the model answer

Model answer (one mark per developed point, up to 4):

  • It is a form of payment for ecosystem services: the community is paid for the clean water and reduced erosion that the forest provides to everyone downstream [1].

  • It rewards people who already protect the forest and have traditional knowledge of it, so it is likely to be accepted and it is fairer than excluding them from the reserve [1].

  • Its success depends on the payments being larger than the income from cutting trees for charcoal, and on secure land rights so the community can exclude outsiders [1].

  • Payments need long-term funding (for example from water fees paid by the flower farms and the town), otherwise protection may stop when the money does; monitoring is also needed to show the forest is actually being protected [1].

Preparing for Paper 1

Paper 1 cannot be revised by learning a case study, so preparation means practising the skills on unfamiliar material. Three habits make the most difference.

  1. Practise on real data from unfamiliar places. Take a graph or table from a news article, an agency report or a data site, and ask yourself the standard questions: describe the trend, calculate the change, suggest reasons, evaluate a response.

  2. Build a concept bank. For each topic, list the concepts and models that explain patterns in data: eutrophication, biomagnification, the tragedy of the commons, maximum sustainable yield, positive and negative feedback, succession, the demographic transition, the pollution management model. In the paper, these are the words that turn a description into an explanation.

  3. Rehearse the final question. Practise writing six-mark evaluations under time pressure, using evidence from several resources and ending with a judgement.

Add to your notes: a one-page Paper 1 checklist: the question types with what earns their marks, the formulas for percentage change, rates and doubling time, the three environmental value systems with a phrase that signals each, and a four-line plan for the final evaluation question.

Before answering

While answering

Before moving on

Skim the questions; read the fact file; annotate every figure.

Use the command term; quote values with units; name the figure; use ESS terms.

Have I answered the command term? Are units given? Have I used the resource the question named?

Exam tip

Use the same terms as the resources and the markscheme would: if the booklet calls a fish “native cichlids”, use that name. If the question says “Using Figure 3”, the first sentence of the answer should quote Figure 3.

Tip

Highlighting every number in the booklet is less useful than circling the few that matter: the start and end of each trend, the highest and lowest values, and any value that breaks a pattern.

Key points

  • Paper 1 is an unseen case study: every question is based on a resource booklet about one unfamiliar place.

  • All questions are compulsory and marked with a question-specific markscheme; they move from short data questions to extended evaluation.

  • Read the title, axes, units and key of every figure before the data, and annotate the booklet as you read.

  • Quote values with units, name the figure, and link the evidence to ESS concepts in every answer.

  • Describe questions want values, not reasons; explain questions want a chain of causes tied to the resources.

  • Suggest and evaluate answers must fit the place in the booklet, not a case study learned in class.

  • The final question rewards evidence from several resources, more than one perspective, strengths and limitations of each strategy, and a clear judgement.

  • The HL paper has the same format at twice the length; HL lenses can strengthen evaluations where they fit.

Keep your place

In Augment the notes remember where you stopped and which pages you have finished.

Open in Augment

More IB ESS notes

  • Command termsThe page before this.
  • Paper 2 Section A: short-answer and data-based questionsThe next page.
  • ESS assessmentEach ESS paper, the internal assessment and grade boundaries.
  • IB ESSThe ESS syllabus, how it is assessed and every notes page.

Carry on with ESS in Augment

With a free account, Augment remembers where you stopped in the notes and which questions you have marked.

Start free