Command terms
Know what every command term asks for, how marks are awarded for each, and how to tell confusable terms apart, with model answers to ESS questions that show weak and strong responses.
- IB Environmental Systems and Societies
- Exam skills
- SL and HL
Every question on an ESS paper begins with a command term: a verb such as “state”, “explain” or “evaluate” that tells you what kind of answer is wanted. The command term sets the depth of the answer, and the mark allocation in square brackets tells you how many separate points the markscheme is looking for. Two students with the same knowledge can score very differently because one answers the command term and the other writes everything they know about the topic.
Each command term has a fixed meaning set by the IB, and that meaning does not change from one question or paper to the next. Learning those meanings, and what an answer to each one looks like in ESS, is one of the quickest ways to raise your marks on both papers.
What command terms do
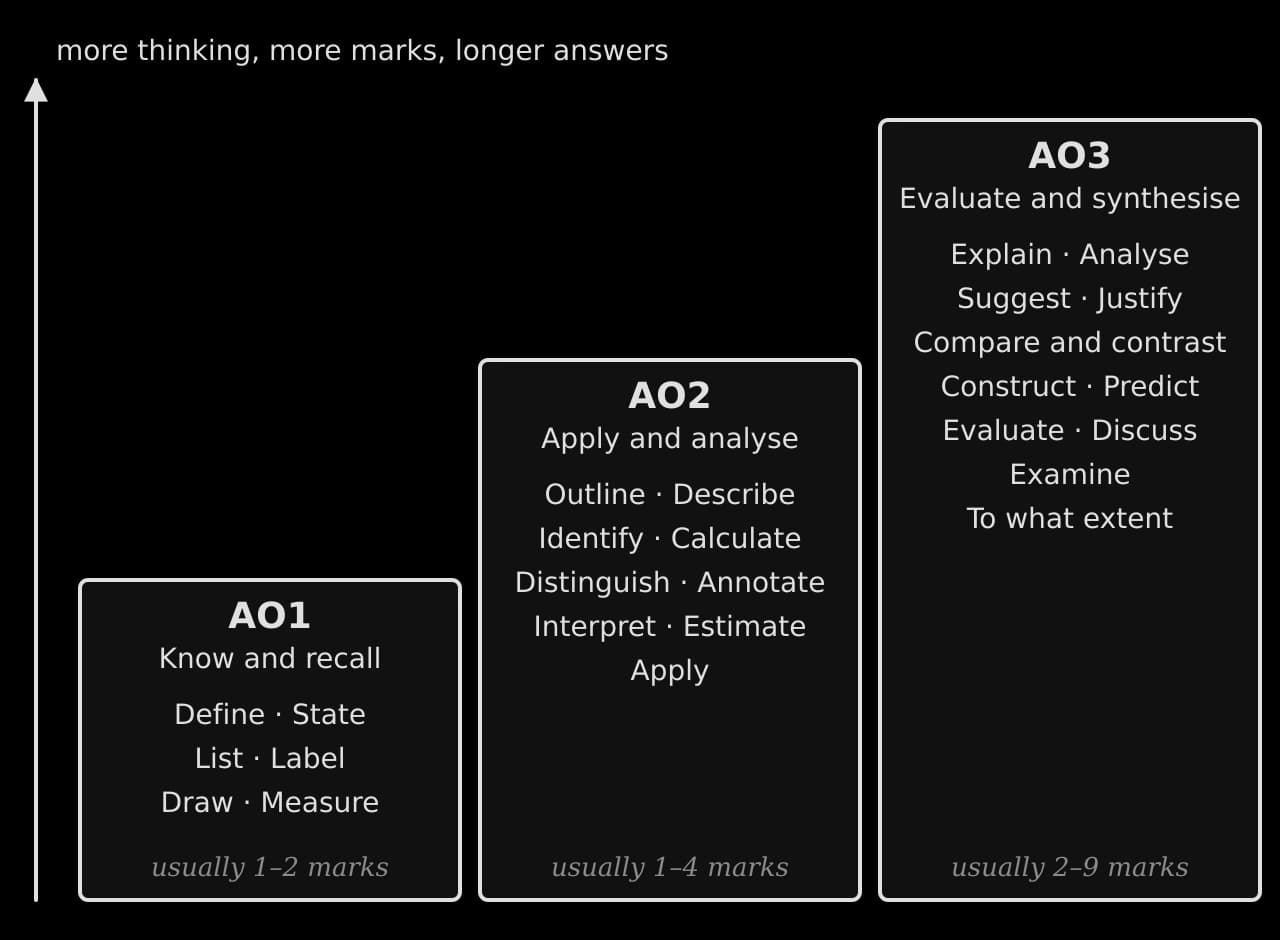
Command terms are grouped by the assessment objectives (AOs) they test. AO1 terms ask you to recall knowledge, such as a definition or a name. AO2 terms ask you to apply and analyse it, such as describing a trend in data or calculating a value. AO3 terms ask you to evaluate and synthesise: to explain causes, weigh up strengths and limitations, and reach a supported judgement. A fourth objective, AO4, covers investigative skills and is assessed mainly through the individual investigation.
As the cognitive demand rises, the number of marks and the length of answer expected usually rise too. A “state” question is often worth 1 mark and needs a few words. An “evaluate” or “to what extent” question at the end of an essay is worth 9 marks and needs several developed paragraphs with a conclusion.
How marks are awarded
Short and structured questions are marked with a markscheme: a list of acceptable points, usually one mark each, up to the total in brackets. If an “Outline two…” question is worth [4], the markscheme typically gives 1 mark for each of two valid points and 1 mark for developing each one. If an “Explain” question is worth [3], it usually wants three linked steps in a chain of reasoning, or one point explained in enough depth to earn three marks.
The last part of each Paper 2 Section B essay is marked differently, with markbands. The examiner reads the whole answer and matches it to the band whose description fits best: the breadth and accuracy of knowledge, the use of examples, the balance of the analysis and the quality of the judgement. Counting points does not work there. The command terms that appear in that part (“evaluate”, “discuss”, “to what extent”, “examine”, “justify”) all ask for a judgement.
AO1 terms: knowledge and recall
AO1 command terms ask for precise knowledge without reasons. Answers are short, and the marks go to accuracy and the correct ESS terminology.
Command term | Meaning | What an ESS answer looks like |
|---|---|---|
Define | Give the precise meaning of a word, phrase, concept or physical quantity. | One sentence in the course’s wording, with the key qualifiers (“per unit area per unit time”, “of the same species”). |
State | Give a specific name, value or other brief answer without explanation or calculation. | A word, a number with units or a short phrase: “Nitrogen fixation”, “25%”. |
List | Give a sequence of brief answers with no explanation. | Separate items on separate lines; no reasons. |
Label | Add labels to a diagram. | Names written on the diagram with a line to the exact part (“canopy”, “B horizon”, “thermocline”). |
Draw | Represent by a labelled, accurate diagram or graph, in pencil, with a ruler for straight lines; graphs with points plotted correctly and joined by a straight line or smooth curve. | A neat, fully labelled diagram (axes with units, every box and arrow named). |
Measure | Obtain a value for a quantity. | A reading from a graph, map or diagram with units, using the scale given. |
Define
A definition earns its mark only if it is precise. Vague, everyday meanings are not enough, and examples alone are not a definition. The safest approach is to learn the definitions of the key terms of each topic word for word as they appear in the glossary, including the qualifiers that make them precise.
State and list
“State” and “list” want brief answers with no explanation. A reason added to a “state” answer earns nothing, although it does not usually lose marks either. The risk is time: a student who explains every “state” answer may run short at the end of the paper.
Draw, label and measure
“Draw” means an accurate, labelled diagram or graph. For a graph, the axes are labelled with the quantity and its units, the scale is even, and points are plotted correctly. For a systems diagram, storages are boxes and flows are labelled arrows. An unlabelled diagram, however neat, usually earns very little.
“Label” asks only for names placed on a diagram that is already given. “Measure” asks you to read a value, for example the length of a transect on a scaled diagram or a value from a graph, and to give it with units.
AO2 terms: application and analysis
AO2 command terms ask you to use your knowledge: to describe what data show, calculate from them, tell concepts apart, or apply an idea to a new situation. Most Paper 1 questions and many Paper 2 Section A questions use them.
Command term | Meaning | What an ESS answer looks like |
|---|---|---|
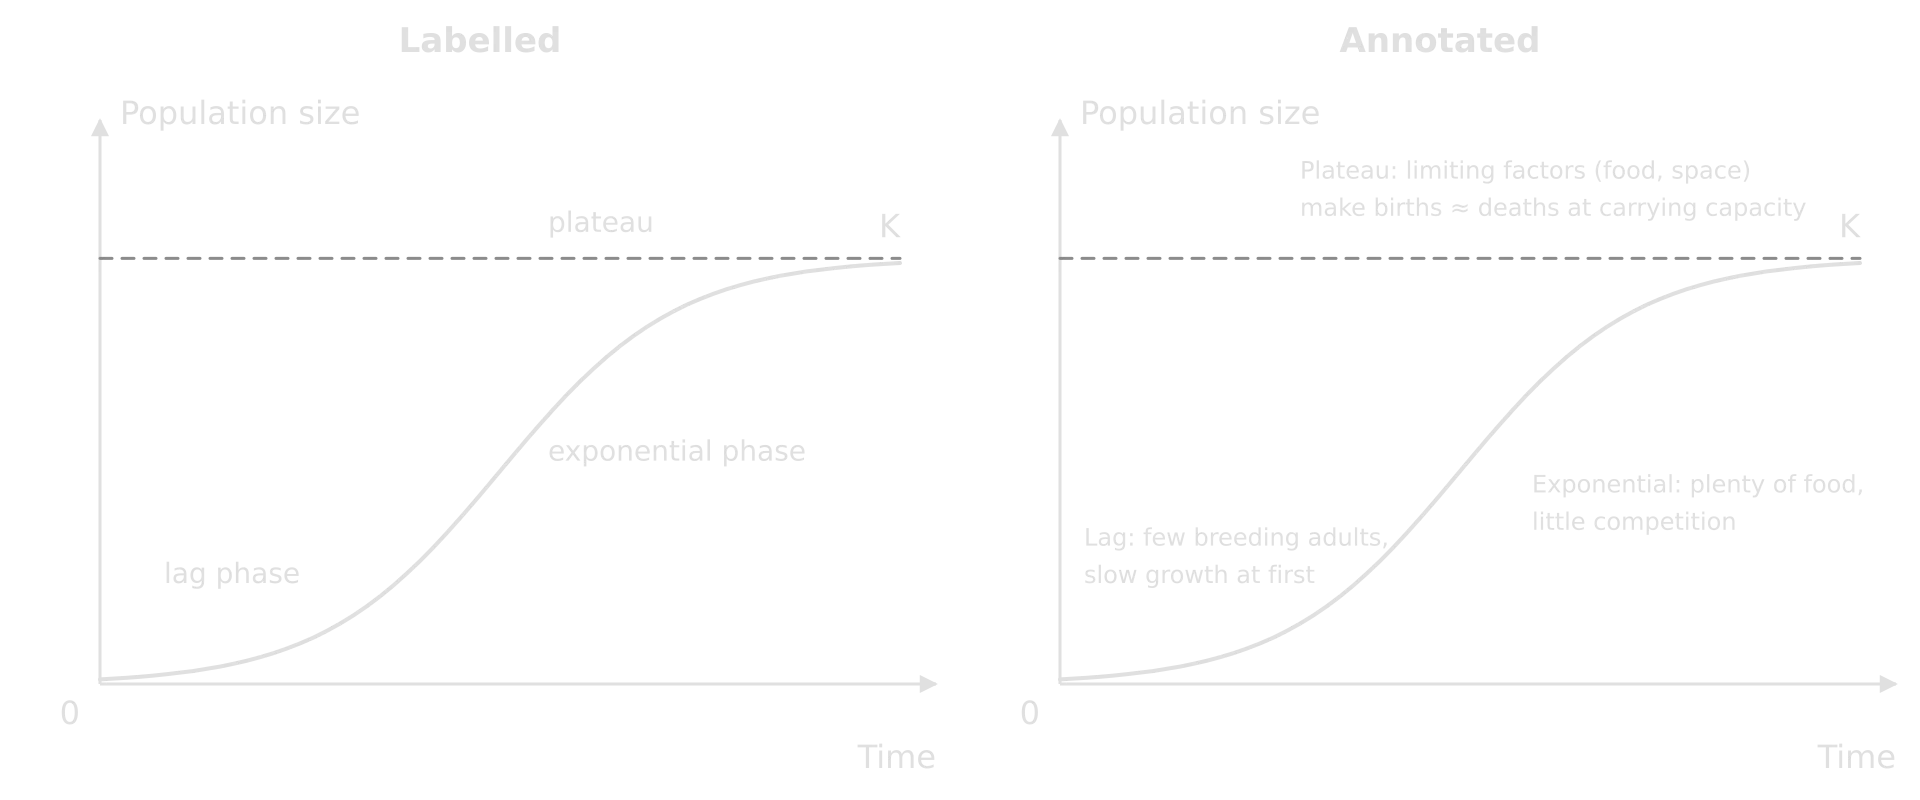
Annotate | Add brief notes to a diagram or graph. | Short explanatory notes placed on the figure, next to the feature they explain. |
Apply | Use an idea, equation, principle, theory or law in relation to a given problem or issue. | A named concept used on the case in front of you (“The tragedy of the commons applies because…”). |
Calculate | Obtain a numerical answer showing the relevant stages of working. | Formula, substitution with units, answer with units and sensible rounding. |
Describe | Give a detailed account. | For data: the overall trend, values with units and dates, changes in rate, anomalies. For a process: the stages in order. |
Distinguish | Make clear the differences between two or more concepts or items. | Paired statements, each one showing a difference (“A is…, whereas B is…”). |
Estimate | Obtain an approximate value. | A rounded value read or worked out from given data, with units. |
Identify | Provide an answer from a number of possibilities. | The correct item picked from a figure or list, often one word or one value. |
Interpret | Use knowledge and understanding to recognise trends and draw conclusions from given information. | What the data show, plus what that means, using ESS concepts. |
Outline | Give a brief account or summary. | One sentence per point; no long reasons needed. |
Identify, calculate and estimate
“Identify” is a selection task: the answer is somewhere in the resource or among a small set of possibilities, and the mark is for picking the right one. “Calculate” always needs working. “Estimate” accepts an approximate value, but it should still be reasoned from the data rather than guessed.
Outline, describe and explain
These three terms are the ones students confuse most, and they appear on almost every paper. They ask for the same topic at three increasing depths. “Outline” gives a brief account. “Describe” gives a detailed account of what happens or what the data show, but without reasons. “Explain” adds the reasons or causes: the “why” or “how”.
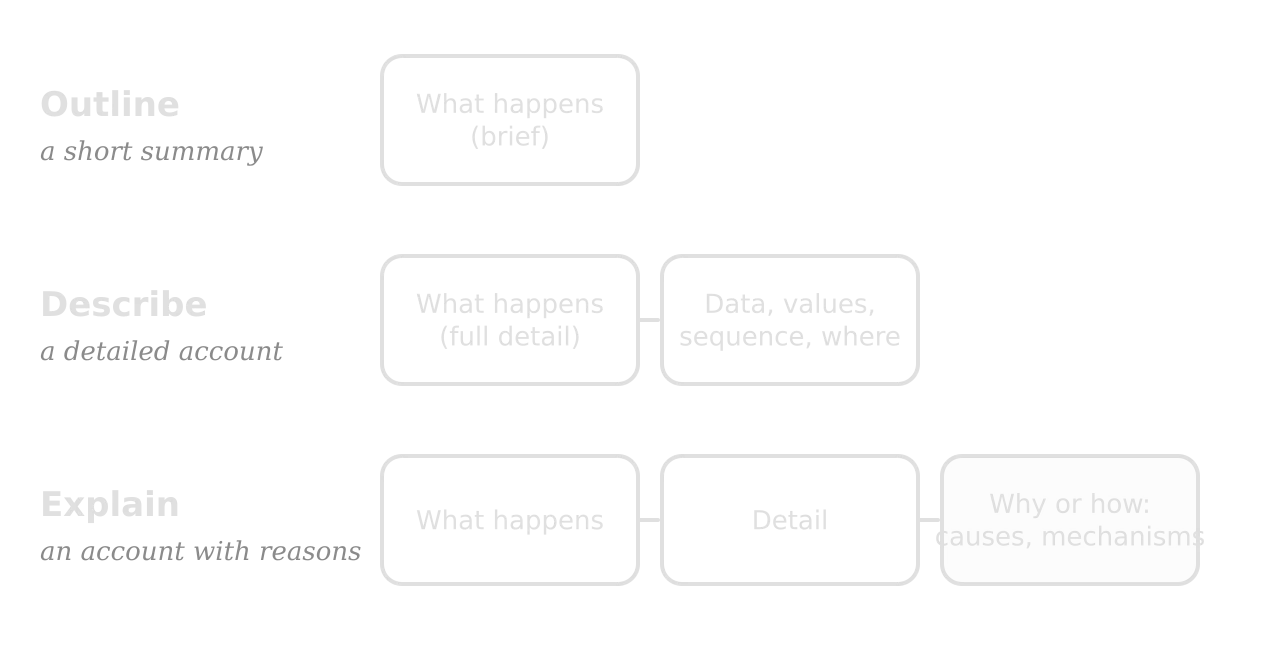
Strictly, “explain” is an AO3 term, but it belongs with the other two because questions so often move from one to the next. The difference is easiest to see when the same topic is asked three ways.
Describing data well
“Describe” questions on graphs and tables are common on Paper 1. A strong description gives the overall trend first, then supports it with values (start, end, maximum, minimum) and dates, then notes changes in the rate of change and any anomalies. It does not explain. Describing trends, gradients and rates of change is practised in more depth in “Calculations and data skills”.
Distinguish
“Distinguish” wants the differences between two things, and the marks go to statements that make a difference clear. Two separate definitions, one after the other, leave the examiner to find the difference, and often lose marks. Each sentence should mention both items and use a contrast word such as “whereas” or “while”.
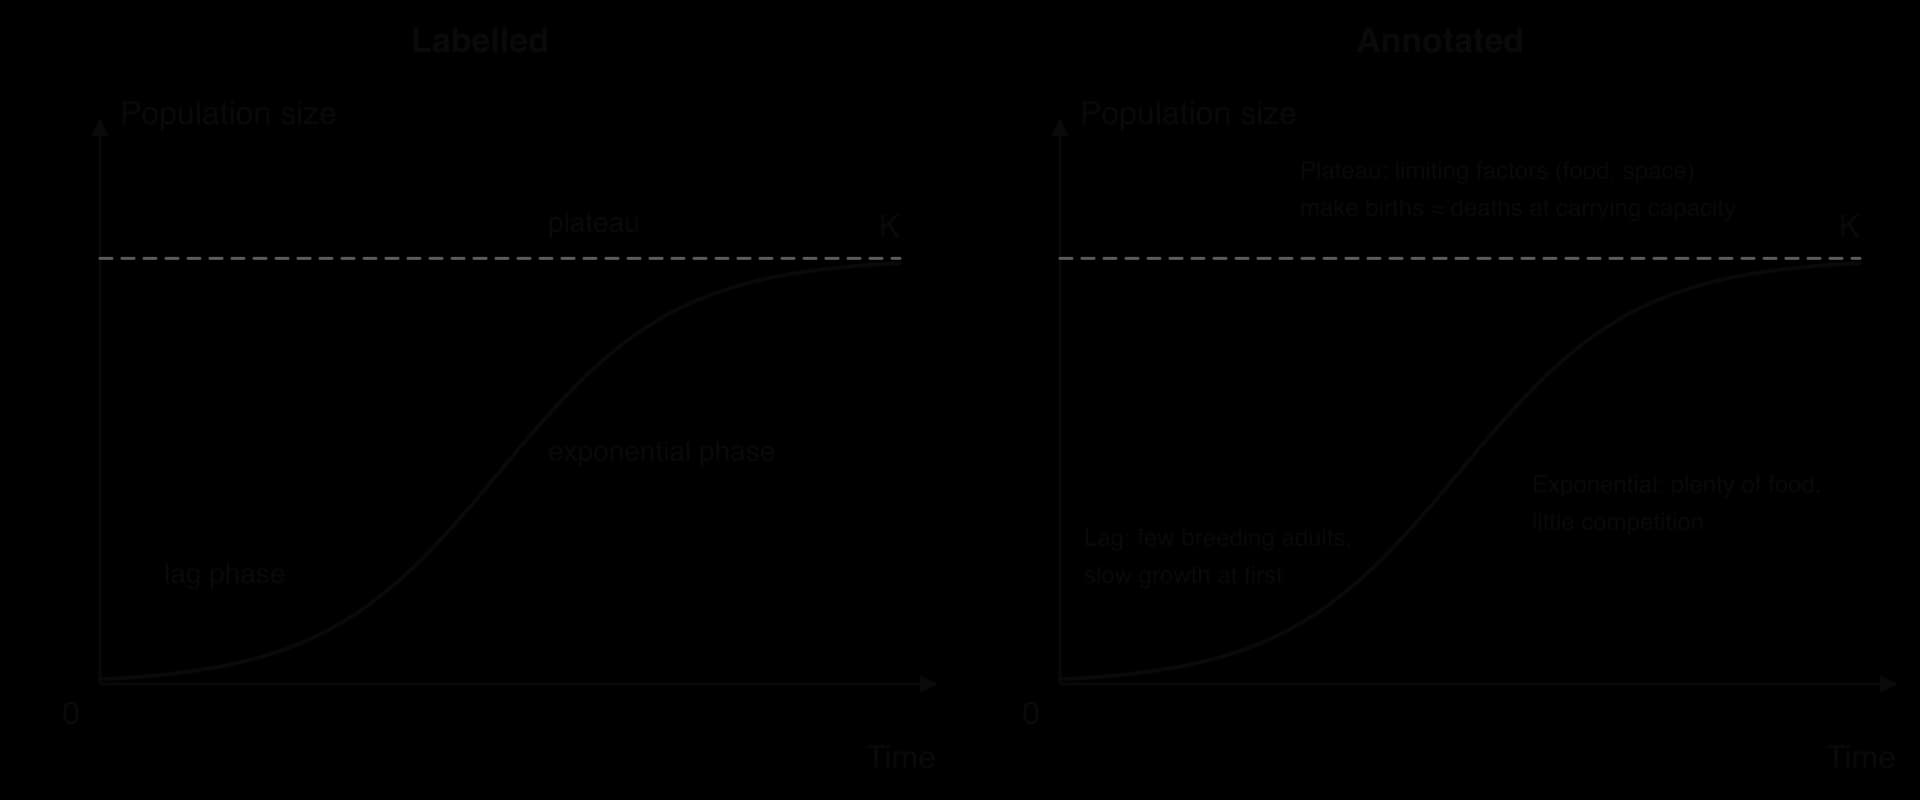
Annotate and label
“Label” asks for names; “annotate” asks for brief notes that explain. On a graph, an annotation says why a section looks the way it does or what is happening at a point. Annotations should be on the figure itself, next to the feature, and short enough to fit.
Interpret and apply
“Interpret” goes one step beyond describing data: you recognise the trend and then draw a conclusion from it using ESS knowledge. “Apply” asks you to use a named idea, model or equation on the situation in front of you, often an unfamiliar place in a Paper 1 resource booklet.
AO3 terms: evaluation and synthesis
AO3 command terms ask you to reason: to explain causes, to break an issue into its parts, to compare, to weigh evidence and to reach a judgement. They carry the most marks. The table gives every AO3 and AO4 term with what it looks like in an ESS answer; the most common ones are worked through after it.
Command term | Meaning | What an ESS answer looks like |
|---|---|---|
Analyse | Break down to bring out the essential elements or structure. | The parts of an issue or data set identified and how they relate (causes, components, stakeholders, flows). |
Comment | Give a judgement based on a given statement or the result of a calculation. | One or two sentences on what a result means or how far a statement is valid. |
Compare and contrast | Give an account of similarities and differences between two (or more) items or situations, referring to both (all) of them throughout. | Paired sentences covering similarities and differences, each naming both items. |
Construct | Display information in a diagrammatic or logical form. | A systems diagram, food web, pyramid, table or graph built from given data. |
Deduce | Reach a conclusion from the information given. | A conclusion that follows logically from the data, with the step of reasoning shown. |
Demonstrate | Make clear by reasoning or evidence, illustrating with examples or practical application. | A claim supported by a worked example or a named case. |
Derive | Manipulate a mathematical relationship to give a new equation or relationship. | Rare in ESS: rearranging an equation, such as GP = NP + R from NP = GP − R. |
Design | Produce a plan, simulation or model. | A method for an investigation (variables, sampling, repeats) or a management plan. |
Determine | Obtain the only possible answer. | A single correct value or item, found from the data. |
Discuss | Offer a considered and balanced review that includes a range of arguments, factors or hypotheses; opinions or conclusions presented clearly and supported by appropriate evidence. | Several arguments on more than one side, from several perspectives, with a supported conclusion. |
Evaluate | Make an appraisal by weighing up the strengths and limitations. | Strengths and limitations of a strategy, model or method, then an overall judgement. |
Examine | Consider an argument or concept in a way that uncovers the assumptions and interrelationships of the issue. | The hidden assumptions and links between factors, not just a list of factors. |
Explain | Give a detailed account including reasons or causes. | A chain of cause and effect, using “because”, “so”, “which leads to”. |
Justify | Give valid reasons or evidence to support an answer or conclusion. | The reasons and evidence for a choice that is given or that you made. |
Predict | Give an expected result. | A specific outcome (a direction and, if possible, a size), usually from a trend or a model. |
Sketch | Represent by a diagram or graph (labelled as appropriate) giving a general idea of the shape or relationship and including relevant features. | A labelled freehand graph showing the correct shape, such as an S-curve or a yield–effort curve. |
Suggest | Propose a solution, hypothesis or other possible answer. | A plausible idea applied to the context; more than one answer may be credited. |
To what extent | Consider the merits or otherwise of an argument or concept; opinions and conclusions presented clearly and supported with evidence and sound argument. | A position on how far a claim holds, argued on both sides and stated in the conclusion. |
Explain
An explanation is a chain. Each link answers “why?” or “how?” for the link before it, and the last link reaches the outcome the question asks about. In a 3- or 4-mark question, each well-made link is usually one marking point. Explanations score best when they use the precise ESS process names, such as evapotranspiration, positive feedback or biomagnification, because these are the words in the markscheme.
Suggest, predict, deduce and determine
“Suggest” is the most open of all command terms. It asks for a plausible answer that fits the context, and markschemes usually accept a range of answers, including ones the examiner did not list, if they are reasonable. Paper 1 uses it often, because the place in the resource booklet is unfamiliar and there is no single right answer.
“Predict” wants an expected result, ideally with a direction and a size. “Deduce” wants a conclusion that follows logically from the information given, and “determine” wants the only possible answer, often a single value read or worked out from data.
Compare and contrast
“Compare and contrast” asks for both similarities and differences, and requires you to refer to both items throughout. An answer with only differences usually cannot reach full marks. Writing one paragraph about each item separately is the most common way to lose marks: each sentence should mention both items.
Construct, sketch, draw and design
These four terms all ask you to produce something. “Draw” wants an accurate diagram or graph, with points plotted correctly. “Sketch” wants the right general shape and the key features labelled, but not exact values. “Construct” wants information, often from given data, organised into a diagram or logical form: a systems diagram, a food web, a pyramid or a table. “Design” wants a plan, such as a sampling method or a management scheme.
Analyse and examine
“Analyse” wants an issue broken into its essential parts and the relationships between them. For data, that may mean separating the trend from the anomalies or comparing two sites; for an issue, it may mean separating the causes, the stakeholders or the parts of a system. “Examine” goes further: it asks you to uncover the assumptions and interrelationships behind an argument. An examine answer asks what has to be true for a claim to work, who benefits and who does not, and how the factors depend on each other.
Justify, comment and demonstrate
“Justify” wants reasons and evidence that support a stated choice or conclusion: the answer should end in the choice and show why it is the right one. “Comment” wants a short judgement on a statement or a calculated result, such as whether a value is high or low and what that shows. “Demonstrate” wants a point made clear by reasoning and an example.
Evaluate, discuss and to what extent
These three terms appear in the 9-mark final parts of Section B essays and in the longer questions at the end of Paper 1. All three end in a supported judgement, but they ask for slightly different things, and an answer that recognises the difference reads as more focused.
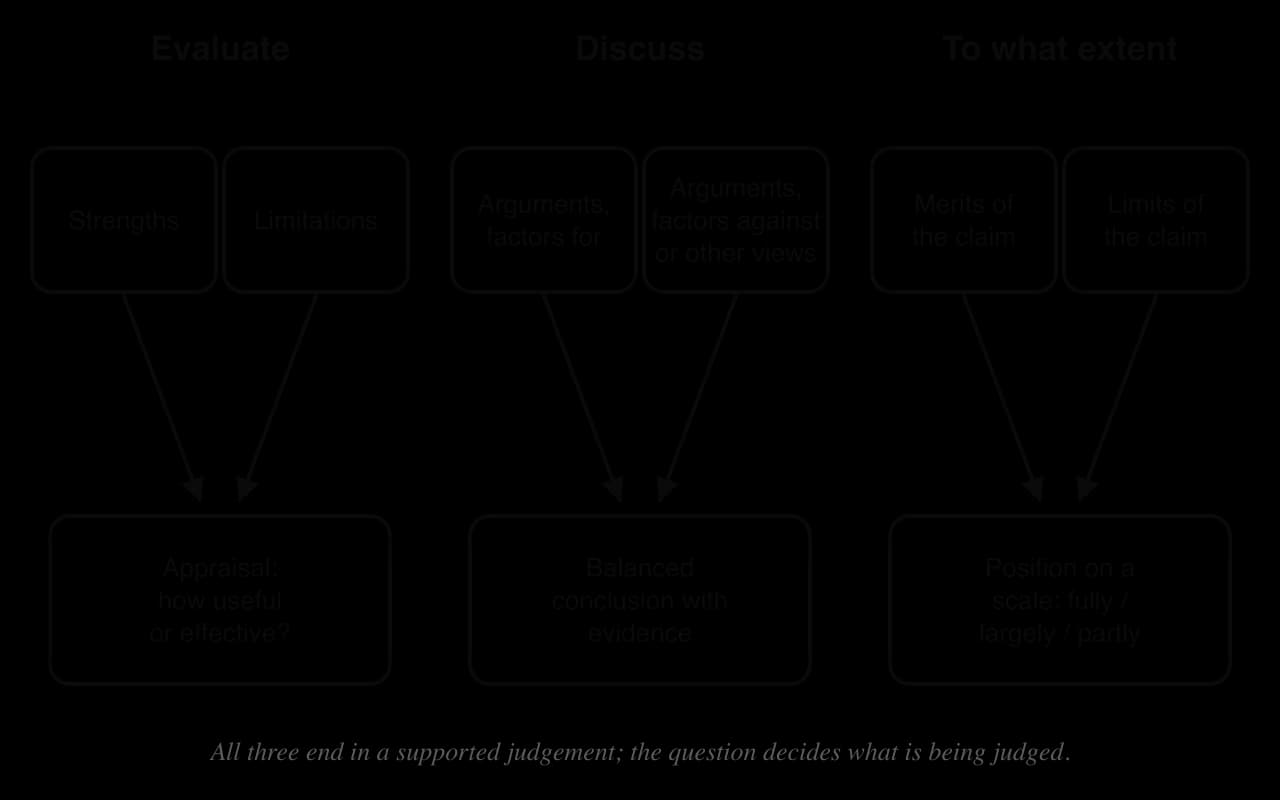
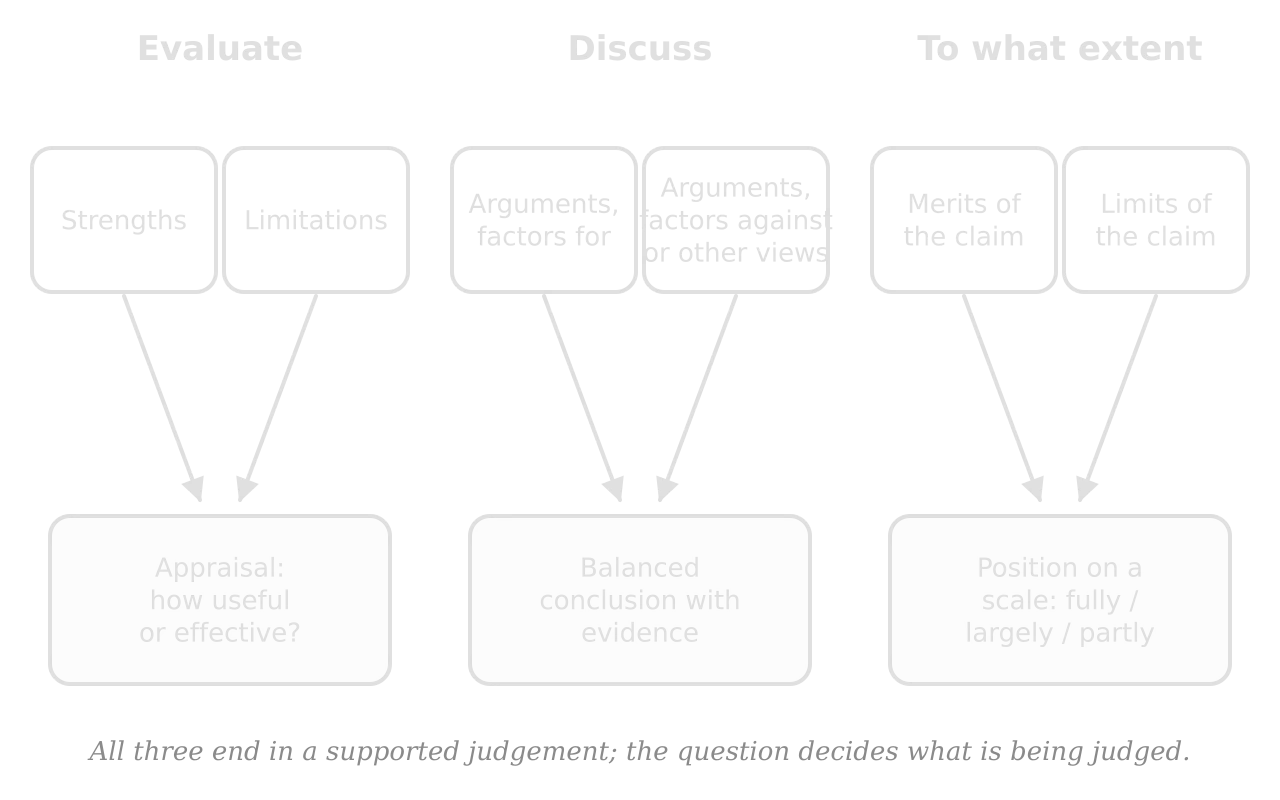
Evaluate asks for an appraisal of a strategy, model, method or policy by weighing its strengths and limitations. The conclusion answers “how useful, effective or sustainable is it, and under what conditions?”.
Discuss asks for a balanced review of a range of arguments, factors or hypotheses, often from several perspectives. The conclusion states your view and supports it.
To what extent asks how far a claim or argument holds. The answer considers the merits and limits of the claim and ends with a clear position on a scale: fully, largely, partly or hardly at all.
Weak and strong paragraphs compared
The example question is “Evaluate the use of fishing quotas as a strategy for managing a fishery sustainably. [9]”. The two paragraphs make the same basic point; only the second is evaluating.
Bringing in perspectives
In ESS, a balanced answer is usually balanced between perspectives as well as between arguments. A technocentric view may welcome a technological fix such as desalination, an ecocentric view may stress its impact on marine ecosystems and its energy use, and an anthropocentric view may judge it by its cost and who gets the water. Naming the perspective and saying what it values shows the examiner the analysis is balanced. HL students strengthen this further with legal, economic and ethical angles from the HL lenses.
Confusable command terms
The table sets out the pairs and groups that cost the most marks, with the one difference that matters.
Terms | The difference | Quick test |
|---|---|---|
State vs outline | State: a name or value only. Outline: a brief account, usually one sentence per point. | Could the answer be one word? Then it is “state”. |
Outline vs describe | Describe needs more detail: values, sequence, place. | Does the answer use numbers from the resource? A description should. |
Describe vs explain | Explain adds reasons or causes. | Does every point answer “why?”? |
Label vs annotate | Annotate adds a brief note that explains, not just a name. | Does each note say something about the feature? |
Draw vs sketch | Draw is accurate and to scale; sketch shows the general shape and key features. | Are exact values needed? Then it is “draw”. |
Calculate vs estimate | Calculate: a precise answer with the stages of working shown. Estimate: an approximate value, still reasoned from the data. | Is an approximate value enough? Then it is “estimate”. |
Identify vs state | Identify chooses from possibilities given (often in a resource). | Is the answer somewhere in front of you? |
Distinguish vs compare and contrast | Distinguish: differences only. Compare and contrast: similarities and differences. | Is there at least one similarity in a compare-and-contrast answer? |
Suggest vs predict | Suggest proposes a plausible answer; predict gives an expected result. | Is it a reason or a solution (suggest) or an outcome (predict)? |
Deduce vs determine | Deduce reaches a conclusion by reasoning; determine finds the only possible answer. | Is there exactly one right answer? |
Analyse vs examine | Examine also uncovers assumptions and interrelationships. | Has an assumption been named? |
Evaluate vs discuss vs to what extent | Evaluate: strengths and limitations, then an appraisal. Discuss: a range of arguments, then a conclusion. To what extent: merits and limits of a claim, then a position on a scale. | Does the conclusion answer the question in its own words? |
A routine for every question
Most lost marks come from misreading the question, not from missing knowledge. A routine that takes a few seconds per question prevents most of them.
Find the command term and underline it. Decide what kind of answer it wants: a name, a description, a reason, a calculation or a judgement.
Check the marks. Plan roughly one point per mark, and one extra on longer questions.
Underline the focus words: the exact topic, place, time period or number of items (“two”, “in the resource”, “for a named ecosystem”).
Check for an instruction to use the resource. “Using Figure 3” or “With reference to the data” means marks are given for quoting values from it.
Answer, then reread the question. Check the answer does what the command term asks, uses ESS terminology and gives units with every number.
Common mistakes with command terms
The opposite error is just as costly. A one-sentence answer to an “evaluate” question, even if correct, cannot reach the higher bands because it gives neither strengths and limitations nor a judgement.
Two more errors appear often in data questions: describing a graph without quoting any values, and giving numbers without units. Both are easy to fix with a final check of each answer.
Key points
The command term tells you the kind and depth of answer; the marks tell you roughly how many points to make.
AO1 terms (define, state, list, label, draw, measure) ask for precise knowledge without reasons.
AO2 terms (outline, describe, identify, calculate, distinguish, annotate, interpret, apply, estimate) ask you to use knowledge and data.
AO3 terms (explain, analyse, suggest, justify, compare and contrast, construct, evaluate, discuss, examine, to what extent) ask for reasoning and judgement.
Describe gives what happens, with values; explain adds why.
Distinguish wants differences only; compare and contrast wants similarities and differences, referring to both throughout.
Evaluate, discuss and to what extent all end in a supported judgement written in the words of the question.
Short questions are point-marked with a markscheme; the 9-mark essay parts are marked with markbands that reward examples, balance and a reasoned conclusion.
Carry on with ESS in Augment
With a free account, Augment remembers where you stopped in the notes and which questions you have marked.