Writing a commentary
Write an IA commentary step by step: diagram first, then terminology, application, the key concept and evaluation, within 800 words, with a complete model commentary marked against every criterion.
- IB Economics
- Internal assessment
- SL and HL
What a commentary is
A commentary is a short piece of economic analysis of one recent news article. In at most 800 words it explains what is happening in the article using economic theory and at least one diagram, views the issue through one of the nine key concepts, and judges the implications. It is the building block of the IA portfolio: each of your three commentaries is marked out of 14 on the same five criteria.
A commentary is not an essay on a topic. An essay on indirect taxes would explain the theory in general and use examples to illustrate it. A commentary starts from the event in the article and uses only the theory that explains that event. Every paragraph should be about the article’s market, the article’s people and the article’s numbers.
Nor is it a summary. The moderator has the article in front of them and does not need it retold. A sentence or two on what happened is enough; the rest of the 800 words should show what an economist sees in the event that a general reader would not.
Before you write: read the article as an economist
Most of the quality of a commentary is decided before the first sentence is written. Read the article at least twice, the second time with a pen, and annotate it with the questions economists ask of any event.
Question | What to mark in the article |
|---|---|
Which market or economy? | The good, service, factor or country, and the decision-makers involved (consumers, firms, workers, government, central bank, other countries). |
What changed? | A price, a quantity, a tax, a law, an interest rate, a tariff, a shock to supply or demand. |
Why did it change? | The cause the article gives, and any cause it hints at but does not name. |
What follows? | Effects on price, output, employment, incomes, the government budget, other countries. |
What numbers are given? | Prices, percentages, tax rates, growth rates, dates: these become evidence in your analysis. |
Who gains and who loses? | The stakeholders: these become the core of your evaluation. |
What is the debate? | Any disagreement, criticism or alternative the article mentions. |
Then decide on three things, in this order: the unit the article belongs to, which depends on the theory that best explains it; the diagram that shows the central change; and the key concept that frames the issue. Only once these three fit together is it worth starting to write.
Step 1: the diagram first
The diagram is the analytical centre of a commentary, and drawing it first organises everything else. Once the curves are on paper, it is clear which curve shifts, why it shifts, what happens to price and quantity, and which elasticities matter. The writing then explains the diagram rather than the other way round.
Choosing the diagram
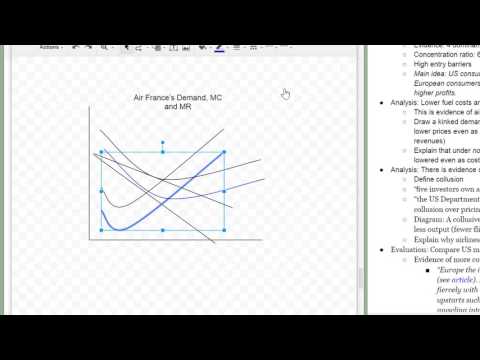
Choose the diagram that shows the main economic change in the article, from the unit the commentary is based on. One well-explained diagram can earn full marks under criterion A; a second is worth adding only when it shows something the first cannot, such as the effect on a related market or the long run.
Article about… | A diagram that usually fits |
|---|---|
A tax, subsidy, price ceiling or price floor | Market diagram with the intervention: S + tax, S − subsidy, Pmax or Pmin, with the areas that matter |
Pollution, congestion, health or education | Externality diagram: MSC, MPC, MSB, MPB, Q_m and Q_opt, the welfare loss |
A rise or fall in a commodity price | Demand and supply with the relevant shift; a second panel for elasticity if it explains the size of the change |
Inflation, recession or unemployment | AD/AS: a shift of AD or SRAS, the change in the average price level and real GDP |
An interest rate decision | AD/AS with AD shifting; the money market diagram (HL) if useful |
A tariff, quota or trade deal | Tariff or quota diagram: P_world, P_w + tariff, domestic and import quantities, revenue and welfare loss |
A currency moving | Exchange rate diagram: demand for and supply of the currency, with the shift that caused the move |
Drawing it well
A diagram earns marks only if it is your own, relevant, accurate and correctly labelled. A diagram copied from a website or from the article itself is not your work and shows no skill.
Title and context. A short title naming the market and the change (“US diesel market: effect of removing fuel taxes”). Headings of ten words or fewer do not count towards the 800.
Axes with the article’s market. “Price of diesel ($ per gallon)” and “Quantity of diesel (gallons)”, not just “P” and “Q”. For AD/AS diagrams, “Average price level” and “Real GDP”.
Curves labelled at their ends. D, S, S + tax, AD₁, AD₂, SRAS, LRAS: with subscripts for the original and new positions.
Equilibria marked on both axes, with dashed lines to P₁, Q₁ and P₂, Q₂.
Arrows showing the direction of every shift.
Areas shaded and labelled when the explanation uses them (tax revenue, welfare loss, consumer surplus).
Numbered (Figure 1) so the text can refer to it.
Hand-drawn diagrams scanned or photographed clearly are acceptable, as are diagrams drawn on a computer. Neatness matters less than accuracy: a parallel shift for a specific tax, a pivot for an ad valorem tax, a welfare loss triangle pointing towards the socially optimal quantity.
Explaining it fully
A full explanation answers four questions in the article’s context. What is the starting position? What changes, and why, as the article reports it? How does the curve move, and what are the new equilibrium price and quantity? What determines the size of the change, such as the elasticity of the curve that does not shift? The model commentary’s second and third paragraphs follow exactly this order.
Step 2: terminology
Criterion B is worth 2 marks and rewards economic terms relevant to the article used appropriately throughout. The key word is “throughout”: precise vocabulary in every paragraph, not a list of definitions at the start.
Define only the terms that carry the analysis, and define them in the article’s context, briefly. Definitions count towards the 800 words and cannot go in footnotes, so a full textbook definition of every term wastes space that the evaluation needs.
Weak | Strong |
|---|---|
“The government lowered the tax so diesel got cheaper and more people bought it.” | “Removing a specific tax shifts supply down by the tax per gallon; because demand is price inelastic, the price falls by most of the tax and quantity demanded rises only slightly.” |
“Prices went up a lot because of the war.” | “The war reduced the supply of crude oil to refineries, shifting the supply of diesel to the left and raising its equilibrium price.” |
“The central bank is trying to stop prices rising.” | “The central bank raised its base rate to reduce aggregate demand and bring inflation back towards its target.” |
Step 3: application and analysis
Criterion C rewards relevant theory applied to the article throughout, with effective analysis. Application means using the article’s facts inside the theory: its prices, its policy, its firms, its numbers. Analysis means following the chain of cause and effect step by step, so that each link is explained rather than asserted.
A good test is whether each paragraph could have been written without the article. “A tax cut lowers the price” could be written about any tax. “A saving of about $0.60 offsets less than a quarter of the $2.60 rise in price” could only come from this article, and it moves the analysis forward by showing how small the effect is.
Using the article’s data
Numbers from the article make analysis specific. Use them to calculate something the article does not state: a percentage change, a share, a comparison. A short calculation does not count towards the 800 words, so it is an efficient way to add depth.
Quoting the article
Brief quotations show precisely what the article says and anchor the analysis in it. Quote a phrase or a sentence, never a paragraph: quotations count towards the word limit and earn nothing on their own. Paraphrase everything else, and cite the article when its information is used.
Step 4: the key concept as a lens
Criterion D rewards identifying one of the nine key concepts and fully explaining its link to the article. Each commentary in the portfolio must use a different concept, so the choice is made across all three at once.
The concept works best as a lens: the question through which the whole commentary looks at the event. Name it in the opening paragraph, explain why the article raises that question, and return to it in the analysis and the judgment. A sentence at the end saying “this article links to sustainability” earns 1 mark at most.
Key concept | The question it asks of an article |
|---|---|
Which limited resource is involved, and how does its scarcity shape the outcome? | |
Which decision is being made, by whom, and what is its opportunity cost? | |
Are resources allocated to their most valued use, or is there waste or a welfare loss? | |
Is the outcome fair, and who gains or loses in income, wealth or opportunity? | |
How are people’s living standards, security and quality of life affected? | |
Can the activity continue without harming future generations or the environment? | |
What has changed (technology, institutions, structure, behaviour), and how are markets adjusting? | |
How do decisions in one market, sector or country affect others? | |
Why did the government or central bank act, and does its action achieve its aim? |
Most articles could be read through several concepts. The diesel article could be analysed for equity (who can buy dyed diesel), sustainability (cheaper fuel and emissions) or intervention (whether lowering a tax is an effective response to a supply shortage). Choose the concept that the article’s main issue is really about, and that has not been used in another commentary.
Step 5: evaluation
Criterion E rewards judgments supported by effective and balanced reasoning. Evaluation in a commentary is not a list of “however” points: it weighs the implications of the article’s event and reaches a conclusion that follows from the analysis.
The same tools serve evaluation in every unit. Applied to the article’s case, each one produces a specific, supported point.
Tool | Question to ask | Example from the diesel article |
|---|---|---|
Stakeholders | Who gains, who loses, and by how much? | Rural farmers gain; urban truckers gain little; governments lose revenue. |
Short run and long run | Does the effect last or reverse? | The order ends with the year; supply recovers only when the wars end. |
Assumptions | Does the theory’s assumption hold here? | Figure 1 draws supply as fairly elastic, but refining is stretched, so sellers may keep part of the cut. |
Magnitude | How big is the effect, compared with what? | $0.60 against a $2.60 rise: less than a quarter. |
Elasticity | How do PED and PES change the result? | Inelastic demand: price falls by most of the tax, quantity barely rises. |
Alternatives | Would another policy work better? | Releasing stocks or paying farmers directly. |
Unintended consequences | What else happens? | Harder enforcement against tax evasion; slightly more emissions. |
The judgment at the end should answer the question the key concept posed, with a reason. “The policy has advantages and disadvantages” is not a judgment. “Removing the tax is unlikely to lower the average price much, because dyed diesel is hard to obtain and supply is inelastic; a targeted payment would be fairer” is.
Structure and word budget
There is no required structure, but most strong commentaries move in the same order: the event and the concept, the diagram and its explanation, further analysis, the concept developed, evaluation, and a judgment. Short subheadings can help a moderator follow the argument, but they count towards the word limit if they are not diagram headings.
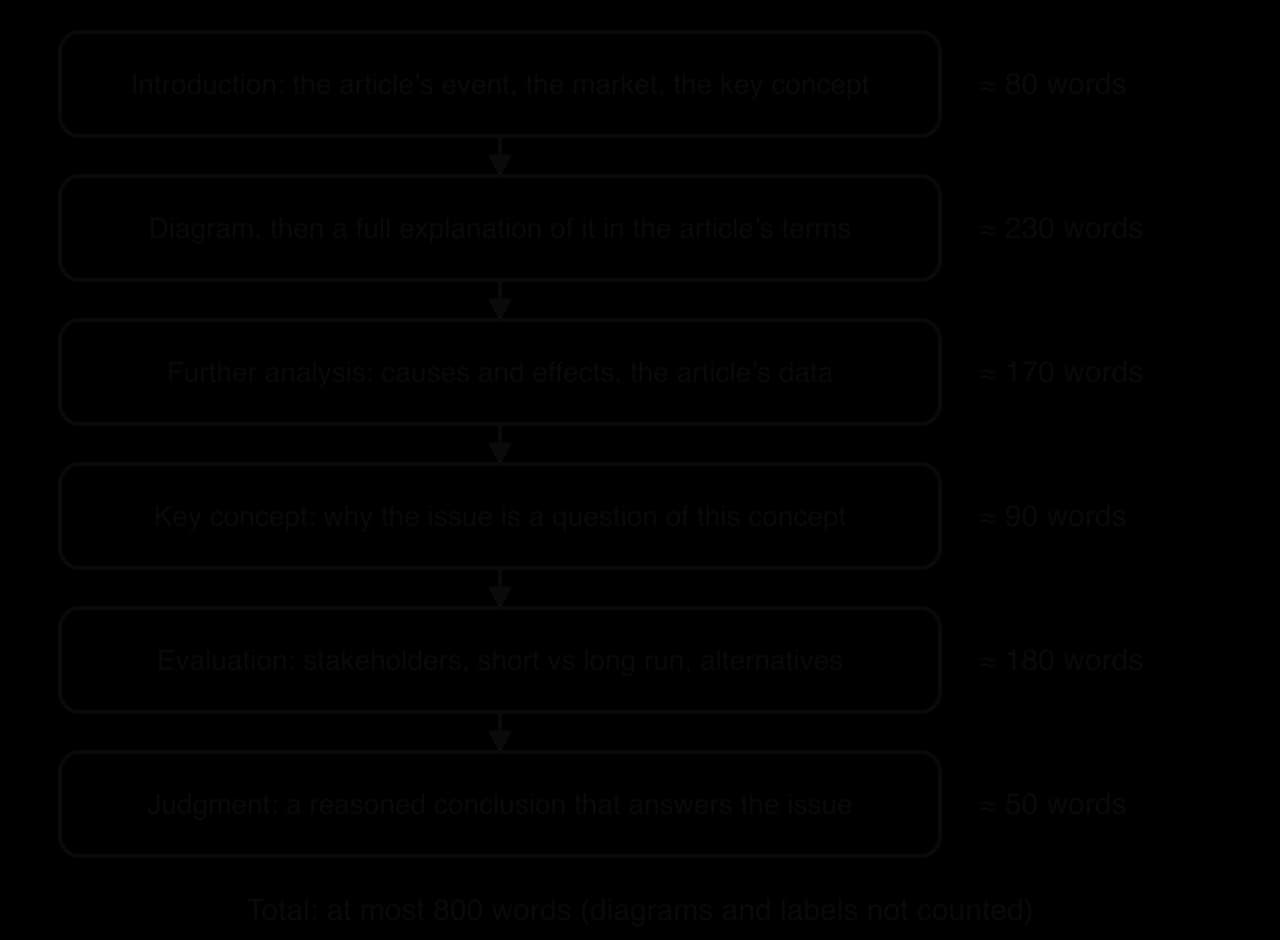
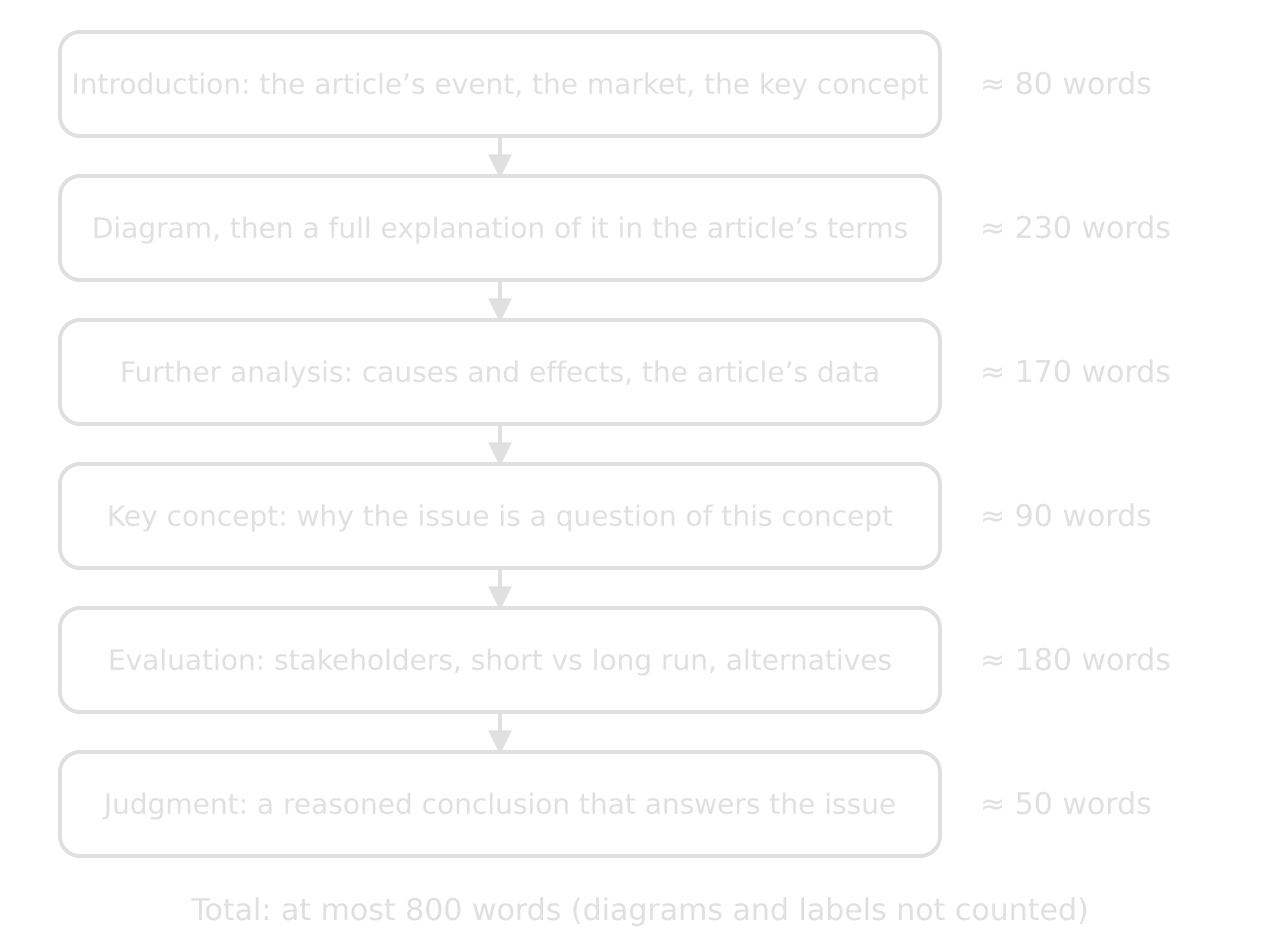
The budget is a planning aid, and it can be adjusted to the article. An article with a simple mechanism and many stakeholders needs more evaluation; an article about a complicated policy needs more analysis. What matters is that no part is squeezed to nothing, and the most common casualty is the evaluation.
What counts towards the 800 words
Counted | Not counted |
|---|---|
All the body text, including the introduction and the judgment | Diagrams, and labels of five words or fewer |
Definitions of economic terms (they must be in the body) | Diagram headings of ten words or fewer |
Quotations from the article (also in the body) | Tables of statistical data |
Subheadings in the text | Equations, formulae and calculations |
Long labels and long diagram titles | Citations in the body, references in footnotes or endnotes |
Moderators stop reading at 800 words, so anything after that point earns nothing, including the judgment that usually comes last. Footnotes and endnotes may hold references only; putting explanation or definitions there to save words is against the rules.
Cutting to 800 words
First drafts are often 1,000 words or more. Cut in this order: summary of the article; general theory that is not applied to the article; repeated points; long definitions of terms the analysis makes clear; filler phrases. Never cut the diagram explanation or the judgment.
First draft (41 words) | Edited (19 words) |
|---|---|
“It is clear from the article that the government has decided to make a change to the rules, which means that diesel users will now be able to buy diesel that does not have the federal tax included in its price.” | “The order exempts more diesel users from the federal tax of 24.4 cents a gallon until the end of 2026.” |
 YouTube
A model commentary
The commentary that follows is written to the current rules on a real article published within twelve months of writing. It is a Unit 2 (microeconomics) commentary using the key concept of intervention. It shows one way of reaching the top of each criterion, not the only way; your own commentaries must be on articles you choose yourself.
Cover information
Item | Entry |
|---|---|
Title of the article | “Why Trump just loosened the rules on ‘dyed diesel’” |
Source | NPR (npr.org), by Willa Rubin; accessed 14 October 2026 |
Date the article was published | 7 October 2026 |
Date the commentary was written | 14 October 2026 |
Word count | 796 (including the title; the figure, its heading and labels, and the reference are not counted) |
Unit | Unit 2: Microeconomics |
Key concept | Intervention |
Commentary: removing fuel taxes to lower US diesel prices
The article reports that, until the end of 2026, the US government will allow red-dyed diesel to be used on public roads. Dyed diesel is chemically almost identical to ordinary diesel but is exempt from the federal fuel tax of 24.4 cents a gallon because it is meant for off-road machinery. Diesel prices have risen sharply since the war in Iran and attacks on Russian refineries cut supply; the US average is about $2.60 a gallon higher than a year earlier. Through the key concept of intervention, this commentary examines whether removing a tax is an effective way to lower the price diesel users pay.
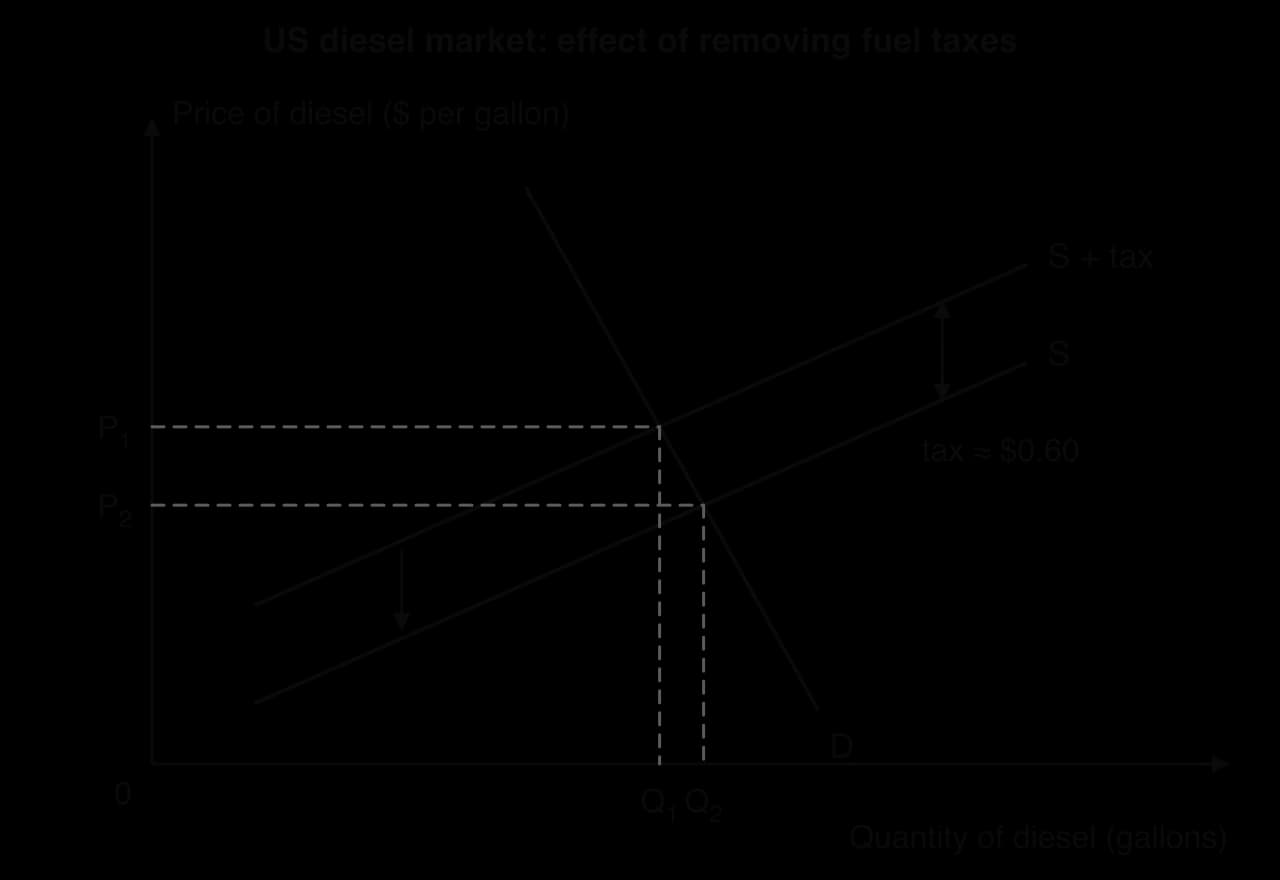
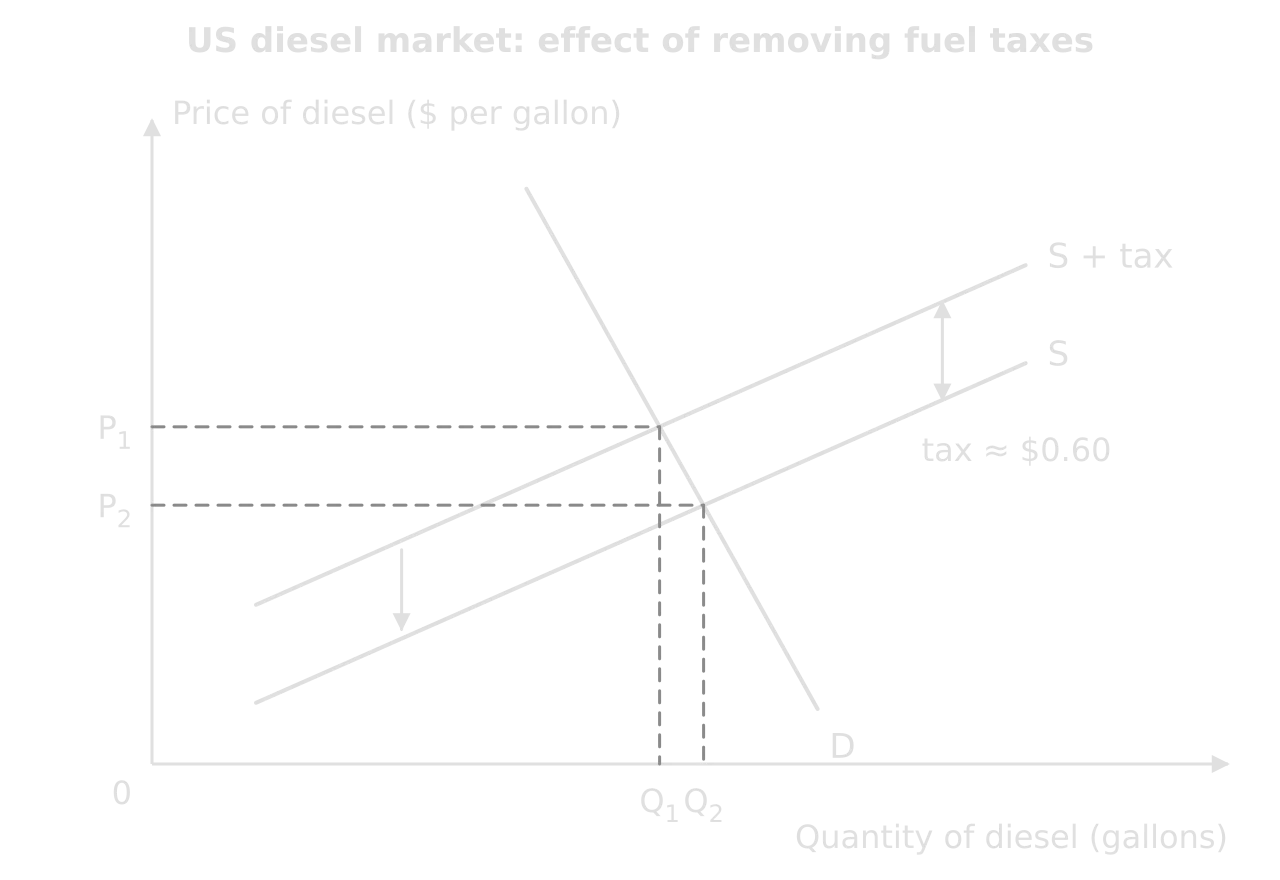
Federal and state fuel taxes are specific indirect taxes: a fixed amount of money per gallon. A specific tax raises sellers’ costs by the same amount at every level of output, so it shifts the supply curve vertically upwards by the amount of the tax. In Figure 1, S + tax is the supply of diesel with the taxes and S is the supply without them. Where states also waive their own taxes, the article estimates that users “could add up to a savings of about 60 cents a gallon”, so the vertical distance between the curves is about $0.60.
When users can switch to untaxed dyed diesel, supply shifts down from S + tax to S. The price paid falls from P1 to P2 and the quantity bought rises from Q1 to Q2. The size of both changes depends on price elasticity of demand (PED). Demand for diesel is price inelastic in the short run: trucks, tractors and generators have no substitute fuel, and deliveries and harvests cannot wait. The demand curve is therefore steep, so the price falls by most of the tax while the quantity rises only slightly. Because the incidence of the tax was mainly on consumers, they receive most of the benefit of its removal.
Diesel is an input for farms and haulage firms, so a lower price reduces their costs of production, easing the pressure on food and transport prices that the article links to diesel. However, the article explains that dyed diesel is not sold at most filling stations and is mainly available from specialist wholesalers or rural outlets. The shift in Figure 1 therefore applies to a small part of the market: farmers near those suppliers rather than most truck drivers. Even for them, a saving of about $0.60 offsets less than a quarter of the $2.60 rise in price.
Intervention is the central issue because the price rise is the price mechanism at work. A higher price signals that diesel is scarce and rations it to the users who value it most. By lowering the price paid, the government weakens that signal: at P2 users demand more diesel at a time when there is less of it. Since refining capacity is stretched by the global shortage the article describes, supply is also likely to be price inelastic (low PES) in the short run. With inelastic supply, sellers keep part of the tax cut as a higher pre-tax price, so the intervention may help refiners and wholesalers more than Figure 1 suggests.
The main gainers are farmers and rural hauliers who can buy dyed diesel. Urban truck drivers gain little, so the benefit is uneven. Governments lose fuel-tax revenue, which pays for highway maintenance. Suspending the penalty also removes the purpose of the red dye, which exists to detect tax evasion, and may make enforcement harder once the order ends. A lower price also encourages slightly more burning of diesel, adding to negative externalities such as air pollution and carbon emissions, although the effect is small because demand is inelastic.
Other interventions address the problem more directly. Releasing fuel from strategic stocks, as Europe has done, shifts supply itself to the right, adding fuel to a market that is short of it. Direct payments to farmers and hauliers would support their incomes without lowering the market price, so the signal to save fuel would remain. Both cost money and take time to arrange, whereas the order took effect at once.
The order is likely to lower diesel costs for a small group of users quickly and cheaply, but it does not address the cause of high prices, which is a fall in supply. Because dyed diesel is hard to obtain and both demand and supply are inelastic in the short run, the effect on the average price paid will probably be small and temporary. As one analyst in the article puts it, “There’s no silver bullet.” A targeted payment would be a fairer intervention that keeps the price signal; removing the tax mainly offers visible relief to a few users weeks before the midterm elections.
Reference: Rubin, W. (2026), “Why Trump just loosened the rules on ‘dyed diesel’”, NPR, 7 October. Accessed 14 October 2026.
Sources: NPR, “Why Trump just loosened the rules on ‘dyed diesel’” (7 October 2026).
The model commentary marked
Each criterion is applied to the commentary on its own, using best fit: the mark whose description matches the work most closely. The annotations show where each mark is earned and what would have lost it.
Criterion | Mark | Where it is earned |
|---|---|---|
A Diagrams | 3 / 3 | Paragraphs 2–3 and Figure 1 |
B Terminology | 2 / 2 | Every paragraph |
C Application and analysis | 3 / 3 | Paragraphs 3–5 |
D Key concept | 3 / 3 | Paragraphs 1, 5, 7 and 8 |
E Evaluation | 3 / 3 | Paragraphs 5–8 |
Total | 14 / 14 |
Criterion A: Diagrams (3 / 3)
Figure 1 is relevant (it shows the policy in the article), accurate (a specific tax as a parallel vertical shift, with the price falling by less than the tax) and correctly labelled in the article’s market, with a title, units, both equilibria and an arrow. The explanation is full: paragraph 2 says why the curve moves and by how much, using the article’s figure; paragraph 3 traces the change from P1, Q1 to P2, Q2 and explains its size through PED.
The commentary would drop to 2 if it stopped after “the price falls from P1 to P2”, with no reason for the size of the fall. It would drop to 1 if the diagram were inaccurate (for example, demand shifted instead of supply, or the tax drawn as a pivot), or if the text never referred to the labels.
Criterion B: Terminology (2 / 2)
Terms are relevant and used accurately throughout: specific indirect tax, supply, price elasticity of demand, tax incidence, costs of production, the price mechanism with its signalling and rationing functions, price elasticity of supply, tax revenue and negative externalities. Only one term, the specific tax, is defined, briefly and in context, because the analysis depends on it.
Criterion C: Application and analysis (3 / 3)
Theory is applied to the article in every paragraph, and the analysis is effective: each claim is explained with a reason. Paragraph 3 explains why demand is inelastic with the article’s users (trucks, tractors, harvests). Paragraph 4 uses the article’s detail on where dyed diesel is sold to show that the shift applies to only part of the market, and its data to calculate how small the saving is. Paragraph 5 extends the analysis to the incidence of the tax under inelastic supply.
Criterion D: Key concept (3 / 3)
Intervention is named in the first paragraph as the question the commentary asks: whether removing a tax is an effective way to lower the price users pay. Paragraph 5 explains why the issue is about intervention, contrasting the government’s action with the price mechanism’s signalling and rationing. Paragraph 7 compares other interventions, and the judgment answers the question in terms of intervention. The link is fully explained, not attempted or partial.
Criterion E: Evaluation (3 / 3)
Judgments are supported by effective and balanced reasoning. The commentary weighs gainers and losers, questions the diagram’s assumption about supply, considers the short run and the order’s end date, notes unintended consequences, compares alternatives with their own costs, and gives the policy credit for being quick and cheap. The final judgment follows from these points and is specific: a small, temporary effect for a few users, and a targeted payment as a fairer alternative.
The commentary would fall to 2 if it listed the same points without weighing them, or to 1 if it ended with “the policy has both advantages and disadvantages”.
Commentaries on the other two units
The same five steps work for the macroeconomics and global economy commentaries, with different diagrams and evaluation tools.
Unit 3: Macroeconomics | Unit 4: The global economy | |
|---|---|---|
Typical article | A central bank rate decision; new inflation, unemployment or GDP figures; a budget | A tariff or trade deal; a currency movement; a trade surplus or deficit; aid or development |
Typical diagram | AD/AS with a shift of AD or SRAS; business cycle; Phillips curve (HL) | Tariff or quota diagram; exchange rate diagram; current account and J-curve (HL) |
Evaluation tools | Time lags, the size of the output gap, confidence, the other macro objectives, Keynesian vs monetarist/new classical views | Stakeholders in both countries, retaliation, elasticity of export and import demand, the long run, development effects |
Concepts that often fit | Change, economic well-being, intervention, equity | Interdependence, sustainability, equity, efficiency |
Sources: CNBC, “India’s retail inflation jumps to 5.54% in September, above estimates” (12 October 2026).
Summary
A commentary analyses one recent article with theory, a diagram and one key concept in at most 800 words; it is neither an essay nor a summary.
Read the article as an economist first, then fix the unit, the diagram and the key concept before writing.
Draw the diagram first, label it in the article’s market, and explain every movement with its reason.
Use terminology precisely throughout, and define only the terms the analysis depends on.
Apply theory to the article’s facts and numbers in every paragraph; a short calculation adds depth without adding words.
Use the key concept as a lens from the first paragraph to the judgment.
Evaluate the article’s case with stakeholders, time, assumptions, magnitude and alternatives, and end with a specific, supported judgment.
Self-check
- To do:
I can explain how a commentary differs from an essay and from a summary.
- To do:
I can choose, draw and fully explain a diagram in the article’s context.
- To do:
I can apply theory to an article’s facts and numbers throughout a commentary.
- To do:
I can use a key concept as a lens from the opening to the judgment.
- To do:
I can evaluate an article’s case and reach a specific, supported judgment.
- To do:
I can keep a commentary within 800 words without cutting the analysis.
Carry on with Economics in Augment
With a free account, Augment remembers where you stopped in the notes and which questions you have marked.