Paper 3: policy paper
Know how the HL policy paper is built and marked, answer its calculations and short items, and write a 10-mark policy recommendation that uses the data, with a full model answer to a practice question.
- IB Economics
- Exam skills
- HL only
Paper 3 is the HL policy paper. It gives a data-rich case about a country, asks a series of short calculation and explanation items about it, and ends each question with a recommendation: which policy should the government use, and why. It is the only paper that asks for a policy recommendation, and the only one where HL calculations dominate.
The paper rewards two skills that are rarely practised together: accurate, quick quantitative work, and a short, reasoned argument that uses the numbers just calculated. Students who revise only theory often lose marks on the calculations, while students who revise only calculations lose them on the recommendation.
How the paper is built
There are two compulsory questions, each worth 30 marks, and no choice. Each question opens with a case: several short texts about a real or invented country, with tables, charts and sometimes a diagram. The questions can draw on any part of the course, including HL-only material, and a single question usually mixes units: a market for one good, a macroeconomic problem and a trade or development issue in the same country.
Part | Marks | What it asks | |
|---|---|---|---|
(a) | 20, in several subparts of 1–4 marks | Definitions, calculations, diagrams and short explanations based on the case | AO1, AO2, AO4 |
(b) | 10 | A recommended policy for a stated aim, using the case and economic theory | AO1, AO2, AO3, AO4 |
A calculator is needed: many subparts of part (a) are calculations, and every one can be done on a basic calculator. Answers are written in an answer booklet. Part (a) is marked with an analytic markscheme (a mark for each point or step), part (b) with markbands that judge the answer as a whole.
 YouTube
Part (a): calculations and short items
What part (a) asks
Part (a) is a sequence of short tasks, each tied to the case. The tasks usually follow the order of the texts, so the first items use the first text and table. Typical items and their usual weight are listed in the table.
Type of item | Typical marks | What earns the marks |
|---|---|---|
Define a term in the text | 2 | A precise definition with the key qualifiers; 1 mark for a vague or partial one. |
Calculate | 1–3 | Working (formula and substitution) and the correct answer with its unit. |
Draw or label a diagram | 2–4 | Correct axes and curves, the shift or area asked for, values from the case marked on the axes. |
Explain, using the data | 2–4 | A clear chain of reasoning linked to the specific figures or facts in the case. |
Comment on a result | 1–2 | A short judgment about what the calculated number means. |
The calculations come from every unit, but HL ones appear most often: surplus, tax, subsidy and welfare loss areas; cost and revenue tables; the multiplier; tax rates and Lorenz curves; opportunity cost and comparative advantage; tariffs and quotas. SL calculations (elasticities, real GDP, inflation, exchange rates, the balance of payments) appear too.
How part (a) is marked
Each subpart has its own small markscheme. In a 2-mark calculation, 1 mark is usually for valid working and 1 for the correct answer with its unit. Later items often use earlier answers, and markschemes typically follow your own figures: if (a)(iii) uses a wrong answer from (a)(ii) correctly, it can still earn full marks. That protection depends on the working being visible. Each HL and SL calculation is worked through in Quantitative skills and calculations.
Definitions are marked like those in Paper 2: precise wording earns 2 marks, a vague or incomplete version 1. “Explain” items need reasons, not a restatement of the data. An item worth 3 marks usually expects three linked steps, such as the change in the case, the mechanism, and the effect on the variable asked about.
Diagrams in part (a)
Diagram items in part (a) ask for a specific diagram for the case: a tax on this good, a tariff on this import, a deflationary gap in this economy. A fully explained diagram in part (a) means correct labels on both axes, every curve labelled, the shift shown with an arrow, and the equilibrium values from the case written on the axes where the data give them. An unlabelled or generic diagram rarely earns more than half the marks.
Part (b): the policy recommendation
What “recommend” demands
“Recommend” is an AO3 command term: propose an advisable course of action for the situation given, backed by evidence and reasons. The question names an aim, such as reducing air pollution, inequality or a current account deficit, and asks for one policy that the government of the country in the case could introduce to achieve it. The answer is a judgment about that country, not a general survey of policies.
A recommendation has to answer three questions: what the policy is, why it would achieve the aim (theory, often with a diagram), and why it is advisable for this country in particular (evidence from the case, weighed against costs, risks and alternatives). The final judgment states whether, and in what form, the government should use the policy.
How part (b) is marked
Part (b) is marked with five markbands (1–2, 3–4, 5–6, 7–8 and 9–10 marks). The examiner reads the whole answer and places it in the band that fits best along five strands. The table describes each strand at the bottom and at the top, in plain words.
Strand | Low bands | Top band (9–10) |
|---|---|---|
The policy | Named only | Identified, appropriate for the aim and fully explained |
Supporting theory | Absent or superficial | Used effectively to show how the policy achieves the aim |
Terminology | Irrelevant or rare | Appropriate throughout |
Use of the text and data | Not used, or copied without purpose | Relevant figures used to support the analysis and the evaluation |
Synthesis and evaluation | None or superficial | Effective and balanced, ending in a supported judgment |
Two features separate a 9–10 answer from a 7–8 one. The top answer uses the case’s numbers as evidence (“demand is price inelastic, with a PED of −0.8, so…”), often including figures calculated in part (a). And its evaluation weighs the points against each other to reach a balanced judgment, instead of listing advantages and disadvantages side by side.
A structure for part (b)
A reliable structure takes about 500–700 words and fits in 20–25 minutes.
Recommendation. One sentence naming the policy and the aim, with any key detail (the rate, the target group, the timing).
Context. Two or three sentences on the problem in the case, using its figures, so the reader sees why the aim matters.
Mechanism. How the policy works, step by step, using theory and terms. Refer to a diagram, either a new one or one already drawn in part (a).
Evidence from the case. The data that suggest it will work here: elasticities, the multiplier, the government’s budget, the people affected.
Evaluation. Costs, risks and limits, each weighed: which stakeholders lose, time lags, effects on other objectives, how the data could be misleading, and one alternative policy and why it is less suitable.
Judgment. A conclusion that confirms the recommendation, states the conditions under which it works best, and says what would make it fail.
 YouTube
Choosing the policy
The best policy is usually the one the case gives the most evidence about. If the texts discuss a tax, report its revenue and give an elasticity, the case is set up for an answer about that tax. Choose a policy that addresses the stated aim directly, that the government named in the question controls (a central bank, not the government, sets interest rates), and that can be evaluated with the data given.
Timing
With two questions of 30 marks each, the paper divides into two equal halves after the reading time. A plan that works for most students is set out in the table.
Stage | Time per question | What to do |
|---|---|---|
Reading the case | 5–7 minutes | Read the question parts first, then the texts; underline figures you will need and the aim in part (b). |
Part (a) | 20–25 minutes | Work through the subparts in order; about one minute per mark; move on from any item that stalls. |
Part (b) | 20–25 minutes | Plan for two minutes (policy, mechanism, three evaluation points, judgment), then write. |
A practice question
The case is hypothetical: the country, its currency (the Valdorian dollar, V$) and all figures are invented for practice. It is built the way a Paper 3 question is built, with texts, a diagram and two tables, and its parts mix microeconomics, macroeconomics and the global economy.
Text A: Air pollution in Ostra
Valdoria is a middle-income country of 18 million people. Its capital, Ostra, has some of the worst air quality in the region: the average level of fine particles is nearly ten times the level the national health ministry considers safe, and road transport is estimated to cause 45% of it. Hospital admissions for asthma in Ostra have doubled in a decade.
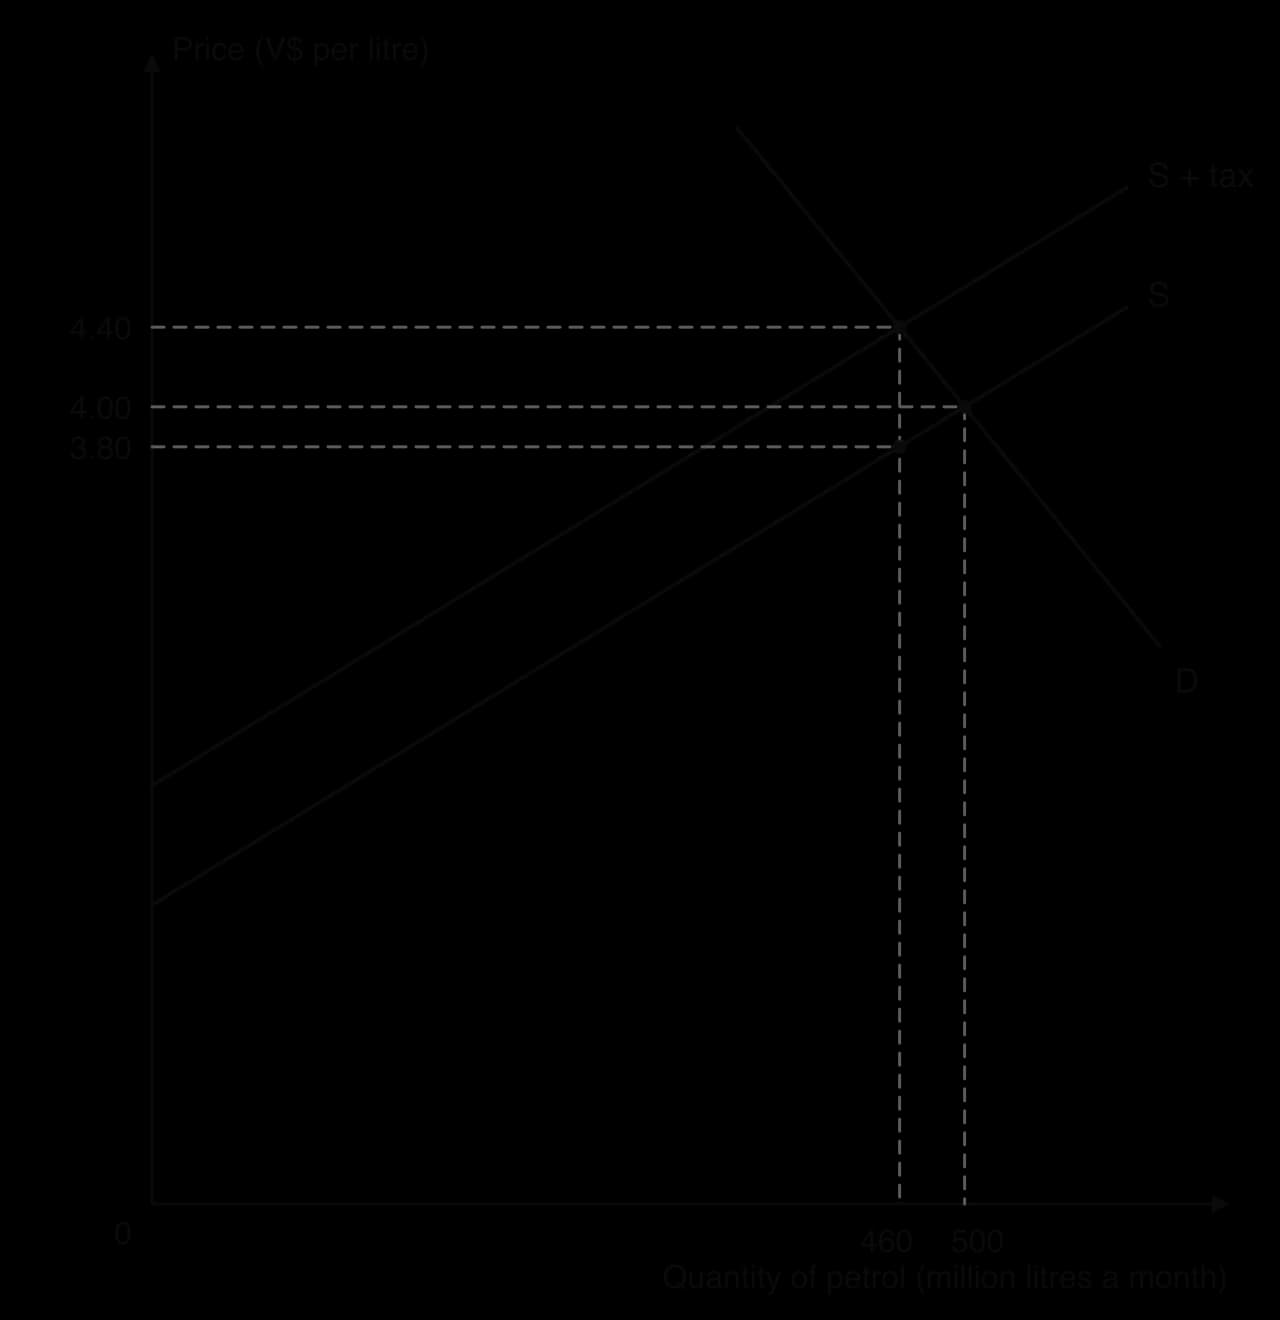
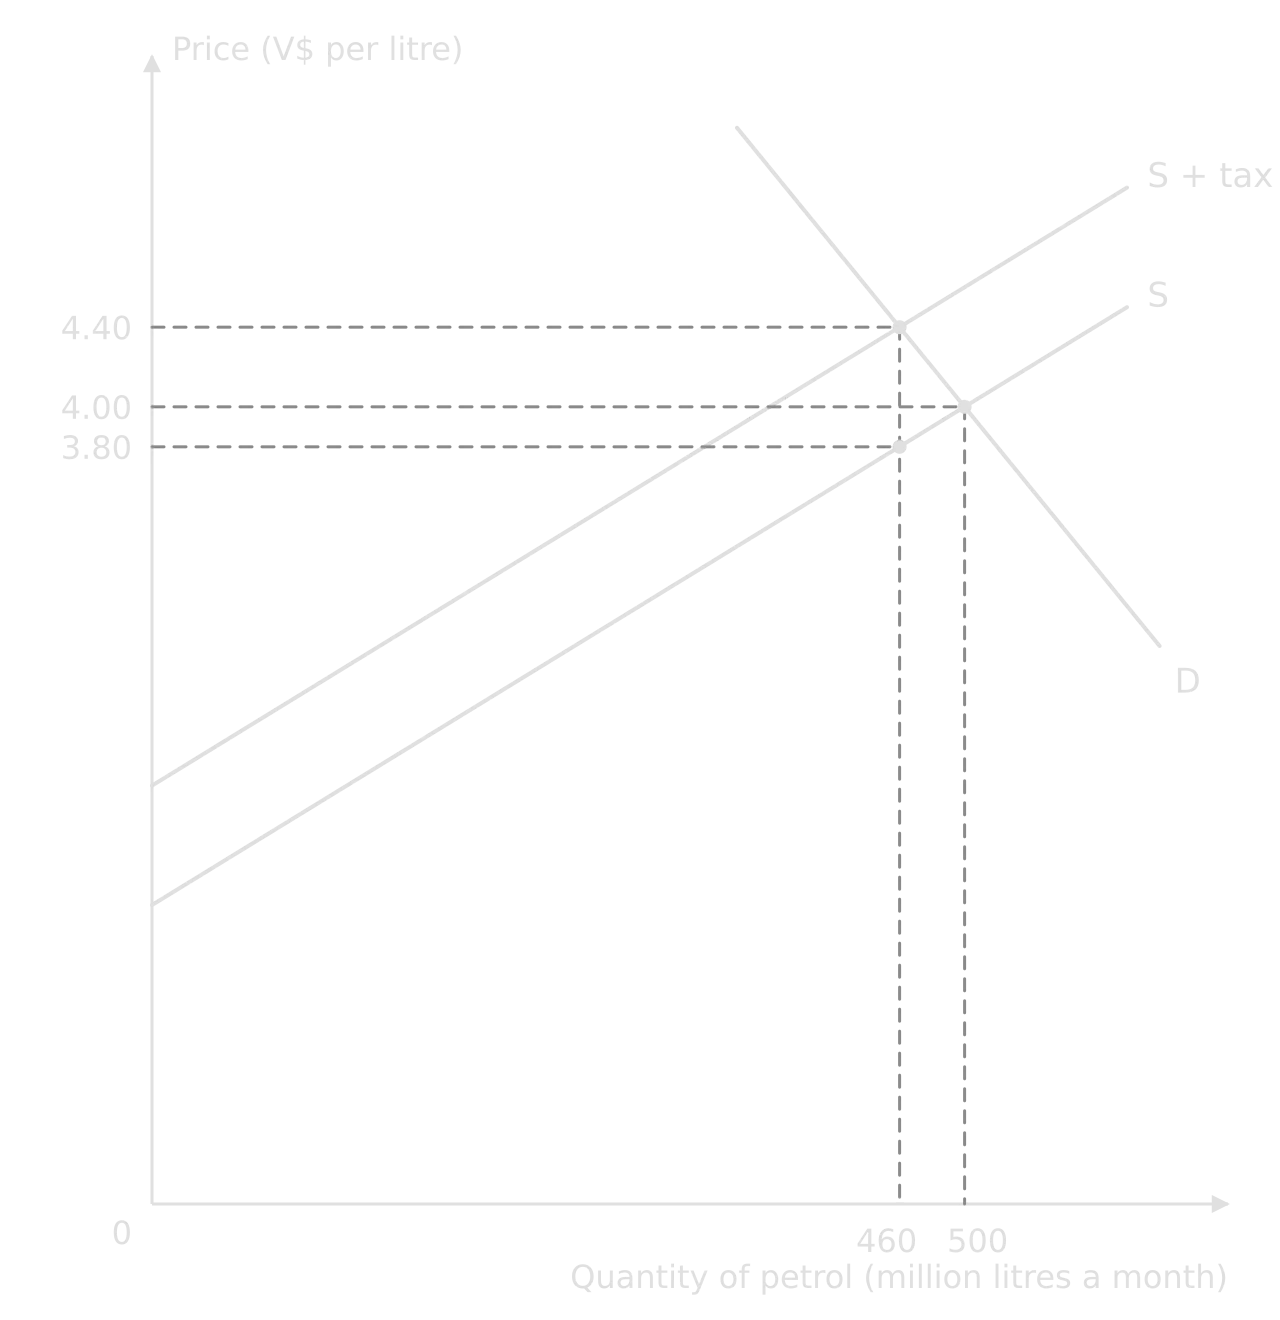
Most of the pollution comes from private cars and an ageing fleet of diesel buses. A government study estimates that each litre of petrol burned in Ostra imposes external costs of about V$0.90 on other people, through ill health and lost working days. Last year the government introduced a tax of V$0.60 per litre of petrol. Figure 1 shows its effect on the national petrol market.
Text B: The government’s options
The government is considering several further measures: raising the petrol tax, a charge on cars entering central Ostra, building a new metro line at a cost of V$6 billion, and replacing 200 diesel buses with electric buses, which are imported from the eurozone at €250 000 each. The exchange rate is V$1 = €0.20.
Public finances are under pressure: the budget deficit is 4.2% of GDP and government debt is 68% of GDP. Petrol in the neighbouring country is already cheaper than in Valdoria, and drivers near the border cross it to fill up. Car ownership is much lower among poorer households, who rely on buses (Table 2).
Table 1: Valdoria, selected data (latest year) | Value |
|---|---|
Real GDP growth | 1.8% |
Unemployment rate | 7.9% |
Inflation rate | 3.1% |
Budget deficit | 4.2% of GDP |
Government debt | 68% of GDP |
Marginal propensity to save (MPS) | 0.15 |
Marginal propensity to tax (MPT) | 0.20 |
Marginal propensity to import (MPM) | 0.25 |
Table 2 gives data on households by income quintile.
Table 2: Households by income quintile | Average monthly income (V$) | Petrol bought (litres a month) | Households owning a car | Commuters who use buses |
|---|---|---|---|---|
Quintile 1 (poorest) | 800 | 10 | 12% | 64% |
Quintile 2 | 1 500 | 25 | 30% | 48% |
Quintile 3 | 2 400 | 40 | 52% | 31% |
Quintile 4 | 3 600 | 55 | 70% | 17% |
Quintile 5 (richest) | 6 000 | 70 | 85% | 6% |
The questions
(a)
(i) Define the term negative externality. [2]
(ii) Using Figure 1, calculate the government’s monthly revenue from the petrol tax. [2]
(iii) Calculate the share of the tax revenue paid by consumers. [2]
(iv) Calculate the change in consumers’ monthly spending on petrol caused by the tax. [2]
(v) Using Figure 1, calculate the price elasticity of demand for petrol, and comment on your answer. [2]
(vi) Using Table 2 and Figure 1, calculate the petrol tax paid each month as a percentage of income by a household in quintile 1 and in quintile 5, and comment on whether the tax is progressive or regressive. [3]
(vii) Using Text A, draw a diagram to show the externality from petrol use in Ostra and the effect of the V$0.60 tax. [3]
(viii) Using Table 1, calculate the value of the Keynesian multiplier and the change in real GDP that would result from building the metro line. [3]
(ix) Calculate the price in V$ of one electric bus. [1]
(b) Using the information provided and your knowledge of economics, recommend a policy that the government of Valdoria could introduce to reduce air pollution in Ostra. [10]
Model answer: part (a)
Each answer shows what would earn full marks, followed by a commentary on how the marks are typically awarded.
(a)(i) Defining the term
(a)(ii) Tax revenue
(a)(iii) Consumers’ share of the tax
(a)(iv) Change in consumer spending
(a)(v) Price elasticity of demand
(a)(vi) Who pays the tax
(a)(vii) The externality diagram
(a)(viii) The multiplier
(a)(ix) Converting a price
Model answer: part (b)
The model answer recommends one policy and uses the figures from part (a) as evidence. It is about 650 words, the length that can be written well in 20–25 minutes.
The commentary that follows explains how the answer meets each markband strand, and what a weaker answer to the same question would look like.
Strand | How the model answer meets it |
|---|---|
The policy | One policy, stated in the first sentence with its rate (V$0.90) and timing, appropriate to the aim, and explained with the externality theory. |
Theory | MPB, MSB and MPC, the welfare loss, the Pigouvian tax and PED are used to show how the policy works and how far it goes. |
Terminology | Precise terms throughout: negative externality of consumption, socially optimal output, price inelastic, regressive, multiplier. |
Text and data | Uses the external cost, the PED and revenue from part (a), Table 2’s car ownership and bus use, the deficit, debt and inflation figures, and the border. |
Evaluation | Weighs short run against long run, the use of revenue, equity, the border, inflation, and two alternatives, then reaches a conditional judgment. |
A weaker answer to this question would define the externality, draw the diagram and state that a higher tax reduces consumption, then list “regressive”, “inelastic demand” and “smuggling” as disadvantages without figures, and end by suggesting several policies. Such an answer typically sits in the 5–6 band: relevant theory, some terminology, little use of the data and evaluation that is not balanced or weighed.
Common weaknesses
Most lost marks in Paper 3 come from a few habits, described with the fix for each.
In part (a)
No working. A wrong bare answer earns nothing; a wrong answer with a correct method usually earns the method mark.
Mixing total, average and marginal values. Marginal cost is the change in total cost divided by the change in output, not total cost divided by output.
Wrong quantity in revenue calculations. Tax revenue, subsidy cost and tariff revenue use the quantity after the policy.
Missing units and signs. V$ million, %, litres; a negative YED or current account balance keeps its minus sign.
Over-long answers to short items. A 2-mark “explain” needs two or three linked sentences, not a page.
Gaps in HL content. Cost and revenue curves, the multiplier and comparative advantage appear often; skipping them in revision costs marks.
In part (b)
No clear recommendation, or several policies offered without a choice.
Theory without the case. An answer that could be written about any country cannot reach the top bands; use the figures.
A policy that misses the aim, or one the government does not control.
Evaluation as a list. Weigh points: which matters most here, in the short run and in the long run, and for which stakeholders.
No time left. Part (b) is a third of each question’s marks; protect 20 minutes for it.
How to prepare
Practise the two parts separately before combining them. For part (a), work through calculation drills from every unit until each takes a minute or two, with working written every time. For part (b), take any case you have practised and write only the recommendation, timed at 20–25 minutes, using the structure of recommendation, context, mechanism, evidence, evaluation and judgment.
Then sit full questions under timed conditions: 50–52 minutes each, or the whole paper in one sitting. Mark them against the markband strands, checking in particular how many figures from the case the recommendation uses and whether the judgment is clear. Rewriting one weak part (b) after marking it teaches more than writing two new ones.
Summary
Paper 3 is HL only: two compulsory 30-mark questions on data-rich cases, each with a 20-mark part (a) and a 10-mark part (b).
Part (a) is mostly calculations, definitions, diagrams and short explanations, marked point by point; working and units protect the marks.
Part (b) asks for one recommended policy for a stated aim, marked with markbands on the policy, theory, terms, use of data and evaluation.
Top part (b) answers use the case’s figures, including results from part (a), as evidence and end with a clear, conditional judgment.
About half the time goes to each question, and about 20–25 minutes of each to part (b).
Self-check
- To do:
I can describe the structure of Paper 3 and how parts (a) and (b) are marked.
- To do:
I can answer part (a) calculations with working, units and a comment where asked.
- To do:
I can draw case-specific diagrams with values from the data on the axes.
- To do:
I can choose one policy that directly addresses the aim in part (b).
- To do:
I can use at least three figures from a case as evidence in a recommendation.
- To do:
I can evaluate a policy by weighing stakeholders, time frames, costs and an alternative, and reach a clear judgment.
- To do:
I can complete each question in about 50 minutes, with 20–25 minutes for part (b).
Carry on with Economics in Augment
With a free account, Augment remembers where you stopped in the notes and which questions you have marked.