Paper 2: data response
Work through every part of a Paper 2 question, from definitions and calculations to diagram questions and the 15-mark evaluation, using a practice extract on Nigeria’s 2023 reforms with model answers.
- IB Economics
- Exam skills
- SL and HL
Paper 2 is the data response paper, taken by both SL and HL students. Each question is a case study: a few short texts about a country or region, with tables and charts, followed by seven parts that move from definitions and calculations to diagrams and a final evaluation. It tests whether you can apply economic theory to a real situation and use evidence from a text to support an argument.
The paper rewards a different skill from Paper 1. In Paper 1 the evidence comes from your own knowledge; in Paper 2 it comes from the text and data in front of you. The best answers keep returning to the case: they label diagrams with the market in the text, quote its figures and use its stakeholders and policies in the evaluation.
 YouTube
How the paper is built
You answer one question from a choice of two. Each question draws on several units at once (a text about a currency crisis may need exchange rates, inflation and development), but it never uses HL-only material, so SL and HL students sit the same paper. Each question is worth 40 marks in total.
Part | Marks | What it usually asks | How it is marked |
|---|---|---|---|
(a)(i) and (a)(ii) | 2 + 2 | Define a term shown in bold in the text | Markscheme: 2 for a precise definition, 1 for a partial one |
(b), often split (i) and (ii) | 5 (2 + 3 or 3 + 2) | Calculations from the data: percentage changes, prices in another currency, rates | Markscheme: marks for working and for the correct answer with units |
(c), (d), (e), (f) | 4 each | “Using an appropriate diagram, explain…”, “Draw a diagram to show…”, “Explain two reasons…” | Markscheme: usually 2 for a correct, labelled diagram and 2 for an explanation linked to the text |
(g) | 15 | “Using information from the text/data and your knowledge of economics, evaluate / discuss / to what extent…” | Markbands, like Paper 1 (b), with use of the text in place of outside examples |
Reading the text and data
The five minutes of reading time and the first minutes of writing time decide how well the rest goes. Read both questions’ texts before choosing, then read the chosen one carefully with the questions beside it.
Read the questions first, all seven parts, so that you read the text knowing what to look for.
Choose the question whose (g) and diagram parts you can answer best, not the one on the more familiar country.
Annotate the text: underline the terms in bold, circle every figure and date, and mark each paragraph with the theory it relates to (“SRAS shock”, “PED low”, “depreciation”).
Note stakeholders and policies for (g): who gains, who loses, what the government did and what it could have done instead.
Check the data: units (%, US$ bn, ₦ per US$), the base year of any index, and whether figures are annual averages or end-of-period values.
A practice extract: Nigeria’s 2023 reforms
The extract that follows is written in the style of a Paper 2 text and is built from real data about Nigeria, simplified for practice. Its sources are given after the table, and every model answer on Paper 2 skills here refers to it.
Text A: ending the petrol subsidy
Nigeria is Africa’s largest oil producer, but for many years it imported most of the petrol it used, and the government kept the price at the pump low with a subsidy. In 2022 the subsidy cost the government about US$10 billion. On 29 May 2023, in his inaugural speech, President Bola Tinubu announced that the subsidy would end. Pump prices nearly tripled within weeks, and average daily petrol consumption fell from 66.9 million litres to 48.43 million litres in June 2023.
The government argued that the money saved could be spent on infrastructure, health and education. Critics pointed out that higher fuel prices raised the cost of transport and food, which take a large share of the budgets of low-income households.
Text B: floating the naira
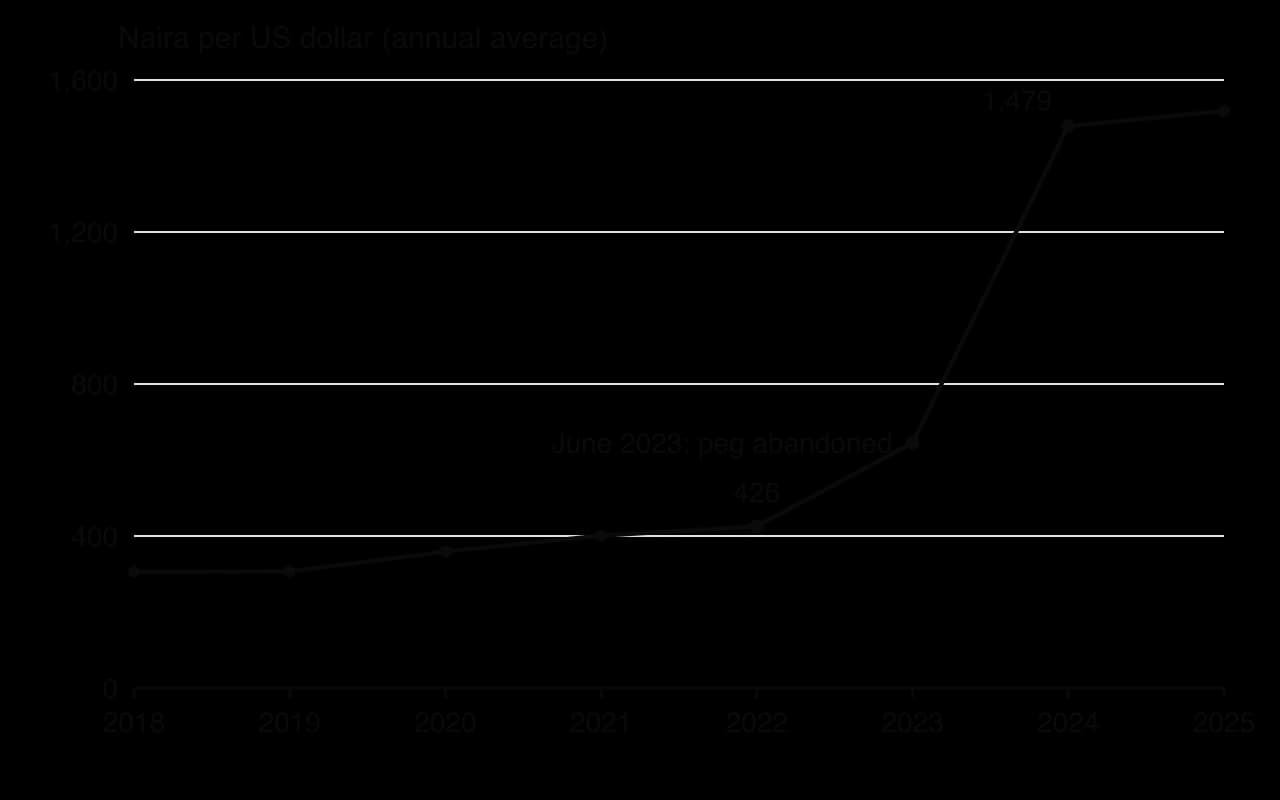
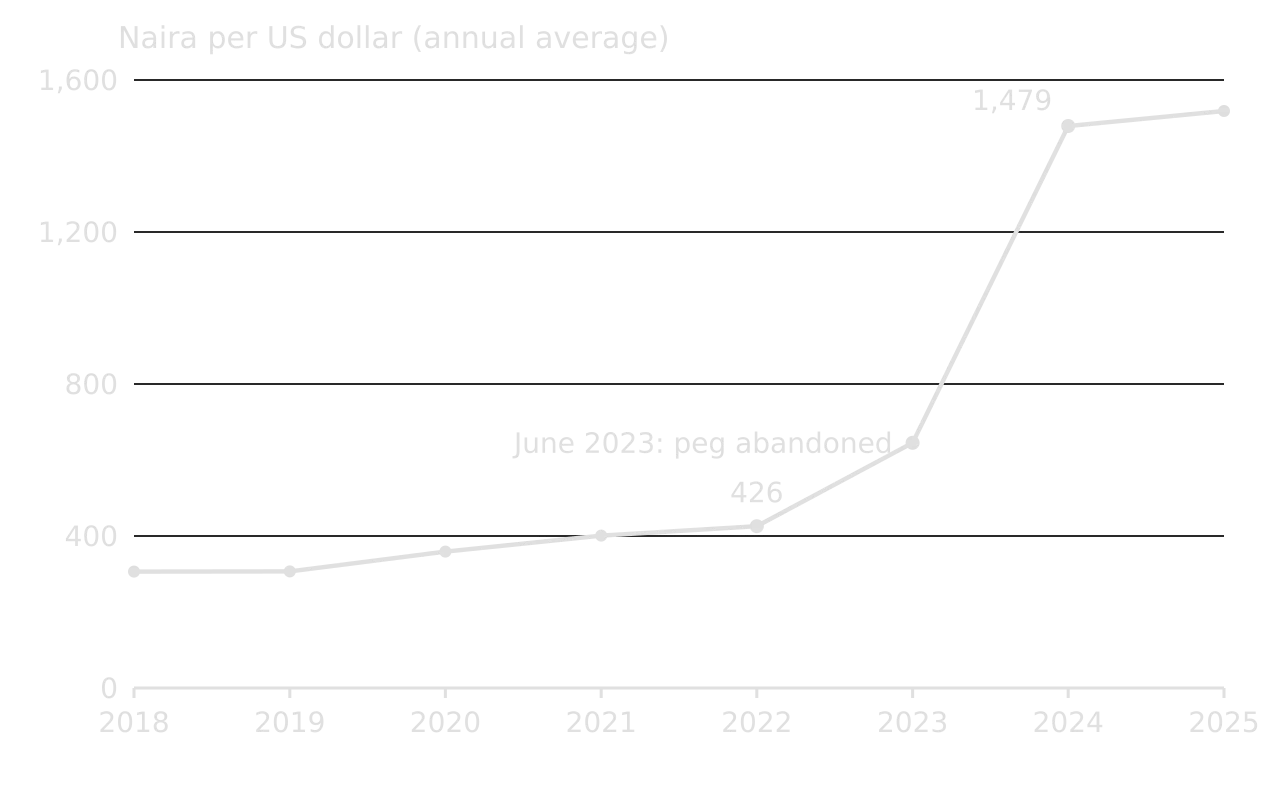
From 2017 the Central Bank of Nigeria (CBN) held the official exchange rate of the naira above its market level. Firms and households often could not buy dollars at the official rate, and a large parallel market grew. On 14 June 2023 the CBN removed its restrictions on foreign exchange trading, and the naira fell by 23% in a single day, to about ₦600 per US dollar.
The naira continued to depreciate. In the first week of February 2024 alone it fell from about ₦898 to ₦1,400 per US dollar. The average exchange rate in 2024 was more than three times its 2022 level (Table 1).
Text C: inflation, interest rates and the external accounts
Inflation rose from an average of 18.8% in 2022 to 33.2% in 2024. To bring it down, the CBN raised its monetary policy rate in steps, from 18.75% in July 2023 to 27.5% in November 2024; in October 2024 the annual inflation rate was 33.9%. Real GDP continued to grow, by 3.3% in 2023 and 4.1% in 2024.
Nigeria’s current account moved from a small surplus of 0.2% of GDP in 2022 to a surplus of 7.5% in 2024, and foreign exchange reserves, which had fallen to US$33.5 billion in 2023, recovered to US$40.4 billion in 2024.
Table 1: Nigeria, selected indicators | 2021 | 2022 | 2023 | 2024 |
|---|---|---|---|---|
Exchange rate (₦ per US$, annual average) | 401.2 | 426.0 | 645.2 | 1,479.0 |
Inflation rate (consumer prices, annual average, %) | 17.0 | 18.8 | 24.7 | 33.2 |
Real GDP growth (%) | 1.1 | 4.3 | 3.3 | 4.1 |
Current account balance (% of GDP) | −0.5 | 0.2 | 1.3 | 7.5 |
Foreign exchange reserves (US$ billion, end of year) | 41.7 | 36.8 | 33.5 | 40.4 |
Sources: World Bank, World Development Indicators: PA.NUS.FCRF, FP.CPI.TOTL.ZG, NY.GDP.MKTP.KD.ZG, BN.CAB.XOKA.GD.ZS, FI.RES.TOTL.CD (accessed October 2026); Al Jazeera, “Nigeria’s petrol use falls after end of subsidy, regulator says” (6 July 2023); Wikipedia, “Nigerian naira” and “Bola Tinubu” (accessed October 2026); Central Bank of Nigeria Monetary Policy Committee decisions of 25 July 2023 and 26 November 2024, as reported by THEWILL and Arise News; National Bureau of Statistics, CPI and Inflation Report, October 2024, as reported by the News Agency of Nigeria (15 November 2024).
The questions set on the extract are listed in the table. Each part is then taken in turn, with a model answer and the reasons it earns its marks.
Part | Question | Marks |
|---|---|---|
(a)(i) | Define the term inflation indicated in bold in the text (Text C). | 2 |
(a)(ii) | Define the term depreciate indicated in bold in the text (Text B). | 2 |
(b)(i) | Using the information in Text A, calculate the percentage change in average daily petrol consumption. | 2 |
(b)(ii) | Using Table 1, calculate the change in the naira price of a tractor imported at a price of US$20,000, between 2022 and 2024. | 3 |
(c) | Using an appropriate diagram, explain the effect of ending the petrol subsidy on the market for petrol in Nigeria (Text A). | 4 |
(d) | Using an exchange rate diagram, explain why removing the restrictions on foreign exchange trading led to a fall in the value of the naira (Text B). | 4 |
(e) | Using an AD/AS diagram, explain how the events in Texts A and B could have caused the rise in inflation shown in Table 1. | 4 |
(f) | Using information from Table 1, explain two reasons why Nigeria’s current account balance improved between 2022 and 2024. | 4 |
(g) | Using information from the text/data and your knowledge of economics, evaluate the decision to end the petrol subsidy and float the naira in 2023. | 15 |
Part (a): definitions
Part (a) asks for the meaning of two terms shown in bold. Each is marked out of 2: a precise definition earns 2, a partial or vague one 1, and an example, a circular definition or a description of what happened in the text earns 0. The definition stands alone; there is no need to refer to the text.
Part (b): calculations
Part (b) asks for one or two calculations from the data, worth 5 marks in total. The marks are for working as well as for the answer, so a correct method with an arithmetic slip still earns most of them, while a correct number with no working may earn only one. A calculator is allowed in Paper 2. Every calculation in the course is worked through, with its traps, in Quantitative skills and calculations.
Write the formula first, in words or symbols, then substitute the figures from the data.
Use the right base. A percentage change is always divided by the original value: (new − old) ÷ old × 100.
Keep the sign. A fall is a negative percentage change; write −27.6%, not 27.6%.
Give units: %, ₦, US$, million litres. A missing unit or currency can cost a mark.
Round only at the end, usually to two decimal places or as the question asks.
The second calculation needs the exchange rate to convert a price in one currency into another. A price in US dollars becomes a price in naira when it is multiplied by the number of naira per dollar.
Parts (c) to (f): diagrams and explanations
The four middle parts are worth 4 marks each and most of them ask for a diagram. The usual split is 2 marks for a correct, fully labelled diagram and 2 for an explanation that refers to the diagram and to the text. A missing or wrong diagram usually caps the answer at 2, however good the writing.
A complete answer takes about ten minutes and has three parts: the diagram, labelled with the market or economy in the text; one paragraph explaining the change shown, using the diagram’s labels; and one or two specific references to the text or data. Definitions are not needed unless they help the explanation.
 YouTube
Part (c): a market diagram
Part (d): an exchange rate diagram
The exchange rate diagram is a frequent source of errors because the axes are about one currency only. The y-axis is the price of the naira (in dollars), and the x-axis is the quantity of naira; a fall in the value of the naira is a movement down the y-axis.
Part (e): an AD/AS diagram
Part (f): explaining two reasons
“Explain two reasons” questions often have no diagram. They are usually marked 2 + 2: each reason earns 1 mark for being identified and 1 for being explained, ideally with evidence from the data. A third reason earns nothing extra.
Part (g): the 15-mark evaluation
Part (g) asks for an evaluation of a policy or an outcome in the case, “using information from the text/data and your knowledge of economics”. It is marked with markbands like those of Paper 1 (b): understanding the question, theory, terms, diagrams, and balanced evaluation. The one difference is that the strand for real-world examples is replaced by the use of the text and data.
Use of the text/data | What it looks like | Typical band |
|---|---|---|
None, or copied | Paragraphs of the text repeated without analysis | Lowest bands |
Limited | A figure mentioned in passing, not used in the argument | Low to middle |
Some relevant information | Figures and events from the text cited to support some points | Middle |
Generally appropriate and correctly applied | Text and data used in most paragraphs, with correct interpretation | Upper middle |
Used to build a reasoned argument | Figures, stakeholders and policies from the text woven into the analysis and the evaluation | Top band (13–15) |
The evidence for (g) is the text, not outside examples. Knowledge of economics (theory, diagrams, the usual evaluation points) is needed, but a paragraph about a different country earns little, while the same point made with the case’s own figures earns a lot. The answers to parts (c)–(f) are often the building blocks: (g) can reuse their diagrams and figures briefly, as long as it adds evaluation.
A structure for part (g)
Introduction: define the key terms of the question and state the policy or issue in the case.
Theory with a diagram: how the policy is meant to work (a diagram is expected unless already drawn in an earlier part, in which case refer back to it and add to it).
Evaluation, point by point: three to five points, each weighed and each supported by the text or data: short run vs long run, stakeholders, the size of the effect, what it depends on, alternatives.
Conclusion: a judgment that answers the question, based on the case.
The model answer is longer than most answers written in 40 minutes, but its structure is the target: definitions, theory with diagrams, three or four weighed points each built on the case’s figures, and a judgment. A shorter answer with the same structure and the same use of the data can reach the top band.
Common weaknesses and how to fix them
Weakness | Why it costs marks | The fix |
|---|---|---|
Definitions with the context instead of the meaning | A description of the text is not a definition | Learn definitions word for word; leave the context for later parts |
Answers to calculations with no working | Method marks lost; a slip leaves no marks at all | Formula, substitution, answer with units |
Generic diagram labels | The explanation marks need the link to the case | Name the market or economy on the axes or in a title |
Diagram not explained, or explanation with no diagram | Each is capped at about 2 of 4 marks | Diagram plus a paragraph that uses its labels and the text |
Copying sentences from the text | Copying is not analysis | Quote one figure, then explain what it shows |
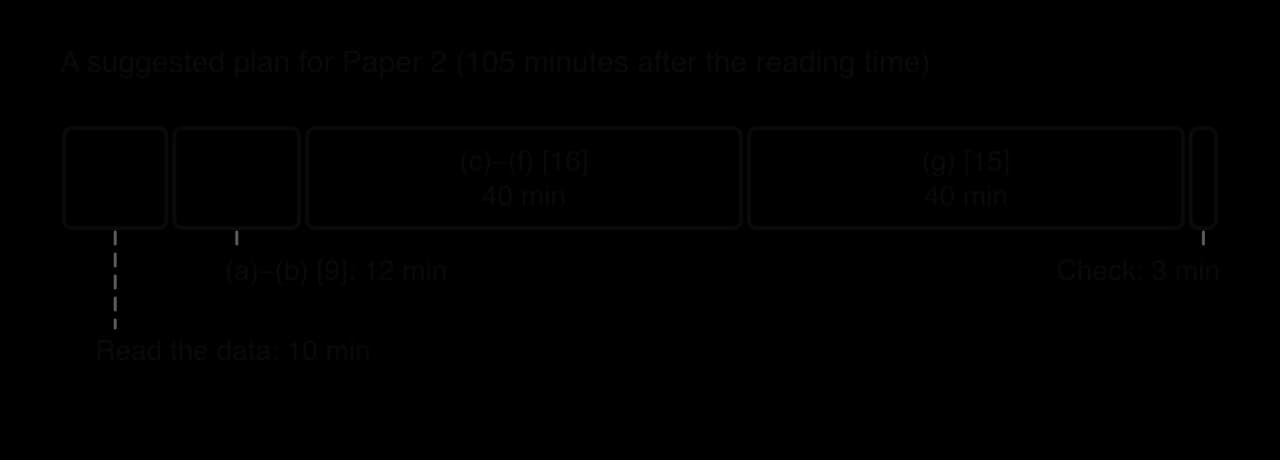
Too little time for (g) | A third of the marks rushed | Start (g) with about 40 minutes left |
A (g) answer from general knowledge | The text/data strand stays in the low bands | Use figures, stakeholders and policies from the case in every paragraph |
Summary
Paper 2 is one question from a choice of two: a case study with texts and data, and seven parts worth 40 marks.
Read the questions first, annotate the text for figures, theory and stakeholders, and plan (g) while reading.
(a) definitions earn 2 marks each when precise; (b) calculations need the formula, the working and units.
(c)–(f) are usually 2 marks for a labelled diagram and 2 for an explanation that uses its labels and the text.
(g) is worth 15: define, explain with a diagram, evaluate in weighed points built on the text’s figures, and reach a judgment.
Leave about 40 minutes for (g); the text, not outside examples, is the evidence.
Carry on with Economics in Augment
With a free account, Augment remembers where you stopped in the notes and which questions you have marked.