Augment Education
    • Question bank
    • Quick fire
    • Worksheets
    • Flashcards
    • Notes
    • Try a quick-fire round
    • All features
    • Business
    • Digital Society
    • Economics
    • Geography
    • Global Politics
    • History
    • Philosophy
    • Psychology
    • Anthropology
    • World Religions
    • Biology
    • Chemistry
    • Physics
    • Computer Science
    • Design Technology
    • ESS
    • SEHS
    • Language and literature
    • Language acquisition
    • Maths AA
    • Maths AI
    • Dance
    • Film
    • Music
    • Theatre
    • Visual Arts
    • Grade calculator
    • Grade boundaries
    • Subject checker
    • Focus timer
    • Exam countdown
    • All free tools
    • IB guide
    • All subjects
  • Blog

Search

Search subjects, the syllabus, glossary terms, the booklets, the IB guide, help and the blog

Log inStart free
augment

Augment Education

IB Diploma revision built around the syllabus.

contact@augment-education.com

Product

  • Features
  • Question bank
  • Quick fire
  • Worksheets
  • Flashcards
  • Notes
  • Subjects
  • What's new

Learn

  • IB guide
  • Booklets, explained
  • Glossary
  • Blog
  • Free tools
  • Grade calculator
  • Subject checker

Company

  • About
  • Help
  • For parents
  • For teachers
  • Comparisons

Subjects

  • English A Lit
  • English A Lang & Lit
  • Chinese A Lit
  • Chinese A Lang & Lit
  • Spanish A Lit
  • Spanish A Lang & Lit
  • English Lit & Perf
  • Spanish Lit & Perf
  • English B
  • Mandarin B
  • Spanish B
  • English ab initio
  • Mandarin ab initio
  • Spanish ab initio
  • Business
  • Digital Society
  • Economics
  • Geography
  • Global Politics
  • History
  • Philosophy
  • Psychology
  • Anthropology
  • World Religions
  • Biology
  • Chemistry
  • Physics
  • Computer Science
  • Design Technology
  • ESS
  • SEHS
  • Maths AA
  • Maths AI
  • Dance
  • Film
  • Music
  • Theatre
  • Visual Arts

Augment Education is developed independently of the International Baccalaureate Organization and is not endorsed by it. “IB” and “International Baccalaureate” are its trademarks.

© 2026 Augment Education. All rights reserved.

  • Privacy
  • Terms
  1. Subjects
  2. Economics
  3. Paper 1: extended response

Paper 1: extended response

Choose and plan a Paper 1 question, write a part (a) that explains theory with a diagram and a part (b) that evaluates with real-world examples, and avoid the weaknesses that cap marks.

  • IB Economics
  • Exam skills
  • SL and HL

21 min readLast reviewed 14 Oct 2026

Paper 1 is the extended response paper, taken by both SL and HL students. It tests whether you can explain economic theory in depth, use a diagram as part of that explanation, and then build a balanced argument supported by real-world examples. It has no calculations and no data to work from: everything comes from your own knowledge.

This makes Paper 1 the most predictable paper to prepare for. The questions change, but the structure, the way it is marked and the skills it rewards do not. An answer built to the structure set out here can reach the top markband on any question.

How the paper is built

You answer one question from a choice of three. The three questions usually come one from each of the microeconomics, macroeconomics and global economy units, and Unit 1 ideas can appear inside any of them. At SL the questions avoid HL-only material; at HL they may use it. Each question has two parts, and part (b) usually builds on the theory of part (a).

Part (a)

Part (b)

Marks

10

15

What it tests

Knowledge, application and analysis, diagrams (AO1, AO2, AO4)

All of (a), plus synthesis and evaluation (AO3)

Typical command terms

Explain, distinguish, analyse; often “Using an appropriate diagram, explain…”

Evaluate, discuss, to what extent, examine; always “Using real-world examples…”

Diagram

Expected wherever one fits; often required

Expected wherever one fits; a new diagram or a new use of the (a) diagram

Real-world examples

Not required

Required for the top bands

Evaluation

Not rewarded

Central: balanced and with a judgment

Exam tip

Part (a) does not reward evaluation. Strengths, limitations and judgments in (a) take time and earn nothing, while the same points in (b) are worth a great deal. Keep (a) to theory, diagram and explanation, and save the weighing for (b).

How part (a) is marked

Both parts are marked with a markscheme specific to the question, which lists the theory and diagrams expected, and with markbands, which describe the quality of the answer as a whole. Part (a) has five bands (1–2, 3–4, 5–6, 7–8, 9–10). The examiner places the answer in the band that best fits it, then chooses the mark within the band.

Definition

Markband: one of the levels of performance used to mark extended answers, each describing the qualities an answer must show to earn the range of marks in that level.

The bands are described along four strands. Moving up a band means moving along each of them, so it is worth knowing what the top of each strand looks like.

Strand

A weak answer (1–4)

A strong answer (9–10)

Understanding the question

Writes about the topic in general, not the specific question

Addresses exactly what was asked, all of it

Theory

States or describes theory, some of it irrelevant

Explains relevant theory fully, with each step of the reasoning

Terminology

Few relevant terms, or terms used loosely

Relevant terms used appropriately throughout

Diagram

Missing, wrong, or drawn but not mentioned

Correct, fully labelled and fully explained in the text

The diagram strand is the one most often decided by small details. A correct diagram that the writing never refers to counts only as “included”, which holds the answer below the top band. Referring to it by its labels (“the shift from S to S + tax raises the price from Pe to Pc”) turns it into a fully explained diagram.

How part (b) is marked

Part (b) has five bands (1–3, 4–6, 7–9, 10–12, 13–15). It uses the same four strands as part (a) and adds two more: synthesis and evaluation, and the use of real-world examples.

Strand

A middle answer (7–9)

A top answer (13–15)

Understanding, theory, terms, diagrams

Theory partly explained; diagram included and partly explained

Theory fully explained; diagram fully explained and linked to the argument

Synthesis and evaluation

Appropriate but one-sided: lacks balance

Effective and balanced: weighs both sides and reaches a supported judgment

Real-world examples

A relevant example named or partly developed

Examples fully developed in context and actually supporting the argument

Definition

Synthesis: the combining of several pieces of theory, evidence and argument into one coherent answer that addresses the question as a whole.

Two strands separate a 9 from a 13. The first is balance: the answer must weigh arguments on more than one side and reach a judgment, not list advantages and disadvantages. The second is the depth of the examples: a named country is not enough; the example must be developed (what happened, when, with figures where possible) and used to support a point in the argument.

Exam tip

“Using real-world examples” is in every part (b) question. Without a developed example the answer cannot reach the top bands, however strong the theory. Plan at least one developed example and one or two shorter ones before writing.

Choosing a question and planning

Five minutes of reading time come before the paper starts, and the first minutes of writing time are best spent on choice and planning. Read all three questions in full, both parts, before choosing. The (b) part carries more marks, so the best choice is usually the question whose (b) you can answer best, with a diagram and a developed example you know well.

  1. Read both parts of all three questions. Underline the command terms and the key terms in each.

  2. Check part (b) first. Can you think of a relevant diagram, two sides of an argument, and a real-world example you can develop with dates and figures?

  3. Check part (a). Can you define its key terms and draw the diagram it needs, correctly labelled, from memory?

  4. Choose and do not change. Switching questions after writing half an answer almost always costs more than it gains.

  5. Plan both parts in a few lines each: the terms to define, the diagram(s), the order of paragraphs, and for (b) the example and the judgment.

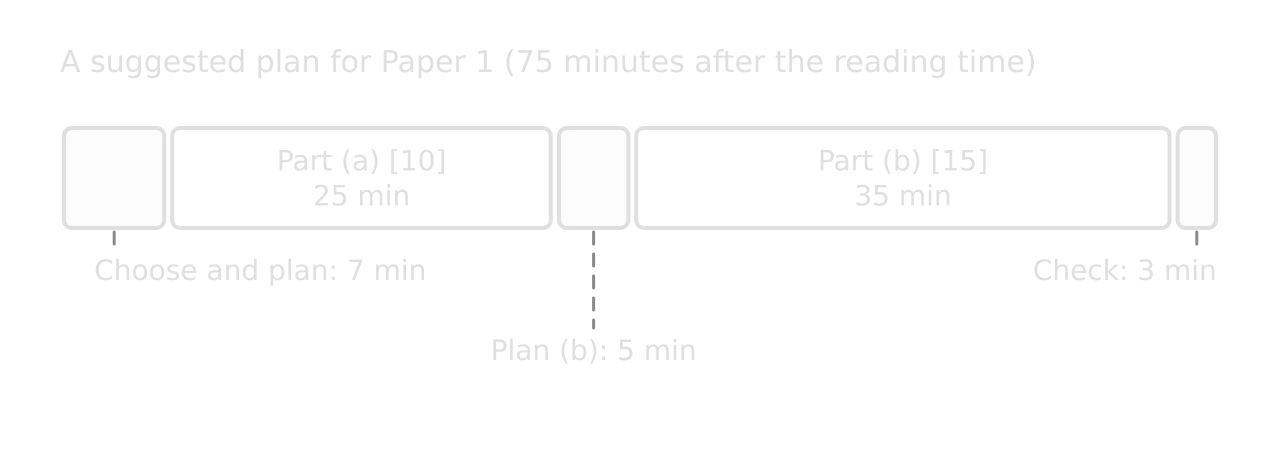
Timeline bar of 75 minutes for Paper 1: choose and plan 7 minutes, part (a) 25 minutes, plan (b) 5 minutes, part (b) 35 minutes, check 3 minutes.Timeline bar of 75 minutes for Paper 1: choose and plan 7 minutes, part (a) 25 minutes, plan (b) 5 minutes, part (b) 35 minutes, check 3 minutes.
Part (b) is worth 1.5 times part (a), so it gets more time; the short planning breaks keep each answer focused on its question.

Time spent roughly in proportion to marks is a safe guide: about 25 minutes for (a) and about 35–40 for (b), with a few minutes to plan each. The most common timing problem is spending too long on (a), which is easier to write, and then rushing (b), which is worth more.

Tip

Write the plan for (b) before starting (a). Ideas for the evaluation often come while writing (a), and a plan already on the page gives them somewhere to go. It also guards against using up the best example in (a), where it earns nothing.

Writing part (a)

A part (a) answer is a focused explanation of theory. A reliable structure has four parts, in this order.

Section

What it contains

Length

1. Definitions

Precise definitions of the two or three key terms in the question

2–3 sentences

2. Diagram

A fully labelled diagram showing the mechanism the question is about

About half a page

3. Explanation

The mechanism step by step, referring to the diagram by its labels, applied to the context in the question

2–3 paragraphs

4. Link back

One or two sentences answering the question directly

1–2 sentences

“Explain two…” questions need two developed points of similar depth, each with its own paragraph; a third point earns nothing extra. “Distinguish between…” questions need both terms defined and then the differences stated directly, usually with a diagram for each or one diagram showing both.

YouTube
EconplusDal on the 10-mark part (a): defining terms, drawing the diagram and explaining it within the time available.

Model answer: part (a)

The model answers that follow use one Paper 1 question. The (a) part is on the theory of a negative externality; the (b) part asks for an evaluation of carbon taxes, which builds directly on it.

Worked example

Question 1 (a) [10 marks]: Using an appropriate diagram, explain why the use of fossil fuels to generate electricity leads to market failure.

Show the model answer and commentary

Model answer.

Market failure occurs when the free market fails to allocate resources efficiently, so the quantity produced is not the socially optimal quantity, where marginal social benefit (MSB) equals marginal social cost (MSC). One cause of market failure is a negative externality of production: a cost imposed on third parties by the production of a good, which the producer does not pay.

When power stations burn coal, oil or gas, they emit carbon dioxide and other pollutants. The carbon dioxide adds to climate change, whose costs (damage from floods, droughts and heat, lower crop yields) fall on people around the world and on future generations. Local air pollution also harms the health of people living near the power stations. None of these costs is paid by the generator or by its customers.

Negative production externality in electricity: Price, costs, benefits ($ per MWh) against Quantity of electricity (MWh). D = MPB = MSB, S = MPC, MSC above MPC by the external cost. Market at Qm, Pm; optimum at Qopt, Popt; hatched welfare loss.Negative production externality in electricity: Price, costs, benefits ($ per MWh) against Quantity of electricity (MWh). D = MPB = MSB, S = MPC, MSC above MPC by the external cost. Market at Qm, Pm; optimum at Qopt, Popt; hatched welfare loss.
Because the generator ignores the external cost, output is Qm rather than Qopt; the hatched triangle is the welfare loss from over-production.

In the diagram, the supply curve S = MPC shows the marginal private cost of generating electricity: fuel, labour and capital. The demand curve shows the marginal private benefit to consumers; as there are no externalities in consumption, D = MPB = MSB. The market reaches equilibrium where D = MPC, at quantity Qm and price Pm.

The marginal social cost is the private cost plus the external cost of the emissions, so the MSC curve lies above MPC by the external cost at every level of output. The socially optimal quantity is Qopt, where MSB = MSC, at price Popt. The market therefore over-produces electricity from fossil fuels by Qm − Qopt, and its price Pm is too low, because it does not include the external cost.

For every unit between Qopt and Qm, the marginal social cost is greater than the marginal social benefit, so society would be better off if these units were not produced. The hatched triangle between MSC and MSB from Qopt to Qm is the welfare loss. Resources are over-allocated to fossil-fuel electricity, so there is allocative inefficiency: the market has failed.

In short, because generators do not pay for the damage their emissions cause, the market price of fossil-fuel electricity is too low and too much of it is produced, which is market failure.

Examiner-style commentary. This answer would be placed in the top band (9–10). It defines market failure and the externality precisely, applies the theory to the specific context of electricity and emissions, and explains each step of the mechanism. The diagram is correct, fully labelled in context, and every label is used in the text: MPC, MSC, MSB, Qm, Qopt, Pm, Popt and the welfare loss. It does not evaluate (no discussion of policies), which (a) does not reward. The last paragraph links back to the question in one sentence.

Common mistake

Drawing the externality diagram without explaining why MSC lies above MPC. The vertical gap is the external cost per unit, and the answer must say what that cost is in the context (here, the damage from emissions). A diagram with MSC drawn but never explained earns only part of the diagram marks.

A second, shorter example shows how the same structure handles a different kind of (a) question, one built on elasticity rather than market failure.

Worked example

(a) [10 marks]: Using an appropriate diagram, explain how the price elasticity of demand for a good affects the burden of an indirect tax on consumers.

Show an answer plan

Answer plan.

  • Definitions: an indirect tax (a tax on spending, paid to the government by producers, which shifts supply up by the tax per unit for a specific tax); price elasticity of demand (the responsiveness of quantity demanded to a change in price, ceteris paribus).

  • Diagram: two panels with the same specific tax, one with price-inelastic demand (steep) and one with price-elastic demand (flat), each showing Pc, Pe, Pp, Q₁, Qe and the shares of the tax revenue paid by consumers (C) and producers (P).

  • Explanation, inelastic demand: when demand is inelastic, consumers continue to buy much the same quantity as the price rises, so producers can pass most of the tax on: Pc rises close to Pe + tax, and area C is much larger than area P. The tax incidence falls mainly on consumers; quantity falls only a little.

  • Explanation, elastic demand: when demand is elastic, a higher price causes a large fall in quantity demanded, so producers absorb most of the tax: Pc rises only a little, Pp falls a lot, and area P is the larger share.

  • Link back: the more price inelastic the demand, the greater the share of the tax paid by consumers (and the more revenue the government raises, because quantity falls less). This is why governments tax goods such as fuel and tobacco, whose demand is inelastic.

Two panels with the same specific tax. Left, price-inelastic (steep) demand: consumers' share C between Pe and Pc is large, producers' share P between Pp and Pe small, and quantity falls a little. Right, price-elastic (flat) demand: C is small, P large, and quantity falls a lot.Two panels with the same specific tax. Left, price-inelastic (steep) demand: consumers' share C between Pe and Pc is large, producers' share P between Pp and Pe small, and quantity falls a little. Right, price-elastic (flat) demand: C is small, P large, and quantity falls a lot.
With the same tax, consumers pay most of it (area C) when demand is price inelastic, and producers pay most (area P) when demand is price elastic.

Writing part (b)

Part (b) is an evaluative essay. It reuses the theory of (a) but must go further: a policy or a consequence is assessed from more than one side, with real-world evidence, and the answer ends with a judgment. A clear structure keeps the argument balanced.

Section

What it contains

1. Introduction

Definitions of the key terms in the (b) question, and a one-sentence statement of the line of argument

2. Theory

How the policy or factor works, with a diagram (a new diagram, or the (a) diagram extended with the policy); briefer than in (a) if (a) has already explained the basics

3. Evaluation, point by point

Three or four evaluative points, each in its own paragraph: the point, the reasoning, the real-world evidence, and what it means for the question

4. Conclusion

A judgment that answers the question directly and says what it depends on

Each evaluative paragraph should do one job. A helpful pattern is point → explain → example → weigh: state the argument, explain the economics behind it, support it with a developed example, then say how strong the argument is or what it depends on. The last step is what turns a paragraph from analysis into evaluation.

Definition

Evaluation: the weighing of the strengths and limitations of an argument, theory or policy to reach a reasoned judgment supported by evidence.

The judgment should not appear from nowhere in the conclusion. If the paragraphs have weighed each point as they went, the conclusion can draw them together: which arguments are strongest, and under what conditions the answer would change. “It depends” is a good conclusion only when the answer says what it depends on and which way it most likely goes.
YouTube
EconplusDal on the 15-mark evaluation question: building balanced evaluation, using examples and reaching a judgment.

Model answer: part (b)

Worked example

Question 1 (b) [15 marks]: Using real-world examples, evaluate the use of carbon taxes to reduce greenhouse gas emissions.

Show the model answer and commentary

Model answer.

A carbon tax is an indirect tax on fossil fuels set according to the carbon dioxide released when they are burned. It is a form of Pigouvian tax: a tax designed to make producers and consumers pay the external cost of their activity. Carbon taxes can reduce emissions effectively, but their success depends on the rate set, on how much of the economy they cover and on how the effects on low-income households are handled.

Diagram of the market for electricity: D = MPB = MSB, S = MPC, MSC above it. A carbon tax smaller than the external cost shifts supply to MPC + carbon tax, so output falls from Qm to Q1 and price rises to P1, but Q1 is still above Qopt; a small hatched welfare loss remains.Diagram of the market for electricity: D = MPB = MSB, S = MPC, MSC above it. A carbon tax smaller than the external cost shifts supply to MPC + carbon tax, so output falls from Qm to Q1 and price rises to P1, but Q1 is still above Qopt; a small hatched welfare loss remains.
The tax shifts supply from S = MPC to MPC + carbon tax, cutting output from Qm to Q₁; set below the full external cost, it leaves a smaller welfare loss between Q₁ and Qopt.

In the diagram, a tax on each unit of electricity generated from fossil fuels shifts the supply curve up from S = MPC to MPC + carbon tax. Generators now pay part of the external cost of their emissions, so the price rises from Pm to P₁ and the quantity falls from Qm to Q₁, closer to the social optimum Qopt. If the tax equalled the full external cost at Qopt, supply would shift to MSC and the welfare loss would disappear. Because the tax shown is smaller than the external cost, a smaller welfare loss remains between Q₁ and Qopt.

The main strength of a carbon tax is that it uses the price mechanism. Every firm and household facing the tax has an incentive to cut emissions where it is cheapest for them to do so, by switching fuel, saving energy or investing in cleaner technology, so a given cut in emissions is achieved at low cost. Sweden introduced its carbon tax in 1991 at SEK 250 per tonne of CO₂ and has raised it gradually to SEK 1,510 (about €134) in 2025, one of the highest rates in the world.

Between 1990 and 2018 Sweden’s greenhouse gas emissions fell by 27%, while real GDP per person rose by more than 50% between 1990 and 2019. A study of Swedish transport fuel found that emissions were almost 11% lower than in a comparable group of countries without the tax. This suggests carbon taxes can cut emissions without stopping growth.

However, the size of the effect depends on the price elasticity of demand. Demand for energy is price inelastic in the short run, because households and firms cannot quickly change their heating systems, vehicles or machines. A carbon tax therefore cuts emissions only a little at first, and the fall grows over time as capital is replaced. Sweden’s gradual increases over three decades allowed this adjustment; a country that needs fast cuts may find a tax alone too slow.

A second limitation is that the right rate is hard to know. The external cost of a tonne of CO₂ is uncertain, because it depends on future climate damage, so a tax may be set too low, as in the diagram, leaving a welfare loss. Tradable permits, as in the EU Emissions Trading System, fix the quantity of emissions directly and let the price adjust, which gives more certainty about the environmental result but less certainty about the cost to firms. Sweden exempts firms covered by the EU system from its carbon tax, which shows that the two tools are often used together.

Carbon taxes also raise questions of equity. Low-income households spend a larger share of their income on energy, so a carbon tax is regressive. Sweden has paired its increases with cuts in other taxes to keep the overall tax burden unchanged, which reduces this problem and helps make the policy politically acceptable. Where revenue is not returned, public opposition can force governments to abandon the tax. There is also the risk of carbon leakage: firms in internationally traded industries may move production to countries without a carbon price, so emissions move rather than fall.

On balance, carbon taxes are an effective and low-cost way to reduce emissions over the long run, as Sweden’s experience shows, because they make polluters pay part of the external cost and use market incentives. Their effectiveness is greatest when the rate rises steadily and predictably, when revenue is used to offset the burden on low-income households, and when they are combined with permits or regulation for sectors where a price alone works too slowly. A carbon tax is therefore best seen as the core of a climate policy rather than the whole of it.

Examiner-style commentary. This answer would be placed in the top band (13–15). The key terms are defined; the diagram is correct, labelled in context and explained, including the remaining welfare loss, which links the theory to an evaluative point. The evaluation is balanced: one strength developed with evidence, then four limitations (PED and time, uncertainty about the external cost, equity, carbon leakage), each weighed rather than listed, with tradable permits used as an alternative. The Sweden example is developed in depth (dates, rates, outcomes) and used as evidence for and against the argument, not dropped in. The conclusion gives a clear judgment and says what it depends on.

To be even stronger, a second short example from another region would show that the judgment holds in a different context.

Sources: IEA Policies Database, “Sweden carbon tax” (2026); Tax Foundation, “Sweden’s Carbon Tax” (updated November 2023); J. Andersson, American Economic Journal: Economic Policy (2019).

The model answers are written to show what a top-band answer contains, not to be memorised. In the exam, a top-band answer is usually shorter than these, because it is written by hand in limited time; what matters is that every element is present: definitions, a fully explained diagram, developed examples, weighed evaluation and a judgment.

Common weaknesses and how to fix them

Most lost marks in Paper 1 come from a small number of habits. Each one caps the answer at a lower band, whatever the quality of the rest.

Weakness

Why it costs marks

The fix

Writing everything known about the topic

The first strand of every markband is answering the specific question

Underline the command term and key terms; check each paragraph against them

Evaluating in (a)

No AO3 marks in (a); time lost for (b)

Theory, diagram, explanation only in (a)

Diagram not referred to

Counts as “included”, not “explained”

Use every label of the diagram in the text

Repeating the (a) diagram in (b) without new analysis

Adds nothing new to the argument

Draw a new diagram (the policy, a different market) or extend the old one

A generic or undeveloped example

Caps the examples strand in the middle bands

Name, date and quantify the example; say what it shows

A list of advantages and disadvantages

One-sided or unweighed evaluation

Weigh each point: how big, for whom, when, compared with what

No conclusion, or a conclusion that repeats the essay

No judgment reached

Answer the question directly and say what the answer depends on

Rushing (b)

The 15-mark part gets the least time

Plan both parts first; move on from (a) at about 25 minutes

Common mistake

Writing “however” before each limitation and calling it evaluation. “A carbon tax reduces emissions. However, it is regressive.” states two points but weighs neither. Evaluation says how much each point matters: “The regressive effect is significant because energy takes a larger share of low incomes, but it can be offset by returning the revenue through lower income taxes, as Sweden has done.”

A related habit is preparing whole essays in advance. Prepared material helps only when it is reshaped to the exact question set.

Common mistake

Memorising a prepared essay and writing it whatever the question. A prepared answer on “carbon taxes” fitted to a question on “tradable permits” or on “the effectiveness of international agreements” misses the specific demands of the question. Prepare examples and diagrams, not whole essays.

Add to your notes: a one-page plan for one question from each unit, with the definitions, the diagram, three evaluation points (each with a “weigh” sentence), a developed example and a one-sentence judgment. Timing a full answer from such a plan is the best Paper 1 practice.

Practice questions

These questions are written in the style of Paper 1. Each answer plan shows the theory, diagrams, examples and evaluation a strong answer would use.

Worked example

(a) [10 marks]: Using an AD/AS diagram, explain how a fall in business confidence could cause cyclical unemployment.
(b) [15 marks]: Using real-world examples, evaluate the effectiveness of monetary policy in reducing unemployment.

Show the answer plans

(a) plan. Define cyclical (demand-deficient) unemployment and aggregate demand. Diagram: AD shifts left from AD₁ to AD₂ along SRAS, real GDP falls below Yf (a deflationary gap). Explain: lower confidence cuts planned investment, a component of AD; firms produce less and need fewer workers; unemployment rises because demand for labour is derived from demand for output. Link back.

(b) plan. Define monetary policy. Diagram: expansionary monetary policy shifts AD right, closing the gap. Evaluate: speed and flexibility of interest rate decisions (strength); time lags; weak transmission when confidence is low or interest rates are already near zero; the risk of inflation and asset bubbles; no effect on structural unemployment. Example: central banks cutting rates to near zero and using quantitative easing in 2020, and how unemployment recovered afterwards. Judgment: effective for cyclical unemployment when interest rates have room to fall and confidence responds; weak for structural unemployment and in a deep slump, where fiscal policy is needed too.

Exam tip

In a two-part question, part (b) is often wider than part (a): (a) asks about one cause or one mechanism, (b) about policy or consequences. Answer (b) on its own terms, but use the theory from (a) where it helps, briefly, rather than explaining it again.

Worked example

(a) [10 marks]: Using an appropriate diagram, explain the effect of a tariff on domestic producers and the government.
(b) [15 marks]: Using real-world examples, discuss the arguments for protecting domestic industries from foreign competition.

Show the answer plans

(a) plan. Define a tariff and the world price. Tariff diagram with Ddom, Sdom, Pw and Pw + tariff. Explain: the domestic price rises by the tariff; domestic production rises from Q₁ to Q₂, so producer revenue and surplus rise; imports fall; government revenue is the tariff per unit times the quantity imported (area c). Link back.

(b) plan. Arguments for: infant industries, protecting jobs in the short run, national security, anti-dumping, raising government revenue in low-income countries. Arguments against: higher prices for consumers, welfare loss, inefficiency of protected firms, retaliation. Examples: a recent tariff dispute between major economies, with the industries and rates involved; a successful and an unsuccessful infant-industry case. Judgment: protection can be justified for a limited time in specific cases (security, genuine infant industries with a plan to remove it), but as a general policy its costs to consumers and the risk of retaliation usually outweigh the gains.

Part (b) needs a judgment that answers the question. An answer with excellent theory and examples but no clear conclusion cannot reach the top band, because the strand for evaluation asks for a supported judgment.

Summary

  • Paper 1 is one question from a choice of three: part (a) [10] explains theory with a diagram; part (b) [15] evaluates with real-world examples.

  • Choose the question with the part (b) you can answer best, plan both parts first, and give (b) more time than (a).

  • Part (a): define, draw a fully labelled diagram, explain the mechanism step by step using its labels, link back. No evaluation.

  • Part (b): define, explain the theory with a diagram, then three or four evaluative paragraphs (point, explain, example, weigh), and a clear judgment.

  • Examples must be named, dated, quantified and used as evidence; a list of “however” points is not evaluation.

  • The top bands need precise terms throughout, diagrams referred to in the text, balance and a judgment.

Keep your place

In Augment the notes remember where you stopped and which pages you have finished.

Open in Augment

More IB Economics notes

  • Command terms, definitions and diagramsThe page before this.
  • Paper 2: data responseThe next page.
  • Economics assessmentEach Economics paper, the internal assessment and grade boundaries.
  • IB EconomicsThe Economics syllabus, how it is assessed and every notes page.

Carry on with Economics in Augment

With a free account, Augment remembers where you stopped in the notes and which questions you have marked.

Start free