Command terms, definitions and diagrams
Read every command term the way examiners do, write definitions that earn both marks, draw and explain diagrams to IB conventions, and use real-world examples that support an argument.
- IB Economics
- Exam skills
- SL and HL
Every IB Economics answer is judged on the same few skills: doing exactly what the question asks, using precise terms, drawing correct diagrams and explaining them, and supporting arguments with evidence.
Exam technique rests on four building blocks. The first is the command term, the instruction word that tells you what kind of answer is wanted. The second is the definition, which often earns marks on its own. The third is the diagram, which economics answers depend on more than almost any other subject. The fourth is the real-world example, which turns a textbook answer into an argument about the real economy.
How command terms work
Every exam question starts with a command term: define, explain, evaluate and so on. The command term sets the task and its depth. Two answers with the same economics can earn very different marks if one does what the command term asks and the other does something else, such as describing when the question asks for an explanation.
Command terms are grouped by the assessment objectives (AOs) they test. AO1 is knowledge and understanding, AO2 is application and analysis, AO3 is synthesis and evaluation, and AO4 is the use of skills such as diagrams and calculations. Each part of the course is set at one of these levels, which tells you how far a question on it can go.
Assessment objective | What it tests | Its command terms |
|---|---|---|
AO1 Knowledge and understanding | Knowing the content, terms, current issues and data | define, describe, list, outline, state |
AO2 Application and analysis | Applying theory to a situation; analysing causes and effects; interpreting data | analyse, apply, comment, distinguish, explain, suggest |
AO3 Synthesis and evaluation | Building an argument, weighing it and reaching a judgment | compare, compare and contrast, contrast, discuss, evaluate, examine, justify, recommend, to what extent |
AO4 Use of skills | Diagrams, calculations, data handling, structured writing | calculate, construct, derive, determine, draw, identify, label, measure, plot, show, show that, sketch, solve |
Evaluation in an “explain” question earns nothing extra and costs time that a later part needs. Read the command term first, underline it, and plan the answer to fit it.
Every command term and what it demands
The tables give each command term, its meaning, and what it demands in an economics answer. The meanings are short; the third column is the useful one, because it says what an examiner looks for when marking.
AO1: knowledge and understanding
Command term | Meaning | What it demands in economics |
|---|---|---|
Define | Give the exact meaning of a word, phrase, concept or quantity. | One or two sentences in exact economic language, with every key qualifier (for example “general” and “sustained” for inflation). A formula where one exists. No examples needed. |
Describe | Give a detailed account. | What happens or what something looks like, in detail, without explaining why: for example, the trend in a data series, with figures and dates. |
List | Give a series of brief answers with no explanation. | Short items, one per line. Rare in economics papers. |
Outline | Give a short account or summary. | The main points in a few sentences. Less depth than “describe” or “explain”. |
State | Give a specific name, value or short answer, with no explanation or working. | A word, number or phrase: “State the type of unemployment shown in paragraph 2.” |
AO2: application and analysis
Command term | Meaning | What it demands in economics |
|---|---|---|
Analyse | Break something down to bring out its essential elements or structure. | Take a situation apart into causes, mechanisms and effects, using theory and usually a diagram. |
Apply | Use an idea, equation, principle, theory or law on a given problem. | Use a model on the case in the question: name the market, the curves and the actors from the text. |
Comment | Give a judgment based on a statement or on the result of a calculation. | Say what a figure or statement means in context: “PED is −0.4, so demand is price inelastic and a tax will raise revenue but cut consumption only a little.” |
Distinguish | Make the differences between two or more concepts or items clear. | Define both, then state the difference directly, ideally on the same criterion: “Demand-pull inflation starts from AD, cost-push from SRAS.” |
Explain | Give a detailed account that includes reasons or causes. | A chain of cause and effect, with each link stated: “because…, which means…, so…”. Usually with a diagram that the text refers to. |
Suggest | Propose a solution, hypothesis or other possible answer. | A reasoned possibility, not a certainty: “One possible reason is…”. |
AO3: synthesis and evaluation
Command term | Meaning | What it demands in economics |
|---|---|---|
Compare | Set out the similarities between two or more items, referring to each of them throughout. | Similarities, point by point, with both items in each sentence. |
Compare and contrast | Set out both the similarities and the differences between items, referring to each throughout. | Both similarities and differences, organised by criterion (cost, speed, effect on equity), not item by item. |
Contrast | Set out the differences between items, referring to each throughout. | Differences only, point by point. |
Discuss | Review a range of arguments or factors in a balanced way, and state clear conclusions backed by evidence. | Arguments for and against, each explained, then a conclusion that follows from them. |
Evaluate | Judge something by weighing its strengths against its limitations. | Strengths and limitations of a policy, theory or view, weighed against each other (which matters more, when, for whom), ending in a judgment. |
Examine | Look closely at an argument or concept to bring out its assumptions and the links within it. | Bring out the assumptions behind a view (rational consumers, flexible wages, a closed economy) and test whether they hold. |
Justify | Support an answer or conclusion with sound reasons or evidence. | Reasons and evidence for a stated position. |
Recommend | Propose a sensible course of action for a given situation, backed by reasons or evidence. | One clear policy for the case given, explained, supported by the data and weighed against its costs. Used mainly at HL. |
To what extent | Judge how far an argument or concept holds, with clear conclusions backed by evidence and reasoning. | A judgment of degree: “largely”, “only partly”, “in the short run but not the long run”, with the reasons. |
The evaluative AO3 terms (discuss, evaluate, examine, to what extent, recommend) need three things: arguments on more than one side, some weighing of them, and a conclusion. Evaluation is the weighing. A list of advantages followed by a list of disadvantages is not yet evaluation, because nothing has been weighed; the evaluation starts when the answer says which points matter more and why.
Good evaluation in economics draws on a small set of questions that apply to almost any policy or theory. They are worth learning as a checklist, because they turn a one-sided answer into a balanced one.
Evaluation question | What it brings out | Example of a sentence it produces |
|---|---|---|
Short run or long run? | Effects that change over time; time lags | “In the short run supply is inelastic, so the subsidy mostly raises price; over several years new capacity is built and output rises.” |
Who gains and who loses? | Stakeholders: consumers, producers, workers, government, third parties, future generations | “Low-income households spend a larger share of income on fuel, so the tax is regressive.” |
How big is the effect? | Size of PED, PES, the multiplier, the gap | “With demand this inelastic, consumption falls only slightly.” |
What does it assume? | The realism of the model | “The model assumes the government knows the size of the external cost, which is hard to measure.” |
What does the evidence show? | Data and real-world experience | “After the charge was introduced, peak-hour traffic fell sharply.” |
Compared with what? | Alternative policies; opportunity cost | “Regulation would cut emissions with more certainty but at a higher cost per tonne.” |
What does it depend on? | Context: the country, the state of the economy, priorities | “In a deep recession, crowding out is unlikely, so the stimulus is more effective.” |
AO4: use and application of skills
Command term | Meaning | What it demands in economics |
|---|---|---|
Calculate | Find a numerical answer, showing the steps of the working. | Formula, substitution, answer with units (%, $, units per week). Working earns marks even if the final answer is wrong. |
Construct | Present information as a diagram or in a logical form. | Build a diagram or table from information given. |
Derive | Rearrange a mathematical relationship to obtain a new one. | Rearrange a formula; rare at SL. |
Determine | Find the one possible answer. | A single value or outcome, usually read from data or a diagram. |
Draw | Produce an accurate, labelled diagram or graph in pencil, with a ruler for straight lines, to scale where relevant. | A full IB diagram: title, labelled axes and curves, equilibria marked on the axes, arrows for shifts. |
Identify | Choose an answer from several possibilities. | Pick the right item from the text or data, briefly. |
Label | Add labels to a diagram. | Names of axes, curves, points and areas. |
Measure | Find the value of a quantity, for example from a scale. | Read a value off a scale. |
Plot | Mark the positions of points on a diagram. | Points placed accurately from data, for example a Lorenz curve from quintile shares. |
Show | Write out the steps of a calculation. | Every step written out. |
Show that | Reach a result already given, without a formal proof. | Working that reaches a value already given in the question. |
Sketch | Draw a labelled diagram or graph that shows the general shape or relationship and its key features. | Correct shape and labels; exact scale not needed. |
Solve | Find the answer by algebraic, numerical or graphical methods. | An answer by any valid method, with working. |
One example at three levels: Singapore’s road pricing
The clearest way to see how command terms change an answer is to use one real example at three levels. Singapore has charged drivers for using its busiest roads since 1975, when the Area Licensing Scheme required a paper licence costing S$3 a day to drive into the central business district in the morning peak. Vehicle entries in the morning peak fell from 32,500 to 7,700, a fall of 76%.
In 1998 the scheme was replaced by Electronic Road Pricing (ERP). Gantries over the road deduct a charge automatically as a vehicle passes, and the charge varies by location and time of day. The Land Transport Authority (LTA) reviews the rates against target speeds: 45–65 km/h on expressways and 20–30 km/h on arterial roads. When traffic is slower than the target, the charge rises; in March 2026, for example, charges rose by S$1 at four expressway locations, taking the highest of them from S$3 to S$4 per passage. A satellite-based system with new on-board units began to be installed in November 2023.
Sources: Wikipedia, “Singapore Area Licensing Scheme” and “Electronic Road Pricing” (accessed October 2026); Land Transport Authority, “Revised ERP Rates from 23 March 2026” (12 March 2026).
Road congestion is a textbook negative externality of consumption. Each driver who joins a busy road slows down every other driver, adding to their travel time, fuel use and pollution, but pays none of these costs. The marginal social benefit of a car journey is therefore lower than the marginal private benefit, and the market produces more journeys than is socially optimal. ERP is a price on that external cost, in the same family of policies as the Pigouvian tax.
Level 1: define
A definition stands alone. It does not need the Singapore example, a diagram or an explanation of policy, and none of these earn extra marks at this level.
Level 2: explain, with a diagram
An “explain” question asks for the mechanism: why the market fails and what the charge does, shown on a diagram and explained step by step. The diagram is not an illustration added at the end; it is part of the explanation and the text must refer to it.
Level 3: evaluate
An “evaluate” question keeps the theory from level 2 but adds the weighing of strengths and limitations and a judgment. The real-world example now does more work: it is evidence for or against the argument, not decoration.
Across the three levels the economics barely changes. What changes is the task: a precise meaning, then a mechanism with a diagram, then a weighed judgment with evidence. Recognising which task the command term sets is most of the skill.
Writing definitions that earn marks
Definitions appear in every paper. In Paper 2 they are two questions worth 2 marks each; in Paper 1 they open almost every good answer; in the HL policy paper they appear again. A precise definition earns 2 marks; a vague or partial one earns 1; an example or a circular definition usually earns nothing.
What makes a definition precise
It states the category first. Inflation is “a sustained increase in the general price level”; a subsidy is “a payment by the government to firms”. The category tells the examiner you know what kind of thing the term is.
It includes every key qualifier. Many terms are defined by one or two words that are easy to drop: “general” and “sustained” for inflation; “next best” for opportunity cost; “ceteris paribus” for the law of demand; “over a period of time, usually a year” for GDP.
It does not use the term to define itself. “Inflation is when prices inflate” is circular and earns nothing.
It uses economic language. “Too much is produced” is weaker than “output exceeds the socially optimal level, where MSB = MSC”.
It adds the formula where one exists. For PED, the formula is often the clearest way to show the exact meaning.
Weak and strong definitions compared
Term | Weak (0–1 mark) | Strong (2 marks) |
|---|---|---|
Price elasticity of demand (PED) | How much demand changes when price changes. | A measure of the responsiveness of the quantity demanded of a good to a change in its price, ceteris paribus: PED = % change in quantity demanded ÷ % change in price. |
Inflation | When prices go up. | A sustained increase in the general (average) price level in an economy over a period of time. |
Opportunity cost | What you give up. | The value of the next best alternative forgone when a choice is made. |
Market failure | When the market does not work. | A situation in which the free market fails to allocate resources efficiently, so that the quantity produced or consumed is not the socially optimal one (MSB ≠ MSC). |
Depreciation | When a currency gets weaker. | A fall in the value of a currency against another currency in a floating exchange rate system, caused by market forces. |
Real GDP | GDP without inflation. | The total value of all final goods and services produced in an economy over a period of time, adjusted for changes in the price level (measured at constant prices). |
The weak versions are incomplete rather than false. “How much demand changes when price changes” confuses demand with quantity demanded and leaves out the measurement; the strong version names the variable, the direction of cause and the formula. In the price elasticity of demand example, the word “responsiveness” and the formula together earn the 2 marks.
Definitions inside longer answers
In a Paper 1 essay or a Paper 2 part (g), definitions are not marked separately, but they count towards the terminology strand of the markband, and they show the examiner from the first line that you understand the question. Define the two or three key terms in the question in your first paragraph, briefly and precisely, then move on. Defining every term you use wastes time.
Drawing diagrams to IB conventions
Diagrams carry a large share of the marks in economics. In Paper 2, a 4-mark diagram question typically gives about half its marks for the diagram itself; in Paper 1, an answer with no diagram where one is appropriate cannot reach the top bands. A diagram earns its marks only when it is correct, fully labelled and explained in the writing.
The labelling checklist
A title that names the market or economy: “The market for petrol in Country X”, “AD/AS in Nigeria”.
Both axes labelled with the right variables for the diagram type (Price and Quantity for a market; Average price level and Real GDP for AD/AS). Units are optional unless the data has them.
Every curve labelled at its end: D, S, MSC, AD, SRAS, LRAS. A shifted curve gets a subscript: D₁ → D₂.
Equilibria marked with dashed lines to both axes and labelled on the axes: P₁ and Q₁, then P₂ and Q₂.
Arrows showing the direction of every shift.
Areas shaded and labelled where the question is about them: welfare loss, tax revenue, consumer surplus.
Large and clear: a diagram should take up about a third to half of a page, drawn with a ruler for straight lines.
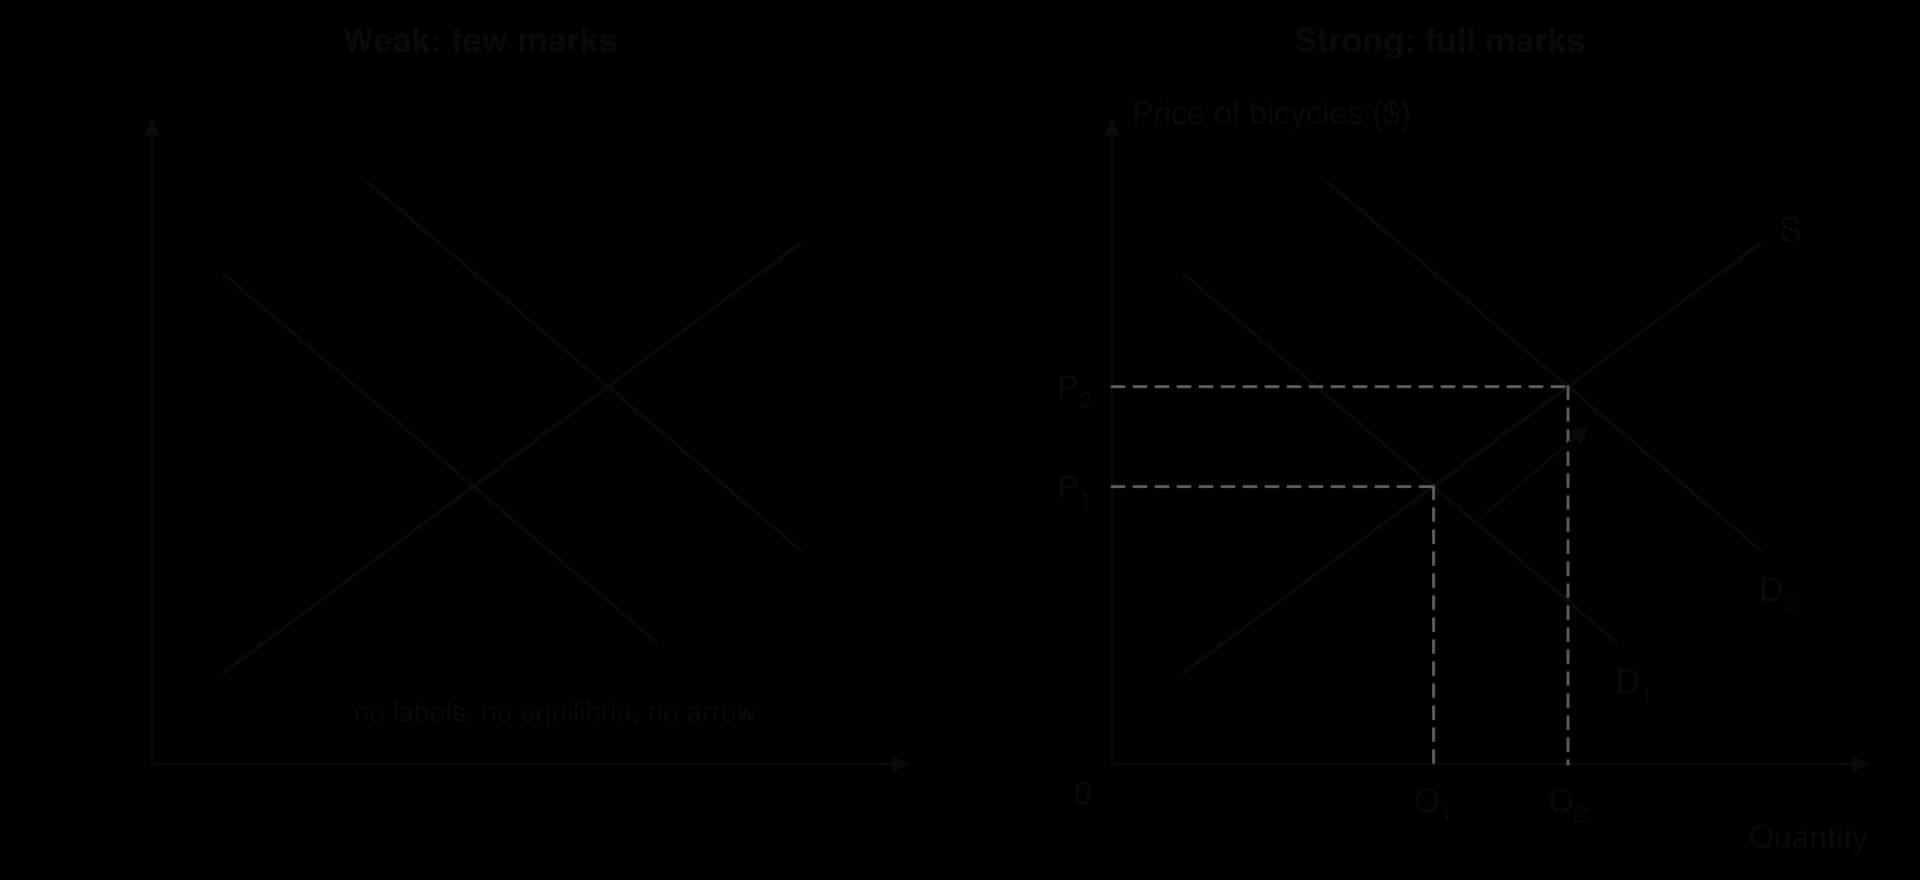
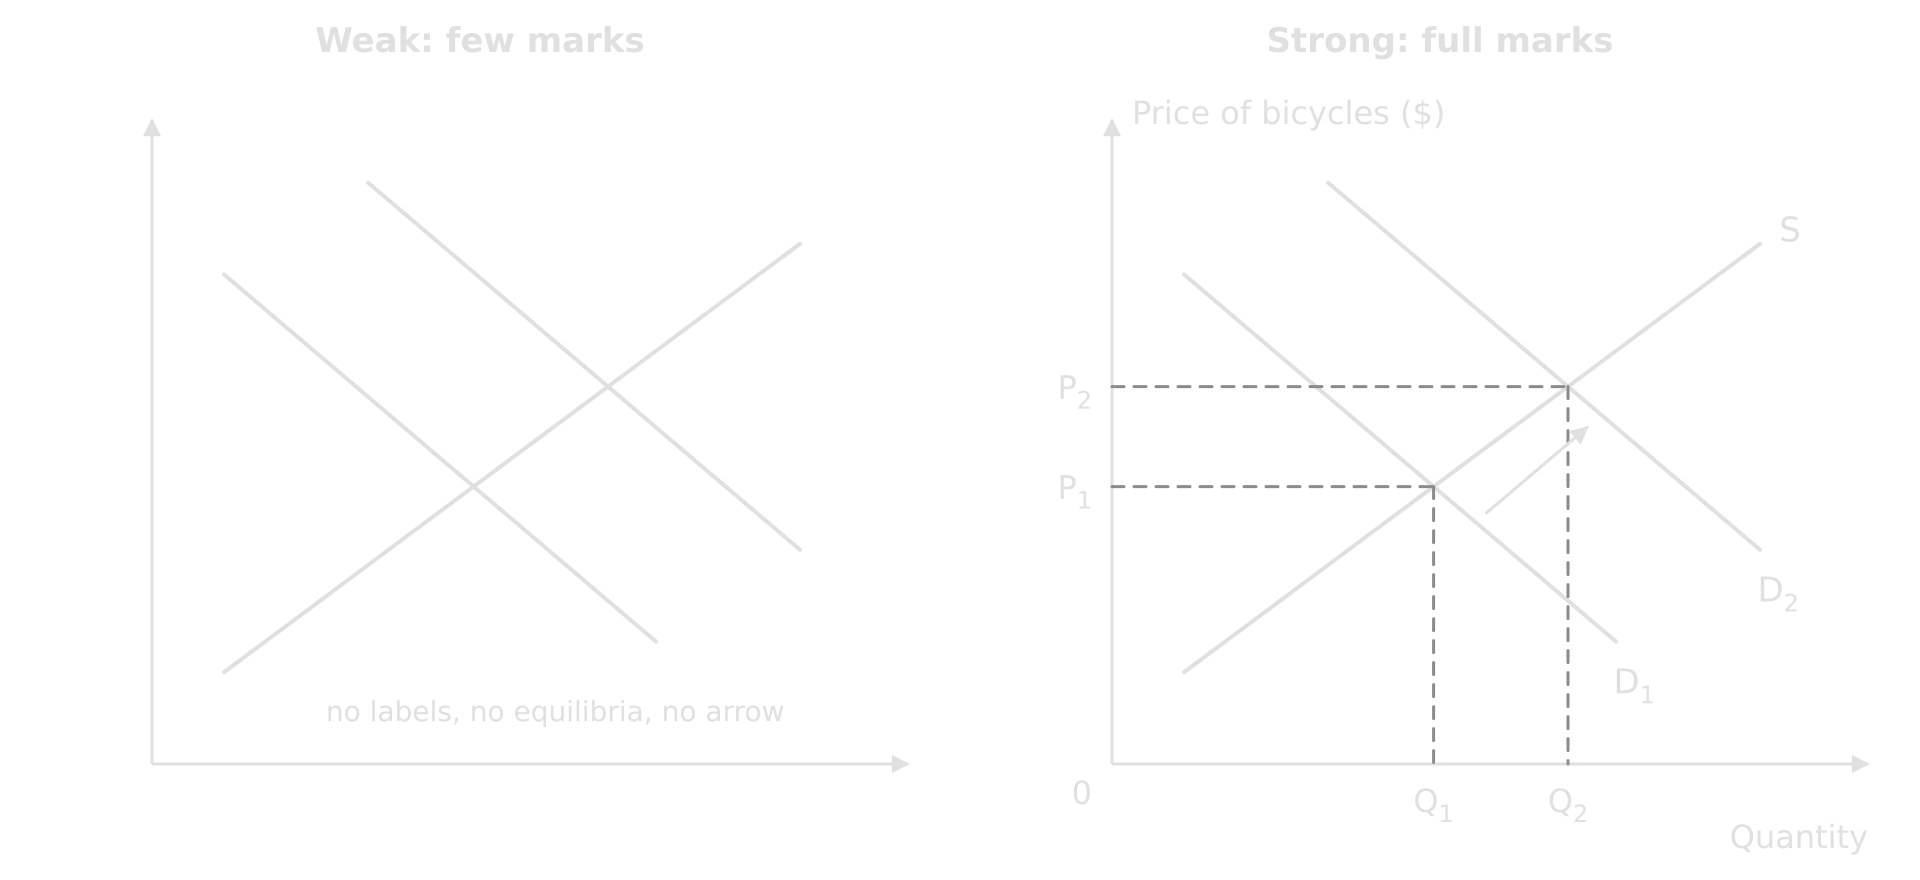
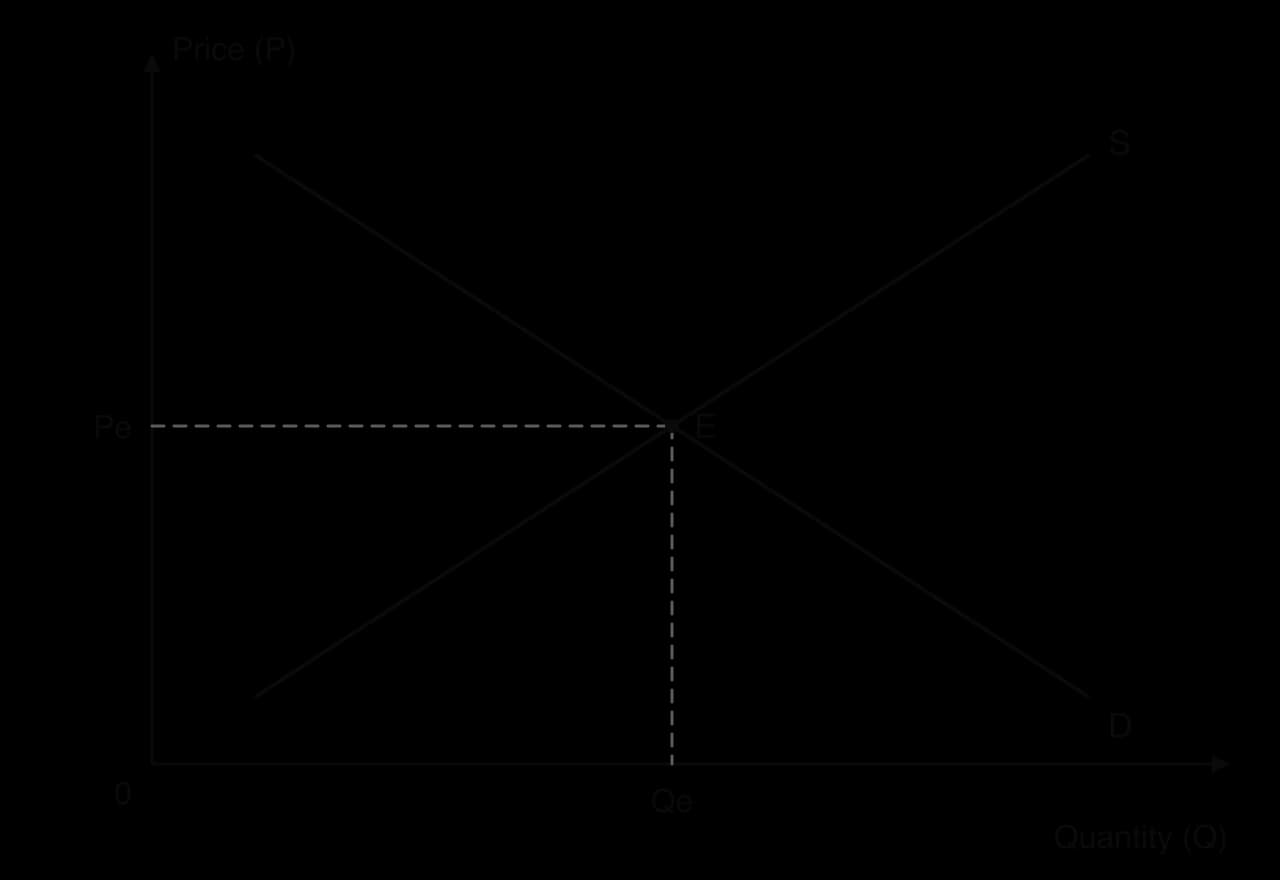
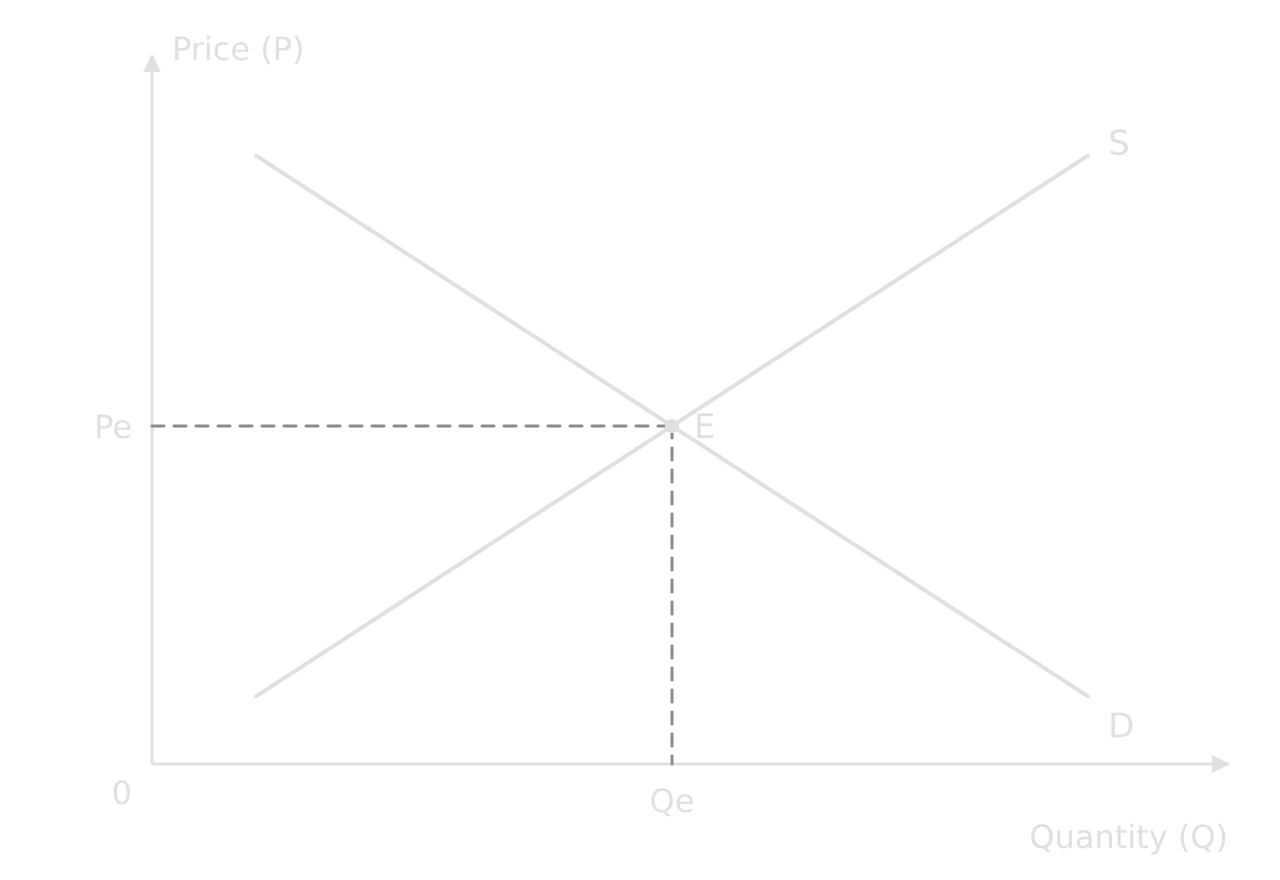
The two diagrams show the same economics, but the left-hand one cannot be marked as correct: an examiner cannot tell which line is demand, whether the price rose or fell, or what the axes measure. Every missing label is a mark at risk. The right-hand diagram can be read without any text, which is the test of a well-labelled diagram.
 YouTube
Standard labels by diagram type
The axis labels depend on the type of diagram, not on the topic of the question.
Diagram type | y-axis | x-axis | Curves and labels |
|---|---|---|---|
Market (demand and supply, price controls, taxes, subsidies) | Price (P) | Quantity (Q) | D, S, S + tax, S − subsidy; Pe, Qe; Pmax or Pmin |
Externalities | Price, costs, benefits | Quantity (Q) | MPB, MSB, MPC, MSC; Qm (market), Qopt (social optimum) |
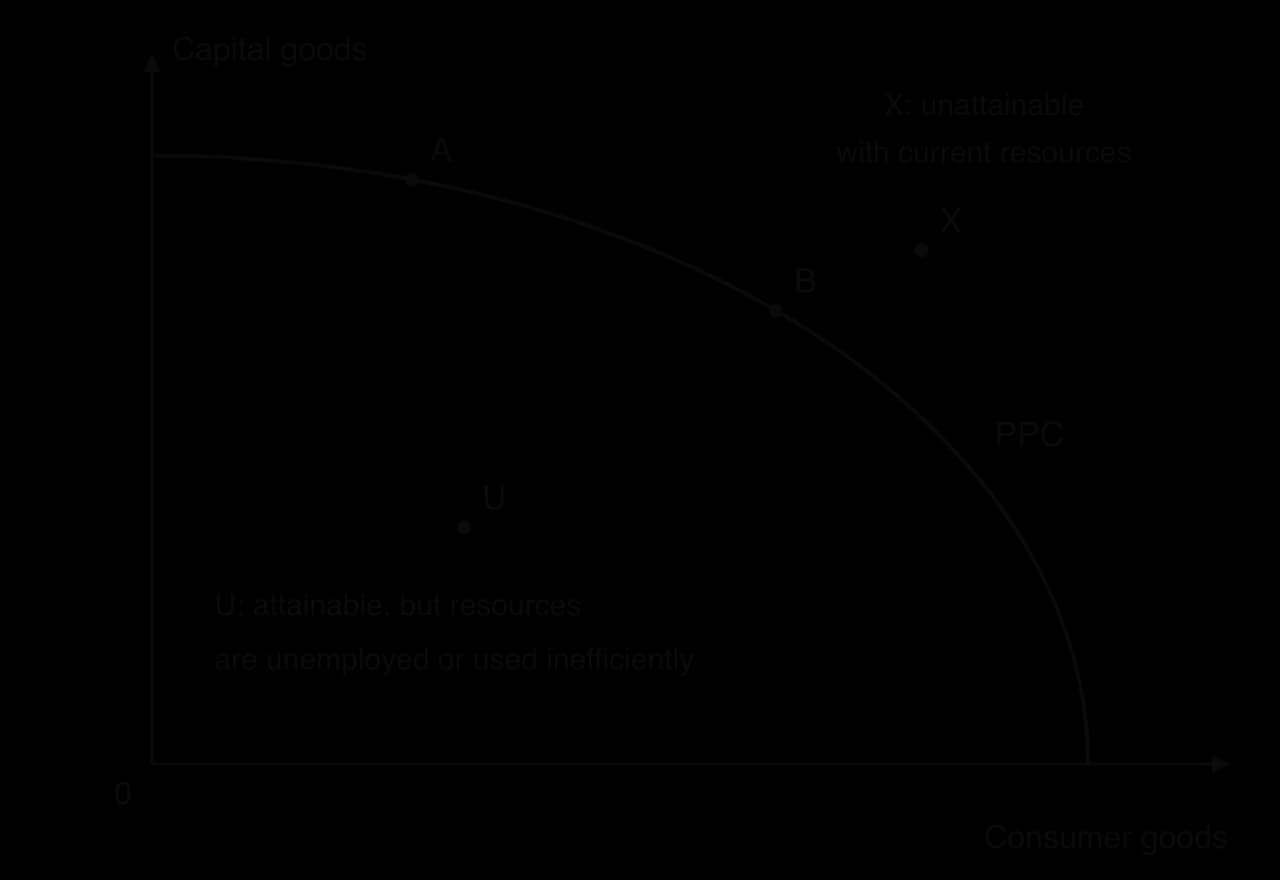
Production possibilities curve (PPC) | Quantity of good A | Quantity of good B | PPC, PPC₁; points A, B |
Labour market | Wage rate (W) | Quantity of labour | DL, SL; We, Qe |
AD/AS | Average price level | Real GDP | AD, SRAS, LRAS or Keynesian AS; Yf for full employment output |
Business cycle | Real GDP | Time | Actual output; long-term growth trend |
Lorenz curve | Cumulative % of income | Cumulative % of population | Line of perfect equality; Lorenz curve |
International trade (tariff, quota, subsidy) | Price (P) | Quantity (Q) | Ddom, Sdom, Pw, Pw + tariff |
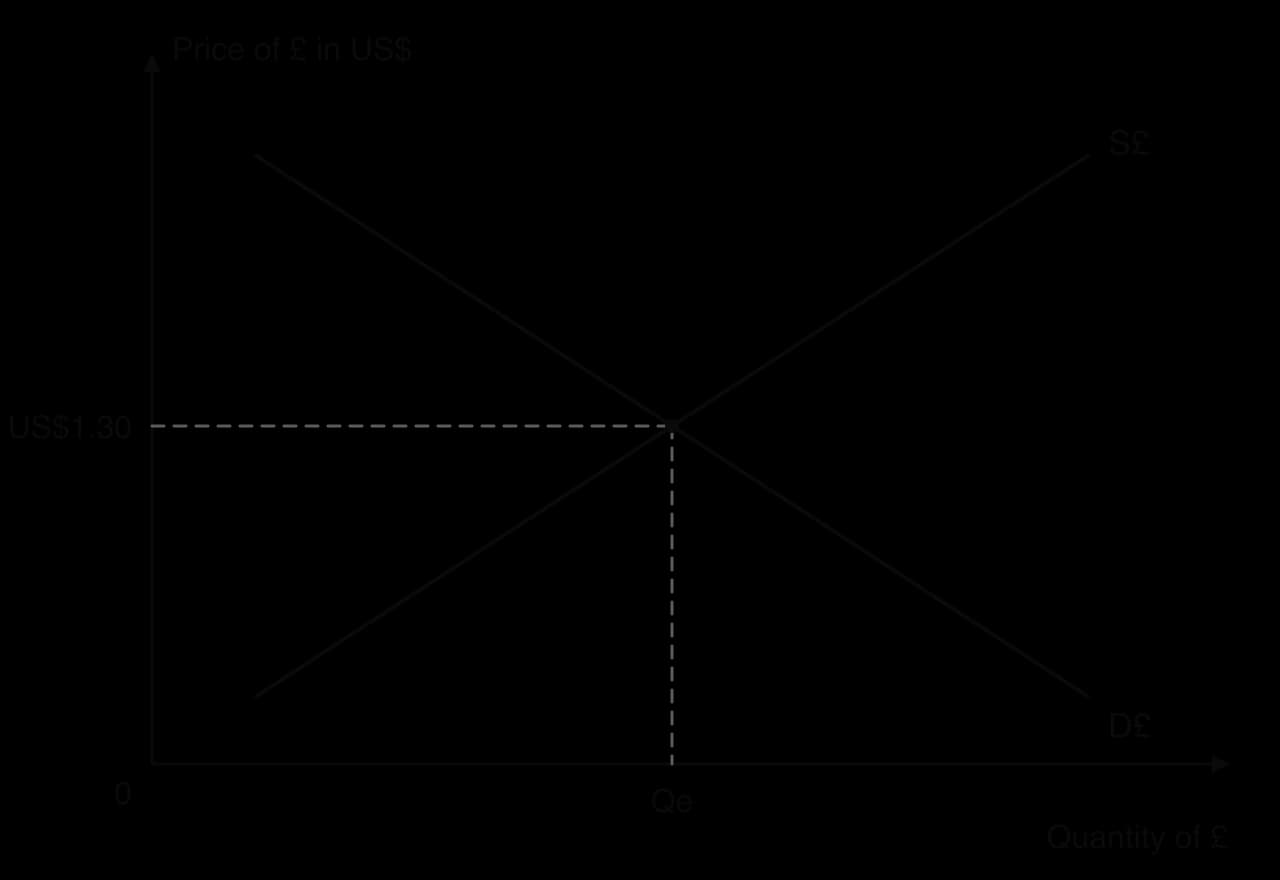
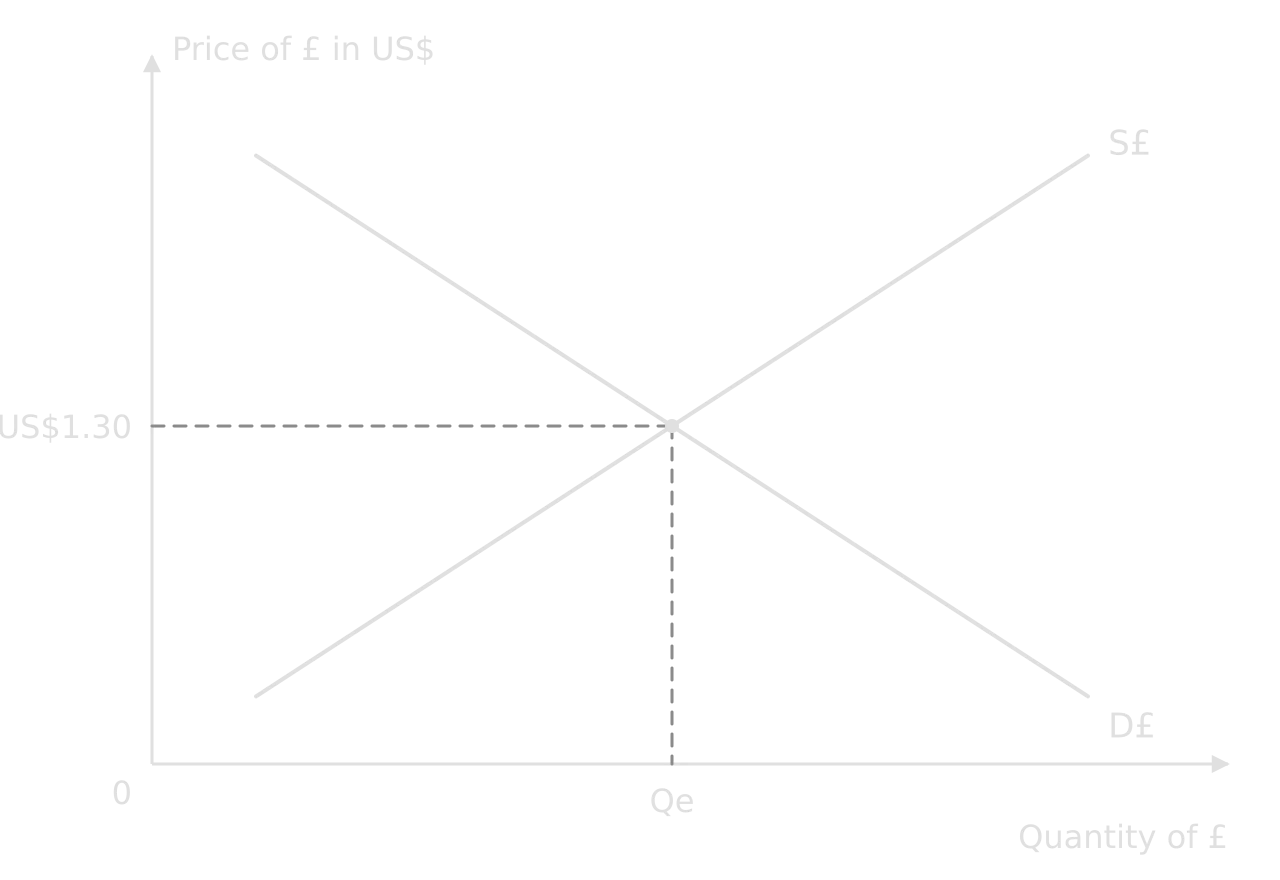
Exchange rate | Price of currency X in currency Y (e.g. US$ per €) | Quantity of currency X | D€, S€; e₁, e₂ |
Explaining a diagram, step by step
The difference between a diagram that is “included” and one that is “fully explained” is the text around it. A reliable order for the explanation is the same for almost every diagram:
Start point: where the market or economy begins (“The market is initially in equilibrium at P₁ and Q₁, where D₁ meets S.”).
Cause: what changes and which curve it affects, with the reason (“A rise in incomes increases demand for bicycles, a normal good, so demand shifts right from D₁ to D₂.”).
Adjustment: what happens at the old price (“At P₁ there is now excess demand, so the price rises.”).
New equilibrium: the new values, read from the diagram (“The new equilibrium is at P₂ and Q₂: price and quantity have both risen.”).
Meaning: what the result means for the question (“Producers’ revenue rises, which encourages them to expand capacity.”).
A gallery of the standard diagrams
Most exam answers use a small number of core diagrams. Each is shown here with its standard labels; the theory behind each one is taught in its own subtopic. Being able to draw each from memory, fully labelled, in under two minutes is a realistic target before the exam.
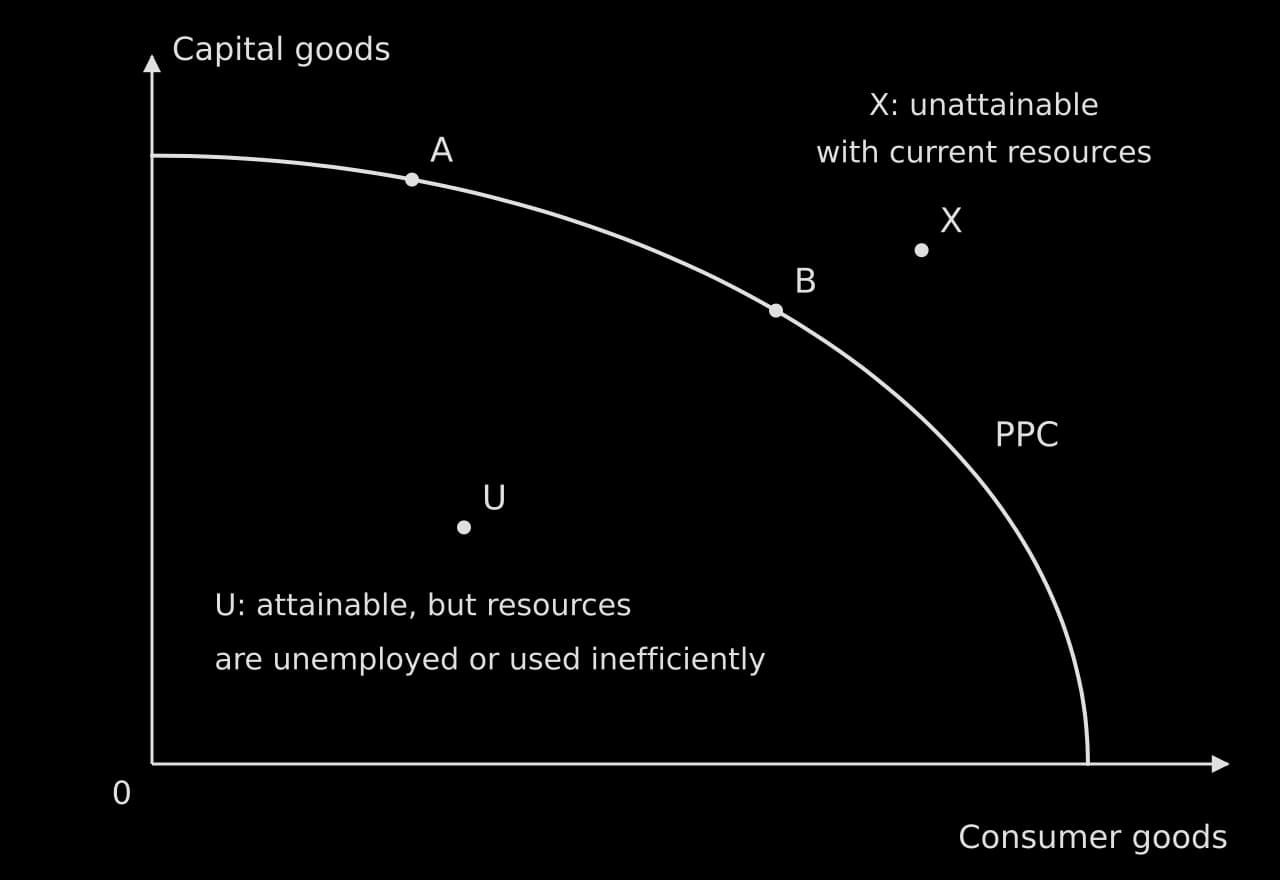
Production possibilities curve
Used for scarcity, choice, opportunity cost, unemployment of resources and growth. Label both axes with goods, mark points on, inside and outside the curve, and explain what each shows.
Market equilibrium
The base of every microeconomic diagram: Price on the y-axis, Quantity on the x-axis, D sloping down, S sloping up, and the equilibrium marked on both axes.
Price ceiling
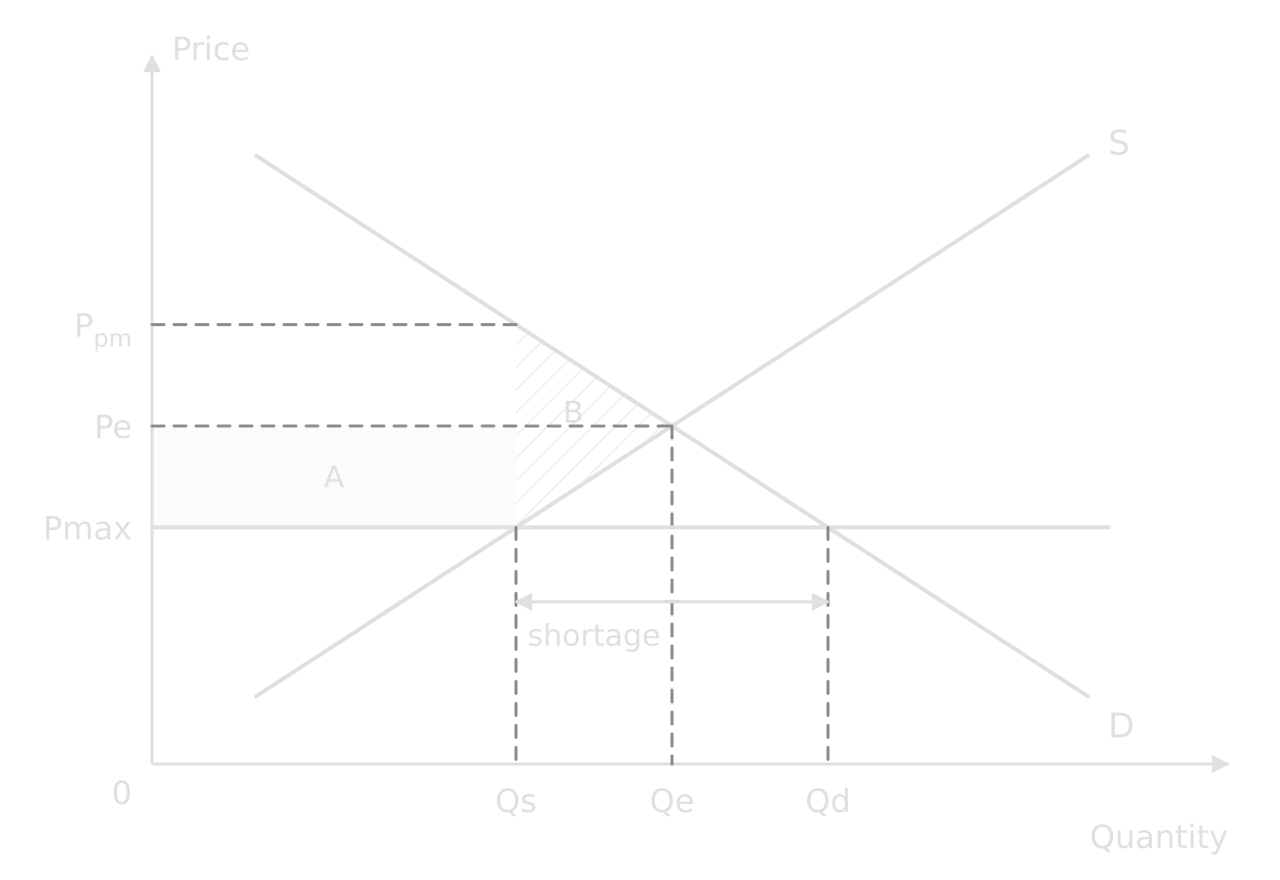
A maximum price only has an effect below equilibrium. Mark Pmax, the quantities demanded and supplied at it, and the shortage between them.

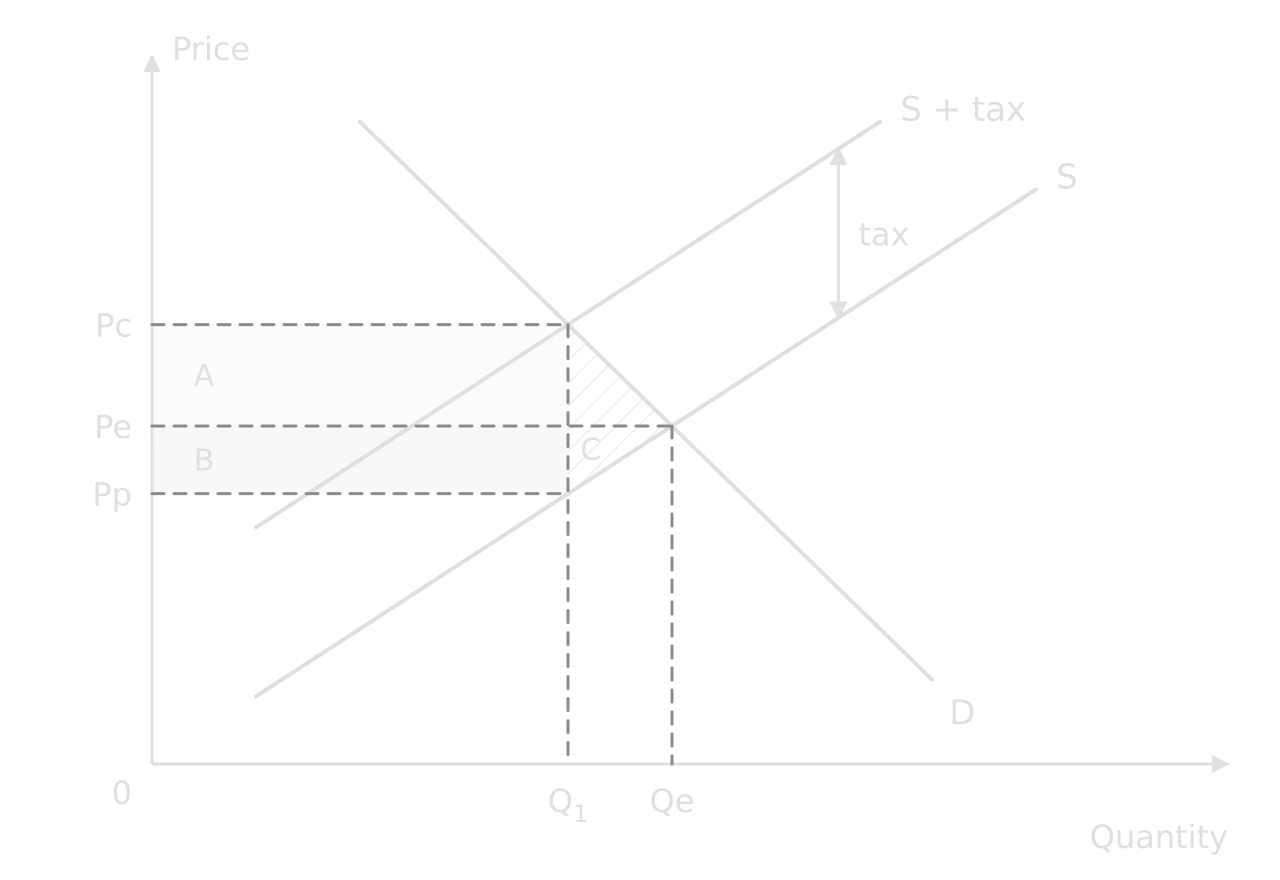
Indirect tax
A specific tax shifts supply up by the tax per unit. Mark the price consumers pay (Pc), the price producers receive (Pp), the new quantity and the tax revenue.

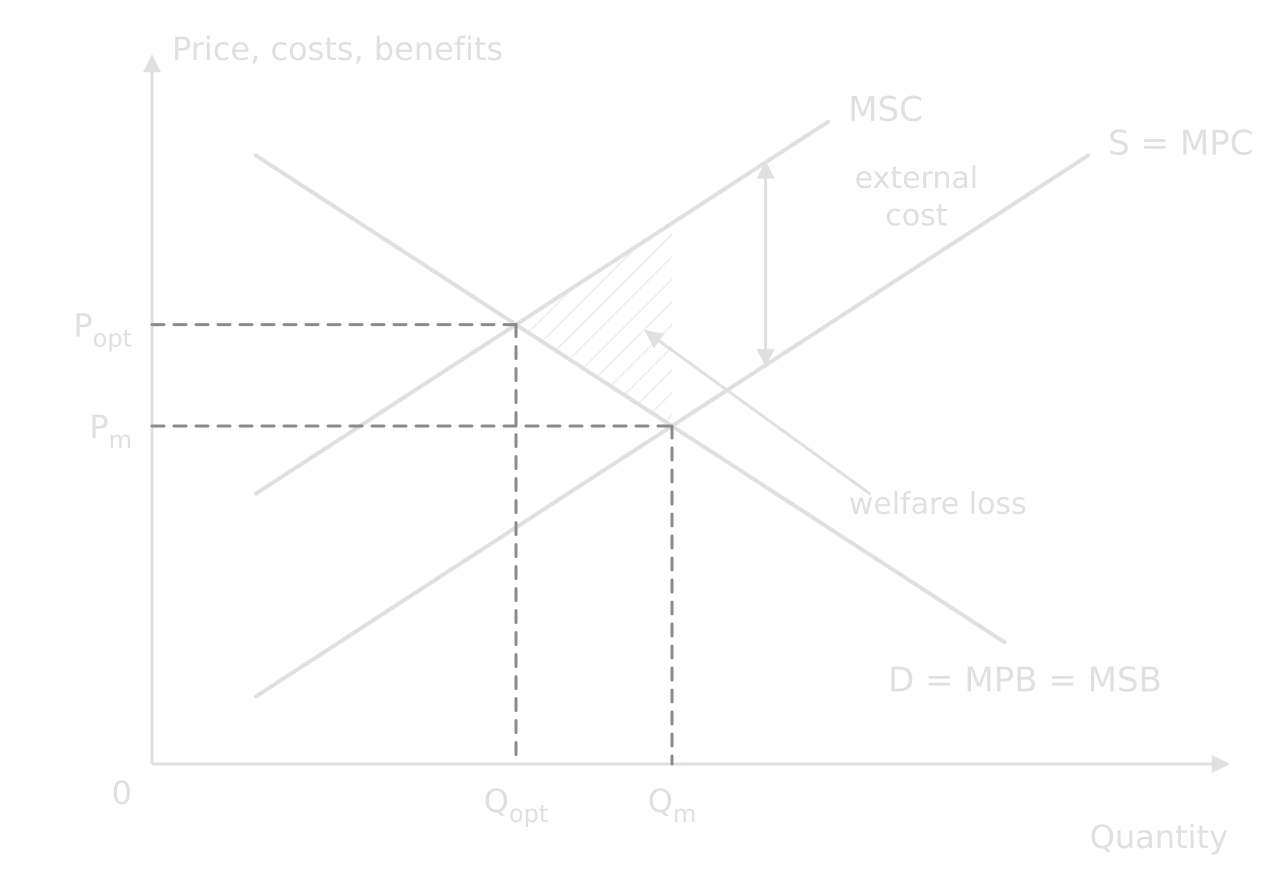
Negative externality of production
The externality diagrams use MPB, MSB, MPC and MSC. For a negative production externality, MSC lies above MPC by the external cost, and the market over-produces.
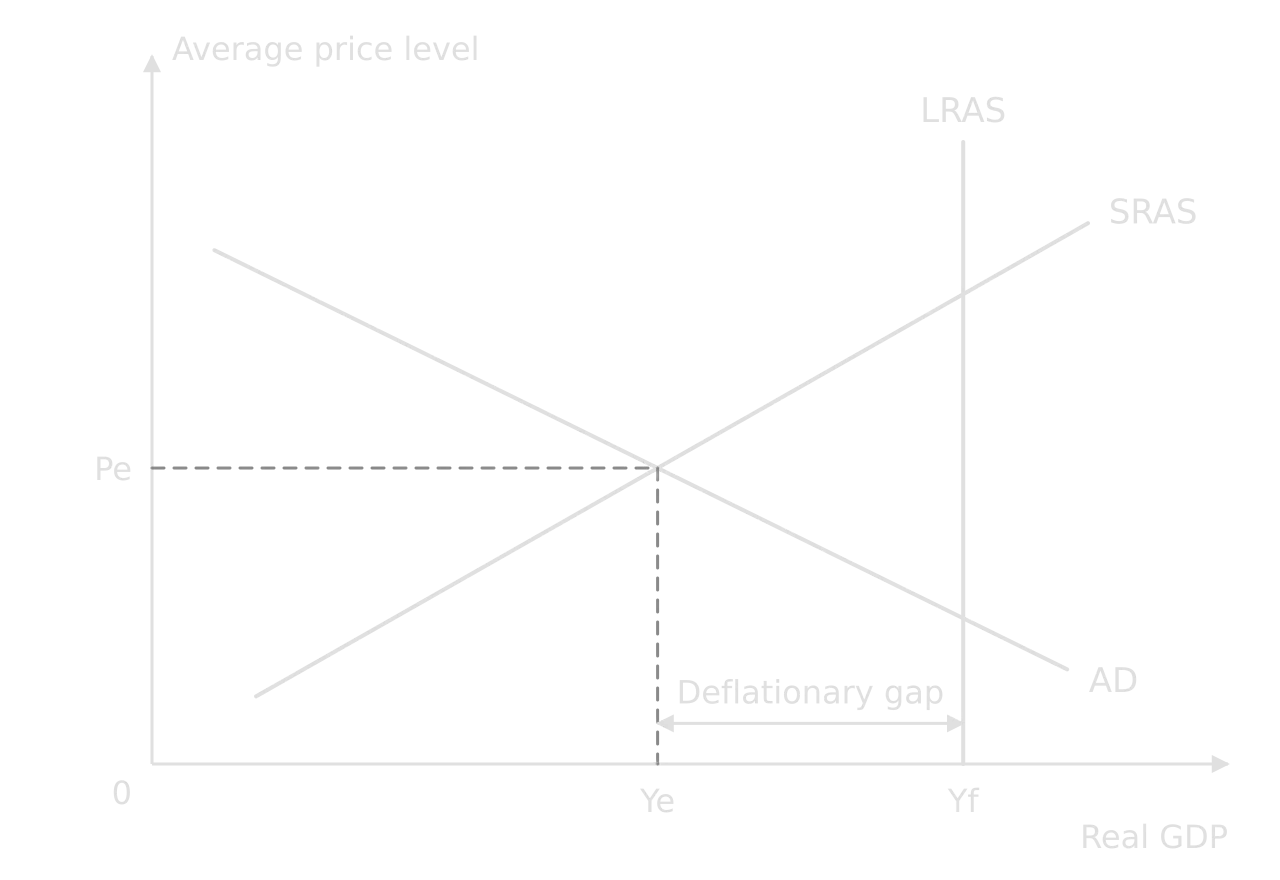
AD/AS and a deflationary gap
Macroeconomic diagrams use the average price level and real GDP. In the monetarist/new classical model, LRAS is vertical at full employment output Yf.

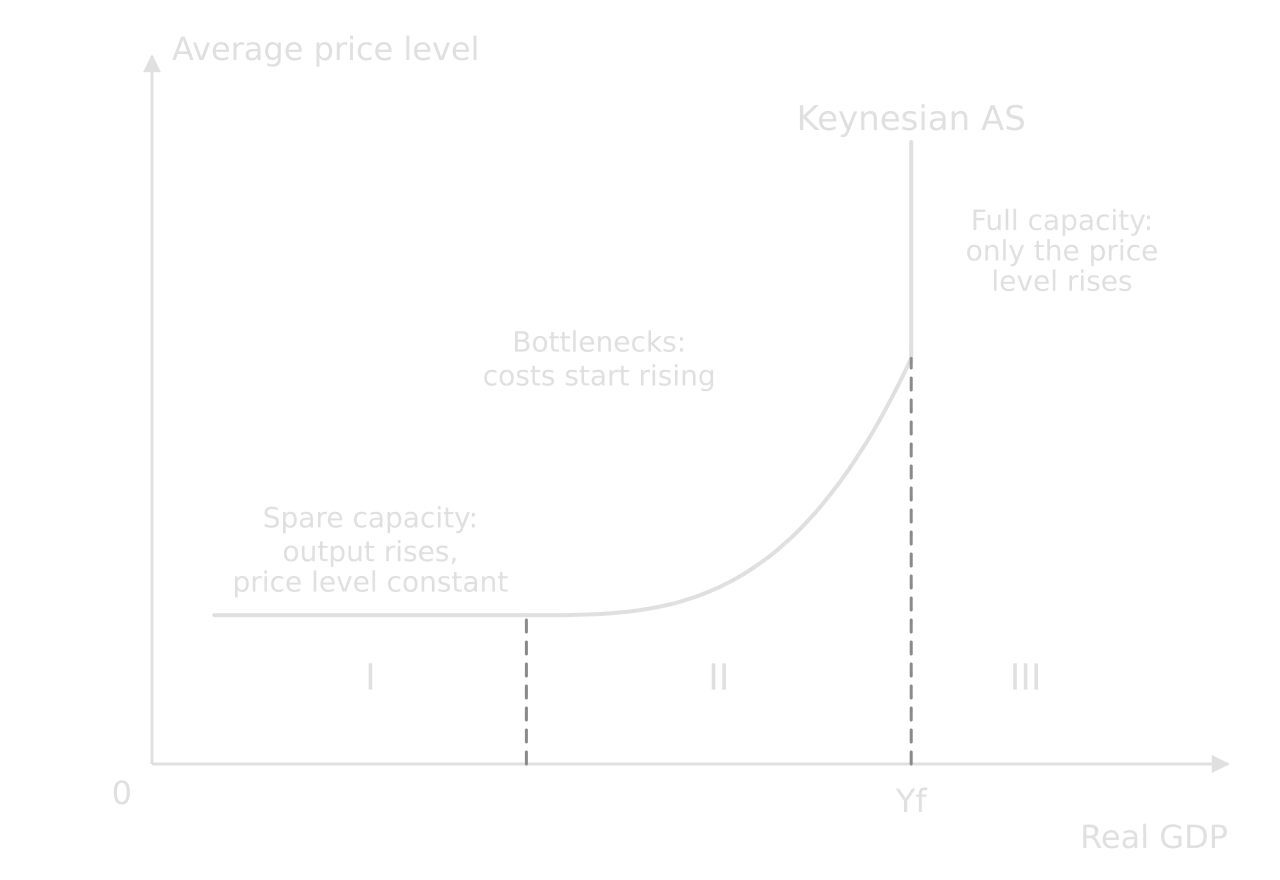
Keynesian aggregate supply
The Keynesian AS curve has three sections. Label each and the full employment level of output, Yf.

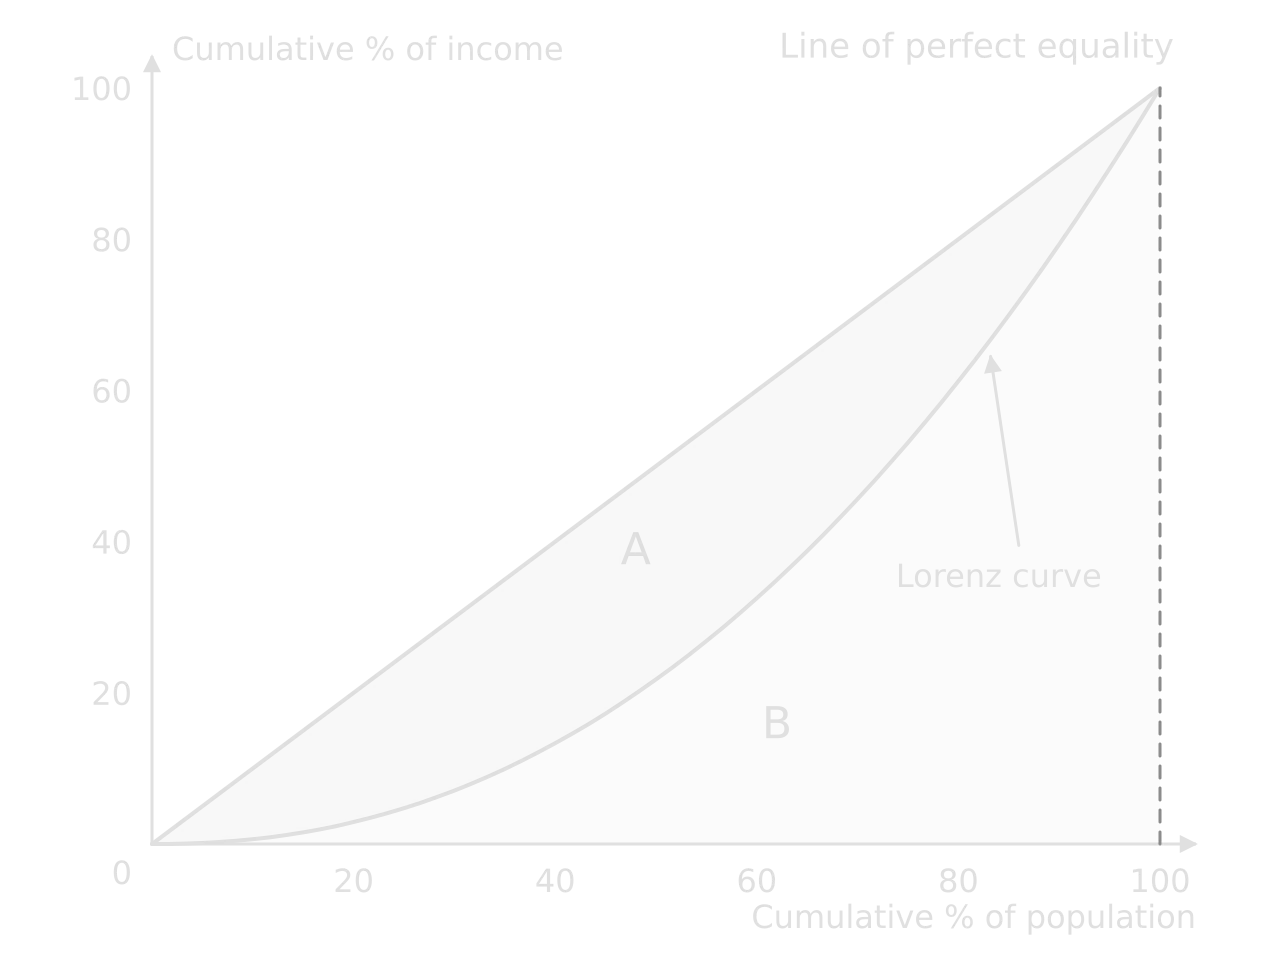
Lorenz curve
Cumulative percentages on both axes, the line of perfect equality as a diagonal, and the Lorenz curve below it. The further the curve sags, the more unequal the distribution.
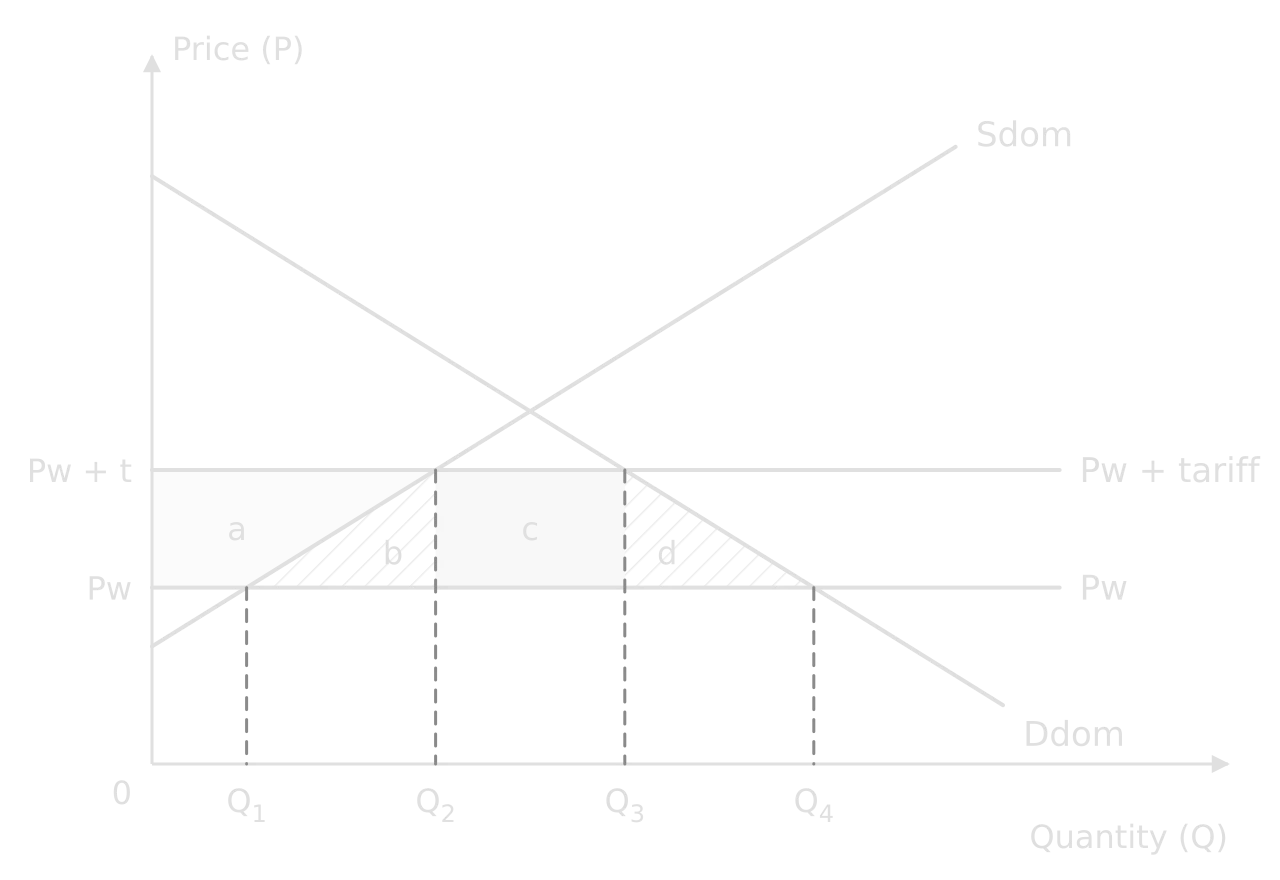
Tariff
Trade diagrams show domestic demand and supply with the world price as a horizontal line. A tariff raises the domestic price to Pw + tariff.

Exchange rate
An exchange rate is the price of one currency in terms of another. The y-axis is the price of the currency in another currency; demand comes from foreigners buying exports and assets, supply from residents buying imports and foreign assets.
Using real-world examples
Paper 1 part (b) asks for real-world examples, and the top band needs examples that are “developed” and that support the argument. Paper 2 part (g) needs the text and data instead, which play the same role. In both, an example is evidence: it shows that the theory explains something real, or that the real world differs from the model.
What a developed example looks like
Examples sit on a scale from generic to fully developed. Only the last step earns the top band.
Level | Example | What it does |
|---|---|---|
Generic | “Many countries use taxes to reduce smoking.” | Nothing: no country, no date, no result. |
Named | “Singapore uses road pricing.” | Shows awareness, but makes no argument. |
Partly developed | “Singapore introduced road pricing in 1975, and traffic fell.” | Gives context but not the link to theory. |
Developed and supporting the argument | “Singapore’s 1975 scheme cut morning-peak entries into the city centre by 76%, which shows that drivers respond to a charge for the external cost they impose; but charges have had to rise over time to keep speeds on target, which suggests demand at the peak is price inelastic.” | Names, dates and quantifies the case, links it to theory, and uses it to make an evaluative point. |
A useful test is to ask what the example proves. If it could be deleted without weakening the argument, it is decoration. A strong example is placed where it supports a specific claim: that a policy works, that its effect depends on elasticity, that one group gains and another loses.
Building an example bank
Examples are best collected through the course, not invented in the exam. A one-page bank per unit, with four to six cases, each with its date, two or three figures and the theory it illustrates, is enough to support most Paper 1 questions. Each case should be usable from more than one angle: the Singapore scheme supports answers on externalities, Pigouvian taxes, PED and equity.
Unit | Areas to cover with at least one example each |
|---|---|
Microeconomics | A tax on a demerit good; a subsidy; a price control; a negative externality and the policy used; a common pool resource; (HL) a firm with market power |
Macroeconomics | A recession and the policy response; a period of high inflation; a central bank’s interest rate decisions; fiscal stimulus; a supply-side reform; inequality and a policy to reduce it |
The global economy | A tariff or trade dispute; a trading bloc; a currency depreciation; a current account deficit; a development strategy in a named economically less developed country |
Summary
The command term sets the task and its depth: AO1 terms ask for knowledge, AO2 for explanation and analysis, AO3 for weighed judgment, AO4 for skills.
“Explain” needs a chain of reasons; “evaluate”, “discuss” and “to what extent” need arguments on both sides, weighing, and a conclusion.
A 2-mark definition is precise, includes every key qualifier, is not circular and adds a formula where one exists.
A diagram earns marks when it has a title, labelled axes and curves, equilibria on the axes, arrows for shifts and labelled areas, and when the text explains it step by step.
The axis labels depend on the diagram type: Price and Quantity for a market; Average price level and Real GDP for AD/AS.
A real-world example earns credit when it is named, dated, quantified and linked to the argument it supports.
Carry on with Economics in Augment
With a free account, Augment remembers where you stopped in the notes and which questions you have marked.