Explain and evaluate the main strategies for economic growth and development, from trade and market-based policies to aid, FDI and institutional change, and judge intervention against markets using real countries’ progress.
Each is in the Economics glossary, with every other term in the subject.
Aid given directly by one donor government to a recipient country, as opposed to multilateral aid, which is channelled through international organisations funded by many governments.
A loan made on terms more favourable than market loans, with a below-market interest rate, a long repayment period or a grace period, often given to developing countries as aid.
The conditions attached to loans from the IMF, the World Bank or other lenders, requiring the borrowing government to carry out specified policies, such as cutting a budget deficit or privatising firms.
The cancellation, reduction or rescheduling of a country's debts by its creditors, lowering the amount owed or the payments due so that resources can be used for development.
Longer-term assistance aimed at raising living standards and productive capacity, for example by funding schools, clinics, roads, water systems, agricultural research or government reforms.
A growth strategy in which the government encourages firms to produce for world markets, using a competitive exchange rate, export credit, tax incentives, special economic zones and investment in infrastructure and skills.
A certification system in which producers in developing countries receive a guaranteed minimum price and a premium for community projects when they meet labour, environmental and organisational standards.
Explain trade strategies for growth and development: import substitution, export promotion and economic integration.
Explain diversification and social enterprise as strategies, and the role of market-based policies: trade liberalisation, privatisation and deregulation.
Explain interventionist strategies: redistribution through taxes, transfers and minimum wages, and the provision of education, health care and infrastructure.
Explain the role of inward foreign direct investment, foreign aid, debt relief, NGOs and multilateral assistance from the World Bank and the IMF.
Explain how institutional change, including microfinance, mobile banking, women’s empowerment, reducing corruption and secure property and land rights, promotes development.
Draw and use diagrams from across the course (AD/AS, PPC, tariff, merit good, Lorenz curve) to explain the effects of a strategy.
Evaluate the strengths and limitations of each strategy, and of government intervention compared with market-oriented approaches.
Evaluate progress towards selected Sustainable Development Goals in two or more countries, and explain why progress differs.
A growth and development strategy is a set of policies that a government, often with outside help, uses to raise output and improve living standards. Strategies respond to the barriers that hold a country back: a strategy to diversify exports answers commodity dependence, a vaccination programme answers endemic disease, and land titling answers insecure property rights.
Every strategy is a choice about intervention. Some rely on markets, trade and private investment to raise
178 exam-style questions on this subtopic, written in the style of the IB papers. The first has its markscheme open. Counted on
The output an economy can produce depends on the quantity and quality of its factors of production.
Explain the four factors of production and the factor income earned by each.
10 marks
Answers may include:
Terminology: definitions of factors of production, land (natural resources: soil, minerals, forests, water), labour (human physical and mental effort used in production), capital (man-made goods used to produce other goods, such as machinery and infrastructure; also human capital), entrepreneurship (organizing the other factors and bearing risk); factor incomes: rent, wages, interest, profit.
Explanation: each factor is a scarce input combined in the production of goods and services; households own the factors and supply them to firms; in return they receive factor incomes: rent for land, wages for labour, interest for capital and profit for entrepreneurship; profit is a reward for risk-taking and innovation and can be negative; the quantity and quality of each factor determine the position of the PPC.
Diagram: a circular flow of income diagram showing factor services flowing from households to firms and factor incomes (rent, wages, interest, profit) flowing back; or a PPC showing how more or better factors shift the curve outward.
A maximum of [6] should be awarded if factor incomes are not explained, or if fewer than four factors are explained.
Markbands (best fit)
Level |
|---|
One of 60 short multiple-choice questions on 4.10. Pick an answer to see why it's right or wrong.
Which policy is a tool of export promotion?
The official deck for this part of the syllabus.
What is a growth and development strategy?
Why should a growth and development strategy be matched to a country's barriers?
With a free account, Augment remembers where you stopped and what you have practiced.
The situation in which individuals and firms, including those on low incomes, have access to useful and affordable financial services such as payments, savings, credit and insurance.
The transfer of resources, such as money, goods, technical help or concessional loans, from governments, international organisations or charities in richer countries to poorer countries to promote development or relieve suffering.
Short-term emergency assistance, such as food, water, shelter and medical care, given to save lives and reduce suffering after natural disasters, famines, epidemics or conflicts.
A strategy of protecting domestic industries from foreign competition with tariffs, quotas and other barriers, so that goods previously imported are produced at home instead.
An international institution, founded in 1944, that promotes global monetary and financial stability, monitors member economies and lends to countries facing balance of payments crises, usually with policy conditions.
Legally recognised and secure rights of individuals, families or communities to occupy, use, transfer and benefit from land, often shown by a registered title or certificate.
The provision of small loans, savings accounts, insurance and other financial services to people on low incomes who lack access to ordinary banks, often without collateral and through group lending.
Financial services such as storing money, sending and receiving payments, paying bills and saving, carried out through a mobile phone, often without a bank account and using local cash agents.
Aid, loans and technical support given to developing countries by international organisations funded by many member governments, such as the World Bank, the IMF and regional development banks.
A firm that owns or controls production in more than one country, for example through factories, mines, offices or subsidiaries abroad.
A not-for-profit organisation independent of government, such as a charity or community group, that works for social, humanitarian or development goals and is funded mainly by donations and grants.
Aid from governments and their agencies to developing countries and multilateral institutions whose main aim is economic development and welfare, given as grants or as loans on concessional terms.
Government policies that change the distribution of income or wealth, usually to reduce inequality, through progressive taxes, transfer payments, minimum wages and public services used mainly by lower-income groups.
A business whose main aim is a social or environmental goal, which earns most of its income by selling goods or services and reinvests most of its profit in that goal rather than paying it to owners.
A designated area of a country with its own, usually more liberal, rules on trade, tax, customs and regulation, often with ready-built infrastructure, set up to attract investment, especially for export production.
Market-oriented reforms, such as cutting government spending and subsidies, devaluing the currency, liberalising trade and prices and privatising state firms, required by the IMF and World Bank as loan conditions, especially in the 1980s and 1990s.
Aid that must be spent on goods and services from the donor country, or on projects the donor chooses, rather than wherever the recipient can obtain the best value.
A set of market-oriented policy recommendations for developing countries, associated with the IMF, the World Bank and the US Treasury from the late 1980s, including fiscal discipline, trade liberalisation, privatisation and deregulation.
The process of increasing women's ability to make choices and control their own lives, through equal access to education, health care, work, finance, property and political participation, and changes in laws and norms.
An international institution, founded in 1944, that provides long-term loans, grants and technical advice to developing countries for development projects and policy reforms, with the aim of reducing poverty.
Strategies can be grouped by who carries them out and by how they work. The grouping matters for evaluation, because market-oriented and interventionist strategies have different strengths and different risks.
Group | Strategies | Main barrier addressed | Diagram that helps |
|---|---|---|---|
Trade strategies | Import substitution, export promotion, economic integration | Small domestic market, lack of market access, commodity dependence | Tariff diagram; AD/AS with LRAS |
Diversification | Developing new industries and exports | Dependence on one or a few primary commodities | PED/PES diagram; PPC |
Social enterprise | Businesses with social goals, fair trade | Lack of services for the poor; low producer incomes | Market diagram |
Market-based policies | Trade liberalisation, privatisation, deregulation | Inefficient state firms, red tape, protection | AD/AS with LRAS; free-trade diagram |
Interventionist policies | Redistribution; education, health and infrastructure | Inequality, low human capital, infrastructure gaps | Lorenz curve; merit good diagram; LRAS |
Foreign capital | Inward FDI; foreign aid; debt relief; multilateral loans | Low saving, foreign exchange gap, indebtedness | PPC; poverty cycle; AD/AS |
Institutional change | Microfinance, mobile banking, women’s empowerment, anti-corruption, property and land rights | Weak institutions, gender inequality, exclusion from finance | Poverty cycle; LRAS |
Trade strategies decide how an economy relates to world markets. In the decades after 1950, many developing countries chose to protect domestic industry from imports; from the 1960s a smaller group, mostly in East Asia, chose to push their firms into export markets. The contrast between the two is one of the clearest natural experiments in development economics.
The idea is that a developing country cannot build manufacturing while it faces competition from established foreign firms. Protection gives domestic infant industries time to grow, learn and reach economies of scale, creates industrial jobs, saves foreign currency spent on imports and reduces dependence on primary exports, whose prices are volatile. The strategy was used widely in Latin America, South Asia and Africa from the 1950s to the 1980s.
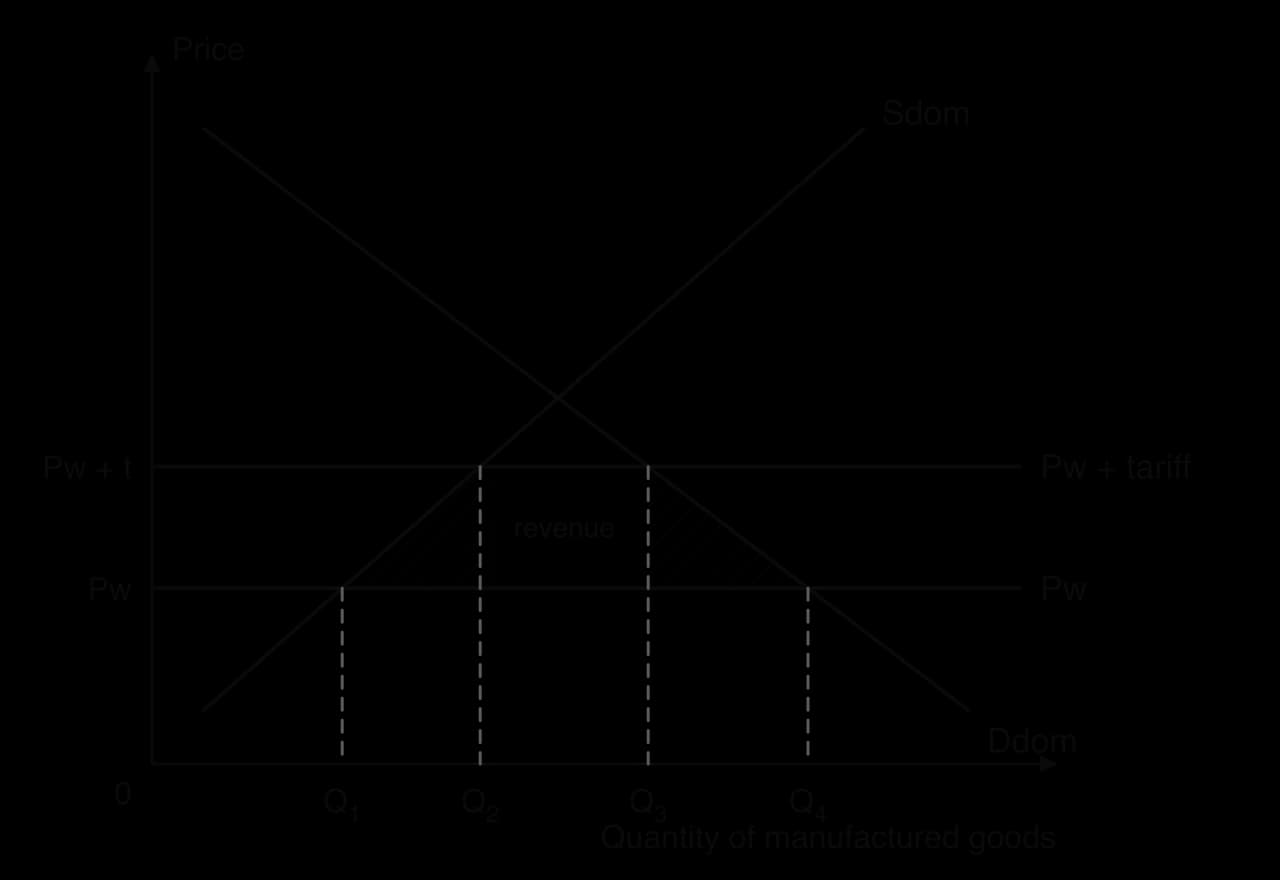
The tariff diagram shows the mechanism. Before protection, domestic consumers buy Q₄ at the world price Pw, of which Q₁ is produced at home and Q₁–Q₄ is imported. The tariff raises the price inside the country, so domestic firms expand output to Q₂, consumers cut their purchases to Q₃, and imports fall to Q₂–Q₃. The government gains tariff revenue, domestic producers gain, and consumers lose. The two hatched triangles are a welfare loss: inefficient domestic production replaces cheaper imports, and some consumers stop buying.
Creates manufacturing jobs and industrial skills, and can start the change from an agricultural to an industrial economy.
Saves foreign currency and can reduce a current account deficit in the short run.
Tariffs raise government revenue, which is easy to collect when other taxes are hard to enforce.
Can protect genuinely new industries until they become competitive, as the infant industry argument suggests.
Inefficiency. Protected firms face little competition, so they have weak incentives to cut costs or improve quality. Infant industries often never "grow up" and lobby to keep protection.
Small markets. A domestic market in a poor country is too small for firms to reach economies of scale, so unit costs stay high.
Higher costs for others. Consumers pay more, and firms that use protected inputs (steel, machinery) become less competitive, including exporters.
Foreign currency problems persist. Domestic factories still need imported machinery, parts and fuel, so the foreign exchange gap often reappears.
Rent-seeking and corruption. Import licences and quotas are valuable, so firms compete for political favour rather than customers.
Retaliation and lost export markets. Trade partners may respond with their own barriers.
India followed import substitution with heavy state planning from the 1950s to 1991. Annual GDP growth averaged about 4% and per capita income growth about 1.3% over these decades, far below East Asia’s rates. A balance of payments crisis in 1991, when foreign reserves covered only about three weeks of imports and India had to pledge its gold reserves to obtain emergency loans, led to the end of most licensing and a sharp move towards trade liberalisation.
Sources: Wikipedia, "Economic liberalisation in India" (2026).
Export promotion turns the small-market problem around. Instead of producing only for a poor domestic market, firms sell to the whole world, so they can reach economies of scale. World competition forces them to become efficient, and contact with foreign buyers brings new technology, designs and management methods. Export earnings pay for imported capital goods, which raises productive capacity further.
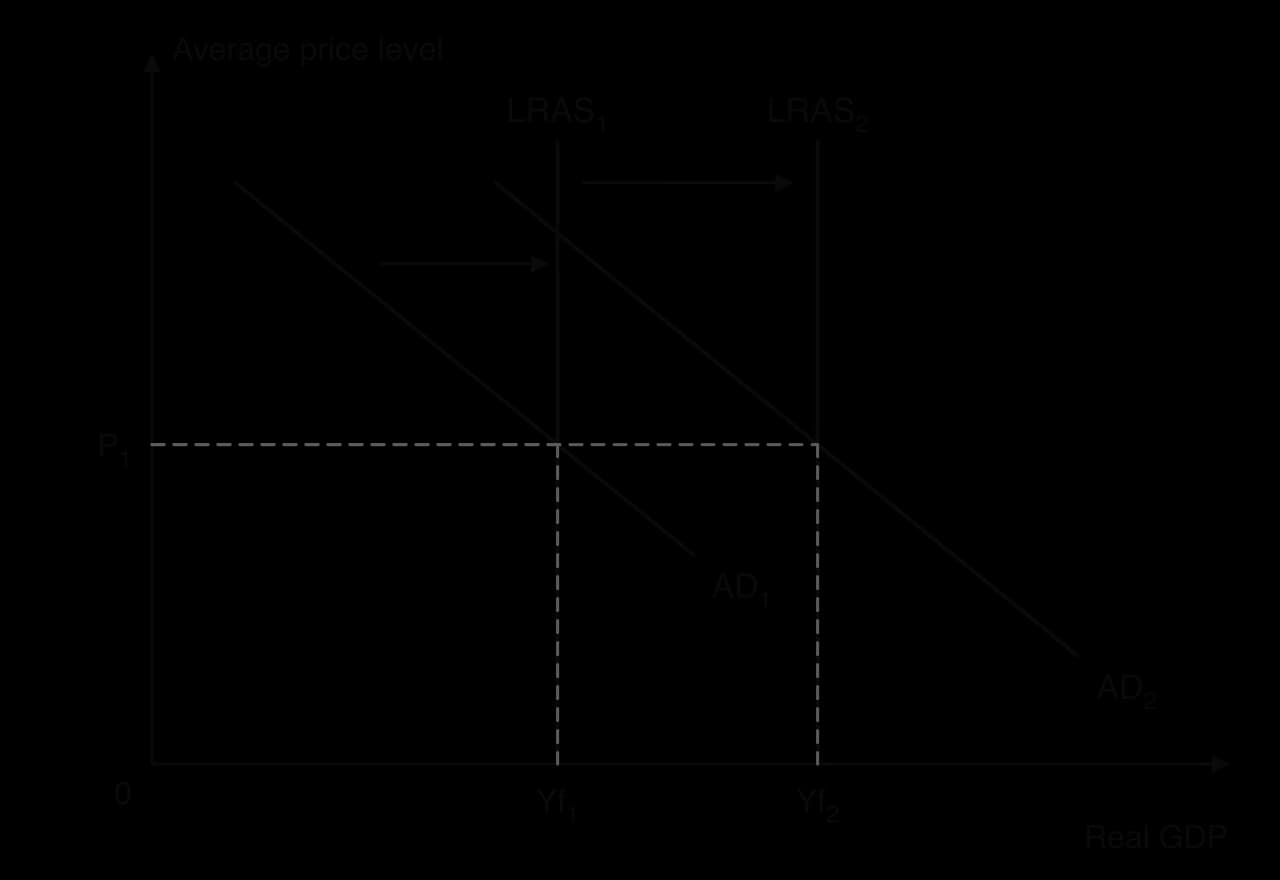
The AD/AS diagram shows why export-led growth can be fast and sustainable at the same time. Exports are a component of aggregate demand, so growing exports shift AD to the right. The investment, technology and skills that export industries bring shift LRAS to the right as well. If the two move together, real GDP rises from Yf₁ to Yf₂ without inflation, as happened in South Korea, Taiwan and later China for long periods.
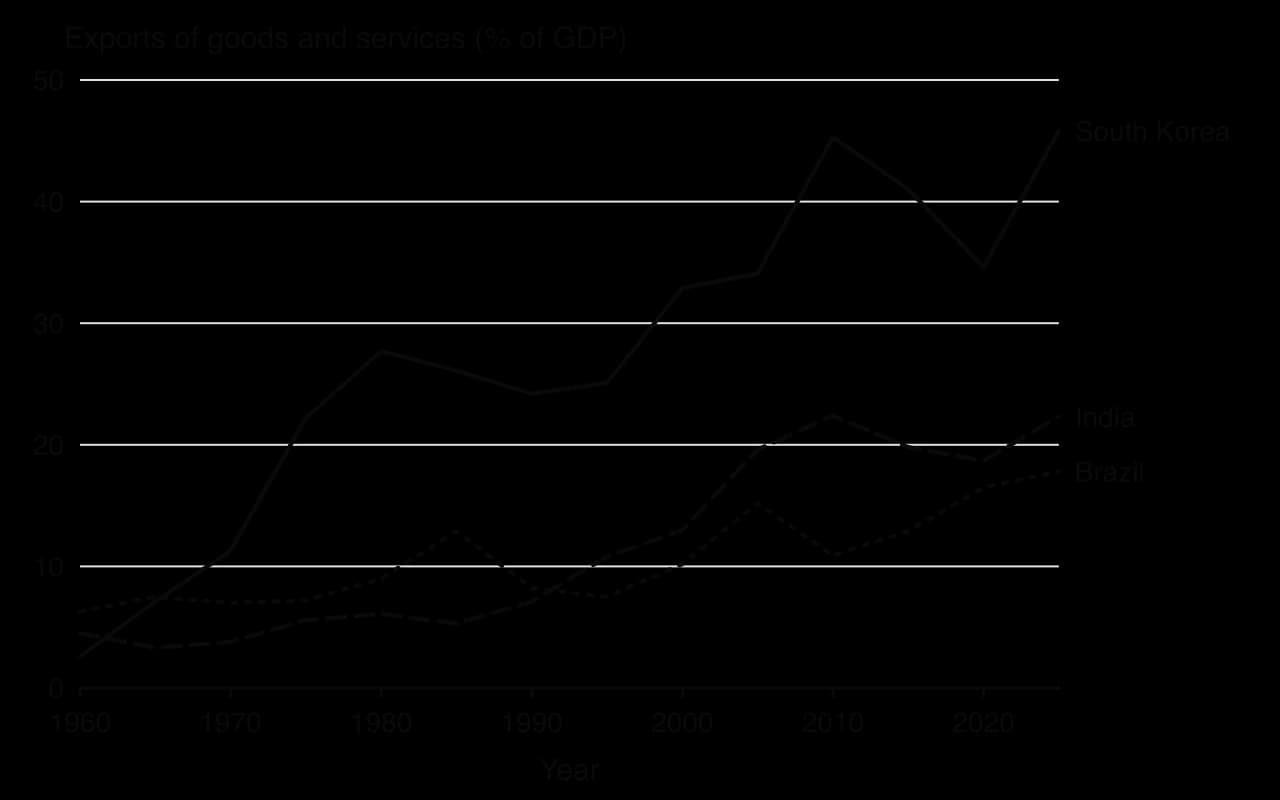
South Korea is the classic case. After a period of import substitution in the 1950s, the government under Park Chung-hee from the early 1960s supported labour-intensive manufactured exports, such as textiles, which reached 41% of exports by 1965. From 1973 state banks and a National Investment Fund directed credit to heavy industries, including steel, shipbuilding, electronics and petrochemicals. Exports rose from under 3% of GDP in 1960 to over 45% in 2025.
South Korea’s outcome contrasts sharply with Ghana’s. In 1960 South Korea’s real GDP per capita was slightly lower than Ghana’s, both at a little over $1 000 in constant 2015 dollars. By 2024 South Korea’s was about $37 000 and Ghana’s about $2 200.
Sources: World Bank, WDI NY.GDP.PCAP.KD (2026); Wikipedia, "Economy of South Korea" (2026).
 YouTube
Special economic zones are a common tool of export promotion. China’s first SEZ in Shenzhen (1980) helped transform a fishing town into a manufacturing city. Ethiopia opened the Hawassa Industrial Park in July 2016 at a cost of more than $300 million, with factories making clothing for export; employment peaked at over 35 000 workers. The park suffered when the United States removed Ethiopia from the duty-free African Growth and Opportunity Act (AGOA) programme from 2022 over human rights concerns during the war in northern Ethiopia, and some factories closed. The episode shows how export promotion depends on market access that other countries control.
Sources: Wikipedia, "Hawassa Industrial Park" (2026).
Access to world demand, so firms reach economies of scale and the economy is not limited by low domestic incomes.
Competition and contact with foreign buyers raise efficiency and bring technology and skills.
Export earnings provide foreign currency for imported capital goods and reduce the need to borrow.
Labour-intensive exports create many jobs, often for women, which raises incomes and empowerment.
Dependence on world demand. A global recession, or a trading partner’s tariffs, hits exports hard.
Protectionism abroad. Rich countries may restrict imports of the goods poor countries make best, such as clothing and processed food.
Low wages and poor conditions. Competing on low labour costs can mean long hours, weak safety and suppressed unions, at least in early stages.
A narrow export base. Promotion of a few products can recreate dependence, now on assembly work for foreign firms.
Environmental costs. Rapid industrial growth for export can bring heavy pollution, a threat to sustainability.
It is harder today. The East Asian economies grew when world trade was expanding and rules allowed more state support; today many export subsidies break World Trade Organization rules, and manufacturing is increasingly automated.
Import substitution | Export promotion | |
|---|---|---|
Orientation | Inward: produce for the domestic market | Outward: produce for world markets |
Main tools | Tariffs, quotas, import licences, an overvalued currency | Competitive exchange rate, export credit, tax incentives, SEZs, infrastructure |
Scale | Limited by the domestic market | Access to world demand |
Competition | Weak; protected firms | Strong; firms must match world prices and quality |
Main risk | Inefficiency, rent-seeking, repeated foreign exchange shortages | Dependence on world demand and on foreign market access |
Examples | India 1950s–1991; much of Latin America 1950s–1980s | South Korea and Taiwan from the 1960s; China after 1978; Viet Nam after 1986 |
Economic integration means joining with other countries in agreements that reduce trade barriers, from free trade areas to customs unions and common markets. For developing countries, regional integration enlarges the market that firms can sell to without tariffs, encourages investment by firms that want to serve the whole region, and can lower trade costs for landlocked members by improving transit rules and shared infrastructure.
The African Continental Free Trade Area, which began trading in 2021, aims to cut tariffs between most African countries, where trade among neighbours has historically been low and costly. Integration can help small economies reach economies of scale and build regional value chains, for example in processing food or assembling vehicles for a regional market.
Its limitations are that member countries often produce similar primary goods, so there is little to trade at first; that poor infrastructure and slow border procedures can matter more than tariffs; that benefits tend to flow to the larger and more industrialised members; and that trade diversion can replace cheaper imports from outside the bloc with dearer ones from inside it. Integration works best alongside investment in roads, ports and customs.
Diversification means widening the range of goods and services that an economy produces and exports, so that it relies less on one or a few primary commodities. It answers the barrier of commodity dependence directly: if copper, oil or cocoa is only one export among many, a fall in its price no longer causes a national crisis.
Diversification can be horizontal (adding new primary products or services, such as tourism) or vertical (processing the existing commodity, for example cutting and polishing diamonds or making chocolate rather than exporting cocoa beans). Vertical diversification adds value at home and builds manufacturing skills; horizontal diversification spreads risk.
Governments promote diversification with infrastructure, education and training, special economic zones, tax incentives for new industries, and sometimes protection for new sectors. Commodity revenue can be used to finance this, which is one reason resource-rich countries set up sovereign wealth funds.
Strengths: reduces volatility of export earnings and government revenue; creates more and more varied jobs; reduces the risk of Dutch disease; builds skills that support further growth.
Limitations: it is slow and costly; new industries may not be competitive without lasting support (a form of government failure); a strong currency from commodity exports makes new exports uncompetitive; and the country may lack the skills, power and transport that new industries need. The government must also guess which industries can succeed, and it may guess wrongly.
A social enterprise sits between a charity and a profit-maximising firm. Like a firm, it sells goods or services and must cover its costs, so it does not depend on donations year after year. Like a charity, it puts its social goal first. This lets it serve people that profit-seeking firms ignore, because they are too poor, and that governments fail to reach.
Aravind Eye Hospitals, founded in 1976 in Madurai, India, by Dr Govindappa Venkataswamy, is a well-known example. It treats poor patients free or at heavily subsidised prices and covers the cost from paying patients, using high volumes and standardised surgery to keep costs low. Its sister firm Aurolab began making intraocular lenses, used in cataract surgery, for about $10 when imported ones cost $60–$100, and now produces about two million a year. Aravind had performed four million surgeries by 2012.
Sources: Wikipedia, "Aravind Eye Hospitals" (2026).
Fair trade schemes such as Fairtrade apply a similar idea through markets for coffee, cocoa, tea and bananas. Consumers who care about producers’ incomes pay more for certified goods, and part of the extra reaches farmers through a minimum price and a premium. Supporters see this as a way to share the gains from trade more fairly; critics point out that only a small share of farmers benefit, that certification is costly, and that a guaranteed price can encourage more production of a crop whose world price is already low.
Strengths: sustainable without permanent aid; innovative, often finding low-cost ways to serve the poor; can work where the state is weak; often employs and trains local people, including women.
Limitations: usually small relative to national needs; access to finance is hard because returns to investors are low; may depend on exceptional founders; can be undercut by subsidised state services or by profit-seeking firms; and it cannot replace public investment in schools, clinics and roads.
Market-based strategies aim to raise growth by letting markets allocate resources more freely. They draw on the same ideas as market-based supply-side policies in macroeconomics: competition, incentives and private ownership raise efficiency, and that raises potential output. From the 1980s these policies were promoted by the World Bank, the IMF and many donor governments as a package often called the Washington Consensus.
Trade liberalisation removes or reduces tariffs, quotas and other barriers to trade. It allows a country to specialise according to comparative advantage, gives consumers and firms cheaper imports (including capital goods), and exposes domestic firms to competition, which pushes them to become more efficient. It is the opposite of import substitution.
India’s 1991 reforms are an example. Tariffs were capped at 150% and then cut further, most industrial licensing was abolished, the rupee was devalued and foreign investment was opened up. Growth accelerated in the following decades, exports rose from about 7% of GDP in 1990 to over 20% from the mid-2000s, and extreme poverty fell. Critics link the reforms to rising inequality and to distress among farmers, and point out that growth had already begun to rise in the 1980s.
Sources: Wikipedia, "Economic liberalisation in India" (2026); World Bank, WDI NE.EXP.GNFS.ZS (2026).
The limitations of trade liberalisation are that inefficient domestic firms close quickly and their workers may not find new jobs, so structural unemployment rises; that government revenue from tariffs is lost; that the country may be locked into exporting primary products if it liberalises before building other industries; and that cheap imports can hurt small farmers when rich countries subsidise their own agriculture.
Privatisation transfers state-owned enterprises to private owners. In many developing countries, state firms in telecommunications, electricity, banking and mining were overstaffed, made losses that the budget had to cover, and provided poor service. Private owners have a profit incentive to cut costs and invest, and the sale raises revenue for the government.
Ethiopia shows a gradual approach. Its state telecoms firm, Ethio Telecom, held a monopoly until a private consortium led by Safaricom began operating in October 2022; in 2024 Ethio Telecom became a share company and announced the sale of a 10% stake to citizens. Telecoms competition elsewhere in Africa has cut prices and spread mobile phones and mobile money, which shows the potential gains.
Sources: Wikipedia, "Ethio telecom" (2026).
Privatisation has other risks. Firms may be sold cheaply to politically connected buyers, as happened in several transition economies in the 1990s. Private owners may stop serving poor or rural customers who are unprofitable, which harms equity. And the sale revenue is a one-off, while the state may lose a stream of profits.
Deregulation removes rules that restrict how firms operate or who may enter a market: licences to start a business, price controls, restrictions on foreign ownership, or state monopolies over buying crops. Lower barriers to entry encourage new firms and competition and can draw the informal economy into the formal one.
Viet Nam’s Đổi Mới ("renovation") reforms from 1986 are an example of deregulation combined with continued state control in key sectors. Farmers were allowed to sell their surplus on markets, private firms were legalised and foreign investment was invited. Viet Nam became one of the fastest-growing economies in the world and sharply reduced extreme poverty, from 43.3% of the population in 2002 to 1.6% in 2022 at the $3.00-a-day line.
Deregulation can go too far. Removing financial regulation can lead to risky lending and banking crises, as several East Asian economies found in 1997; removing labour and environmental rules can harm workers and the environment. The aim is usually better regulation, not none.
Strengths: raise efficiency through competition and incentives; attract foreign investment; reduce the budget burden of loss-making state firms; reduce opportunities for corruption tied to licences and quotas.
Limitations: markets fail, so they under-provide education, health care and infrastructure, and ignore externalities; gains may go mainly to those already rich, increasing inequality; reforms carried out quickly in countries with weak institutions can lead to monopoly and asset-stripping; and short-run costs (unemployment, higher prices for formerly subsidised services) fall on the poor.
The record of the Washington Consensus in the 1980s and 1990s was mixed. Many countries that adopted it, especially in Latin America and sub-Saharan Africa, saw slow growth and rising inequality in that period, while the fastest-growing economies, in East Asia, combined openness with a strong state role. Most economists now see market-based reforms as useful but insufficient on their own.
Interventionist strategies use the state to change outcomes that markets produce. Redistribution moves income from richer to poorer households. It promotes development directly, because it reduces poverty and inequality, and it can support growth if it lets poor households invest in health, education and small businesses.
Progressive taxes, such as income taxes with rising marginal rates, take a larger share of higher incomes. In many developing countries income tax reaches few people, because most work informally, so governments rely on indirect taxes such as VAT, which tend to be regressive. Broadening the tax base, taxing property and land, and reducing exemptions for the rich can make taxes fairer and raise the revenue needed for services.
Transfer payments are payments from the government for which no good or service is given in return: pensions, child benefits and cash transfers to poor families. Conditional cash transfers, which pay families on condition that children attend school and clinics, combine redistribution with investment in human capital. Mobile money has made transfers cheaper and harder to steal, because payments go directly to recipients’ phones.
A minimum wage raises the incomes of low-paid formal workers. In a developing country its reach is limited, because most workers are informal or self-employed, and a minimum wage set too high may reduce formal employment and push more workers into the informal economy. Set at a moderate level and enforced, it can reduce exploitation in sectors such as garment manufacturing.
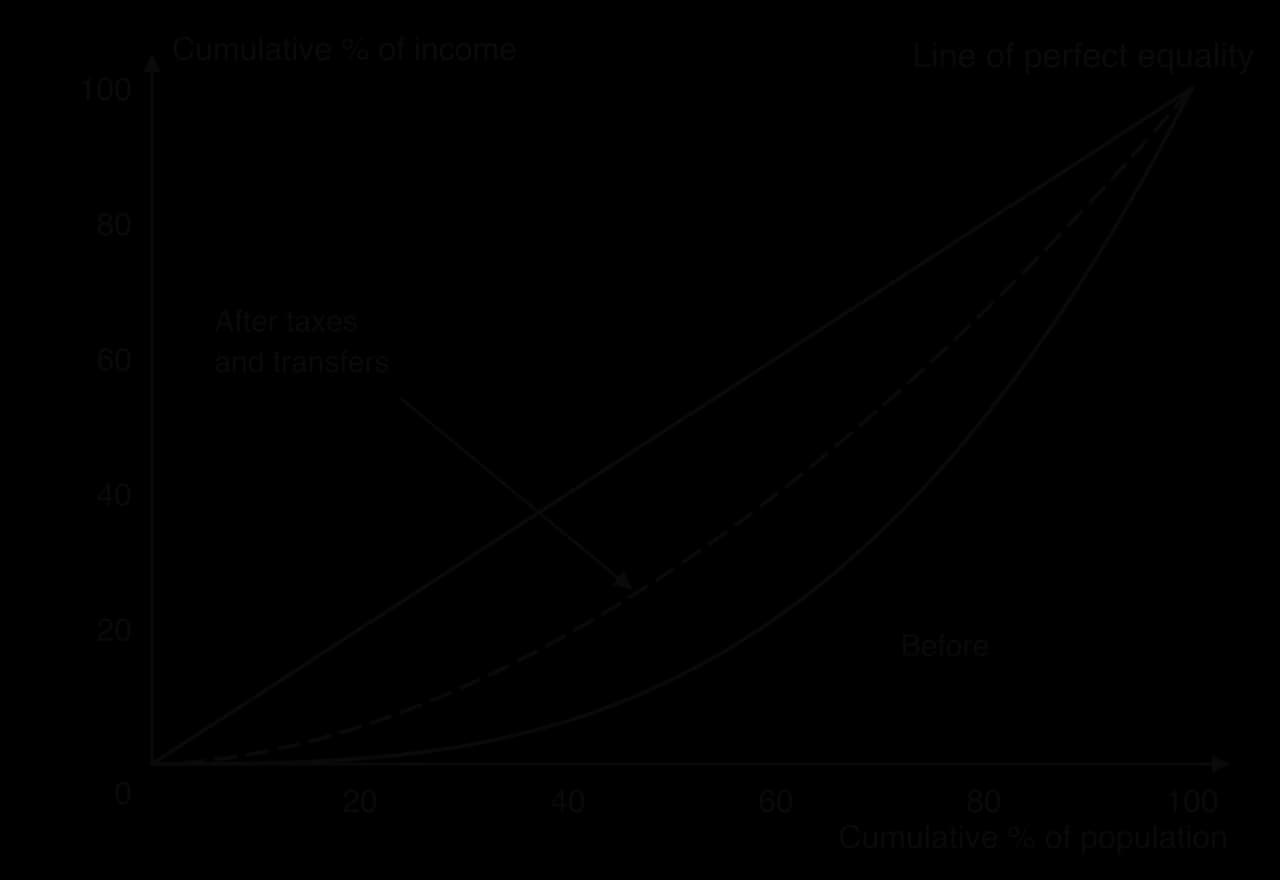
The Lorenz curve diagram shows the effect of redistribution. Before taxes and transfers, the poorest 40% of the population receive a small share of income, so the curve bows far below the line of perfect equality. After progressive taxes and transfers, the curve moves closer to the line and the Gini coefficient falls.
Strengths: reduces poverty quickly; spreads the gains of growth more widely; can raise human capital when transfers are tied to schooling and health; can reduce social conflict and so support stable growth.
Limitations: a narrow tax base limits how much can be redistributed; high taxes can reduce incentives to work, invest and declare income; transfers need administrative capacity and are open to corruption and mis-targeting; minimum wages miss informal workers; and redistribution alone does not raise productive capacity.
Governments provide or subsidise education, health care and infrastructure because markets under-provide them. These are the strategies most directly aimed at the human capital loop of the poverty cycle and at raising potential output.
Education and health care are merit goods with positive consumption externalities. An educated worker raises the productivity of colleagues, spreads new ideas and is more likely to keep their family healthy; a vaccinated child protects others from disease. Individuals consider only their private benefits, and poor households cannot afford even those, so the market provides less than the socially optimal amount.
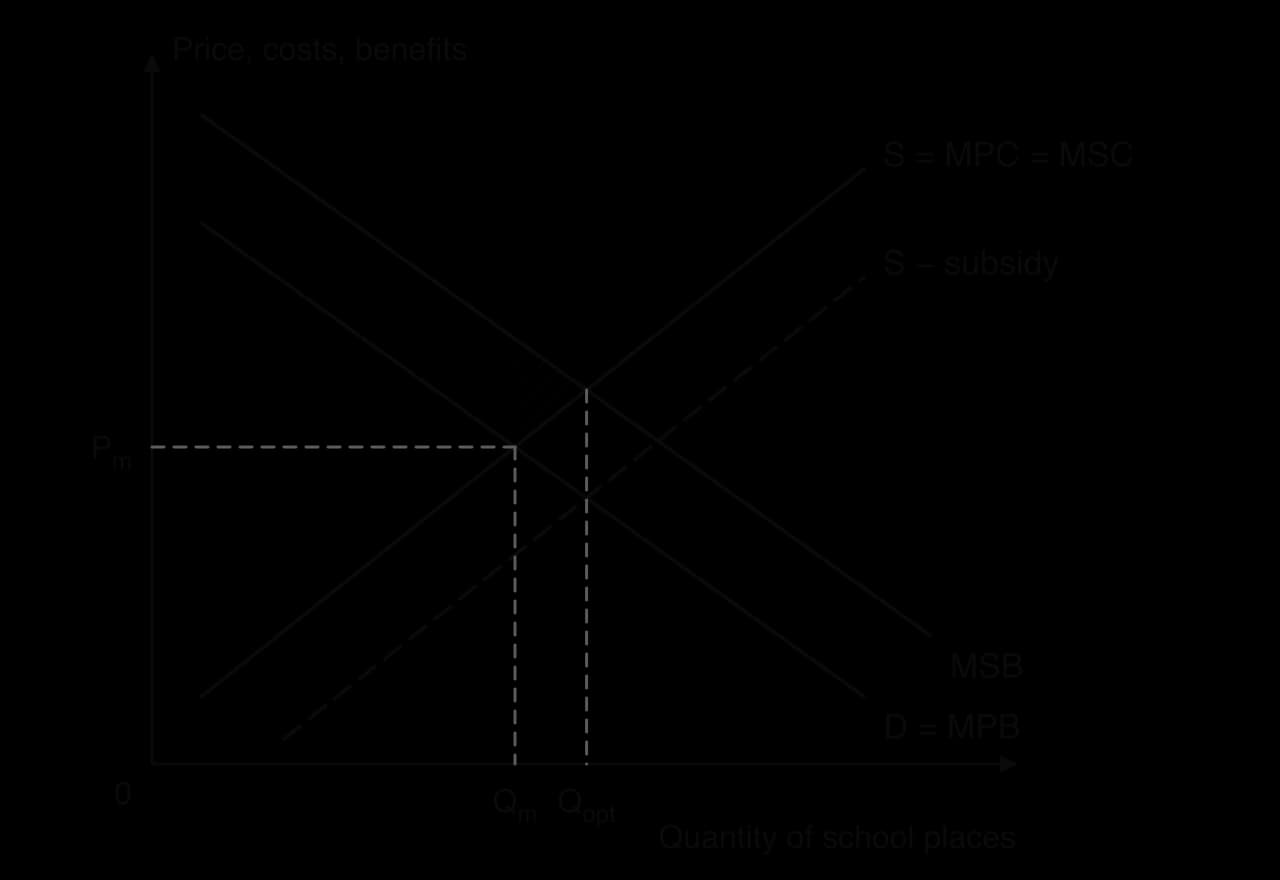
The diagram shows the market failure and the policy. Without intervention, places are provided where MPB meets supply, at Qm. The socially optimal quantity is Qopt, where MSB meets marginal social cost, so the hatched triangle between MSB and the supply curve from Qm to Qopt is the welfare loss. A subsidy equal to the vertical distance between S and S − subsidy lowers the price that families pay, raising the quantity to Qopt. Direct provision, free at the point of use, can achieve the same result.
Evidence shows large returns to health programmes. Bangladesh cut its under-5 mortality rate from 85.5 to 30.5 deaths per 1 000 live births between 2000 and 2024, helped by vaccination, oral rehydration, community health workers and family planning, much of it delivered with NGOs. Programmes against malaria, such as insecticide-treated bed nets, and the provision of antiretroviral drugs for HIV have also saved millions of lives at low cost per year of life gained.
Sources: UN IGME via World Bank WDI SH.DYN.MORT (2026).
The limitations are cost, time and quality. Building schools is not enough if teachers are absent or poorly trained; many children complete primary school without learning to read well. Health services need staff, medicines and supply chains. Results, especially from education, take a generation to appear in productivity, while the costs appear in the budget immediately. And free services may still be out of reach if families must pay for uniforms, transport or the income a working child would have earned.
Infrastructure includes energy, transport, telecommunications, and clean water and sanitation. It raises productivity across the whole economy: reliable power lets factories run, roads let farmers reach markets, telecommunications cut the cost of information, and clean water reduces disease. Because infrastructure is expensive, long-lived and creates large positive externalities, governments usually provide or finance it, often with loans from multilateral banks or with private partners.
On an AD/AS diagram, infrastructure spending first raises AD (government spending is a component of AD) and, once complete, shifts LRAS to the right. The risks are high costs, projects chosen for political reasons or for the contracts they generate, poor maintenance, and debt, especially when projects are financed by foreign borrowing and do not raise exports enough to repay it, as in Zambia’s case.
Foreign direct investment (FDI) is investment by a firm in one country in productive assets in another, such as building a factory or buying a controlling stake in a local firm. The firms that make it are multinational corporations (MNCs). Inward FDI can fill two gaps that keep poor countries poor: a saving gap (too little domestic saving to finance investment) and a foreign exchange gap (too little foreign currency to import capital goods).
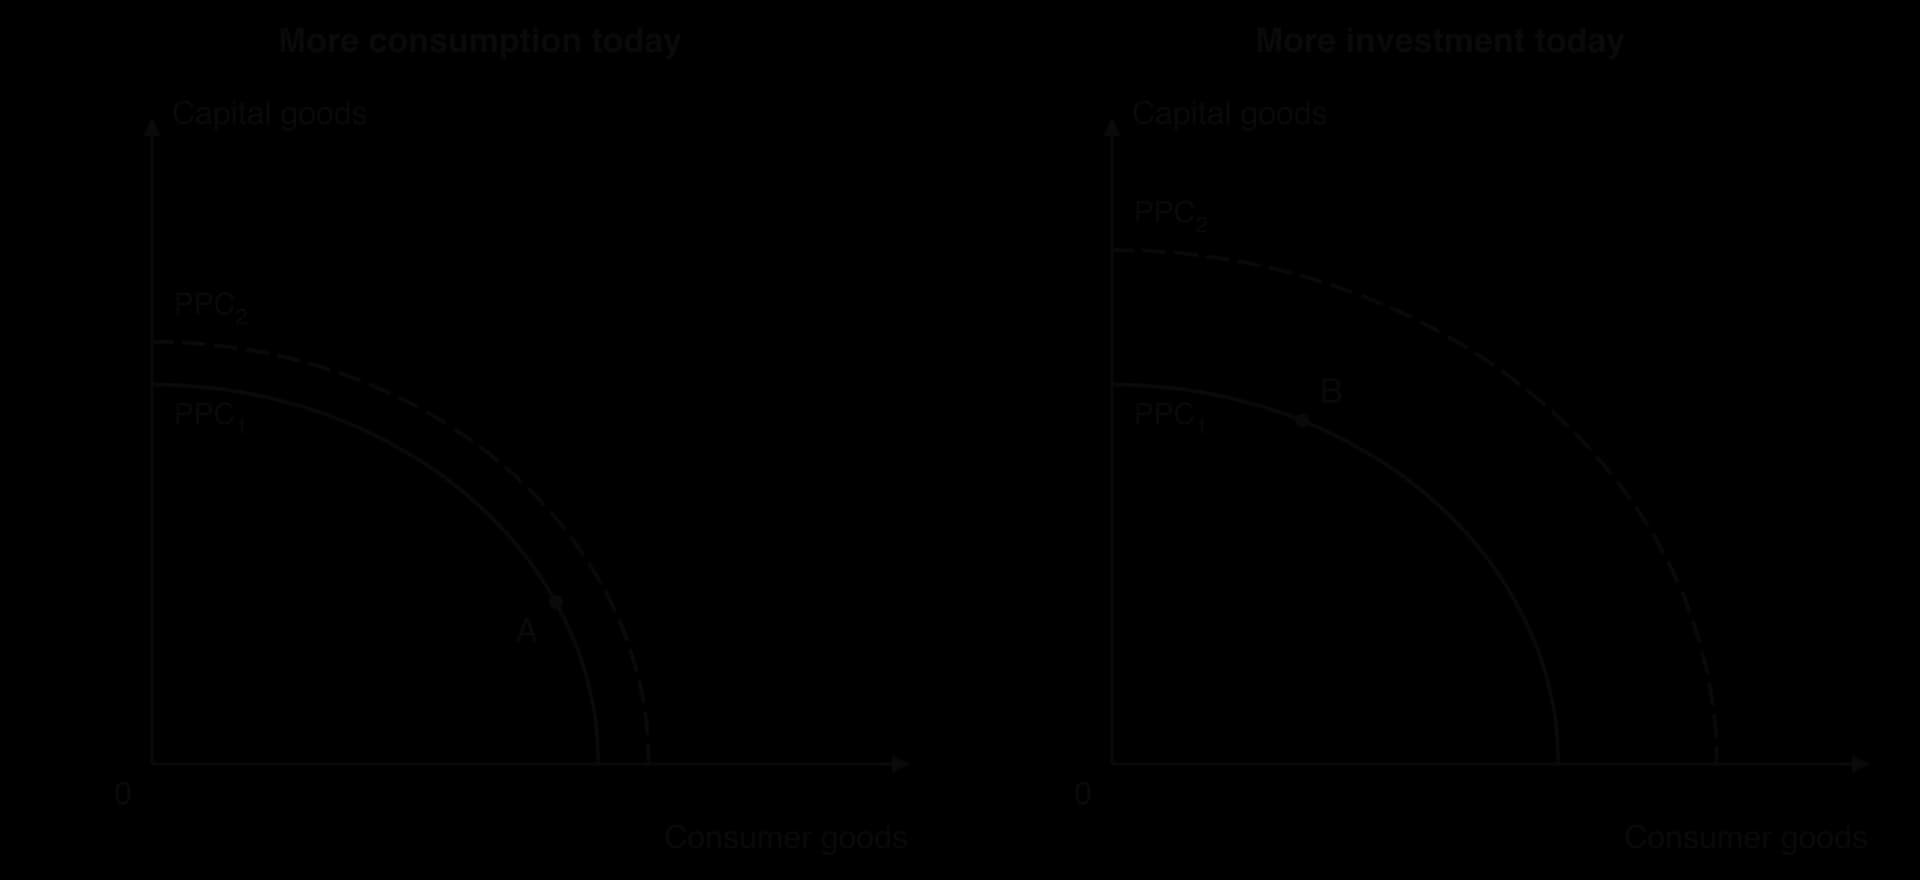
The PPC diagrams show why investment matters for growth. A country that produces mostly consumer goods today (point A) adds little to its capital stock, so its PPC shifts out only a little. A country that devotes more resources to capital goods (point B) grows faster later. For a very poor country, cutting consumption to invest is painful or impossible. FDI brings capital from abroad, so the country can invest more without sacrificing as much current consumption.
Capital and jobs: new factories, mines and offices create employment and raise output.
Technology and skills: MNCs bring production methods, management practices and training; local suppliers learn to meet higher standards.
Exports and foreign currency: much FDI produces for export, which earns foreign currency and links the country to global value chains.
Tax revenue: profitable MNCs pay corporate taxes, royalties and payroll taxes.
Ireland’s experience shows FDI-led growth in a high-income context. A corporate tax rate cut to 12.5% (phased in by 2003) and an educated English-speaking workforce attracted large US technology and pharmaceutical firms. By 2016–17 foreign multinationals employed about 210 000 people and paid about 80% of Ireland’s corporation tax. In a lower-income context, Viet Nam has attracted FDI inflows of between about 4% and 5% of GDP every year from 2015 to 2024, much of it into electronics assembly for export.
Sources: Wikipedia, "Corporation tax in the Republic of Ireland" (2026); World Bank WDI BX.KLT.DINV.WD.GD.ZS (2026).
Profit repatriation: profits are sent home to the parent company, which appears as an outflow on the current account and reduces GNI relative to GDP.
Enclaves: mines and export zones may import most inputs and employ few local people, creating few links to the domestic economy.
Tax avoidance and incentives: MNCs may shift profits to low-tax countries through transfer pricing, and governments may compete with tax holidays that leave little revenue.
Power and influence: large MNCs can bargain hard with small governments over taxes, labour rules and environmental standards.
Footloose investment: firms may leave when wages rise or a cheaper location appears.
Environmental damage: extractive FDI in particular can cause pollution and deforestation.
Whether FDI promotes development depends on the host country. Where institutions are strong, the workforce is educated and the government negotiates fair terms, FDI can transfer technology and build local suppliers, as in Ireland, Singapore and Viet Nam. Where governance is weak, extractive FDI can feed corruption and Dutch disease without raising most people’s living standards.
Foreign aid can be grouped by purpose. Humanitarian aid is short-term help after a disaster or during a conflict. Development aid is longer-term support for projects and programmes that raise living standards. Aid can also be grouped by who gives it: bilateral aid from one government to another, multilateral aid through organisations such as the World Bank, and aid from non-governmental organisations.
Humanitarian aid is rarely controversial in principle, though it can be poorly coordinated, arrive late or be diverted by warring groups. Development aid is more debated, because its effects take years to appear and depend on how it is used.
Development aid comes as grants, which need not be repaid, or as loans. Loans given at below-market interest rates and with long repayment periods are called concessional loans, or soft loans.
In 1970 the UN set a target for rich countries to give 0.7% of their gross national income (GNI) as ODA. Few countries have ever met it. In 2025, preliminary OECD data show that only four of the 34 members of the OECD’s Development Assistance Committee (DAC) did so: Norway (1.03%), Luxembourg (0.99%), Sweden (0.85%) and Denmark (0.72%). Total ODA from DAC members fell by 23.1% in real terms to $174.3 billion, or 0.26% of their combined GNI, the largest annual fall on record; US aid fell by 56.9%.
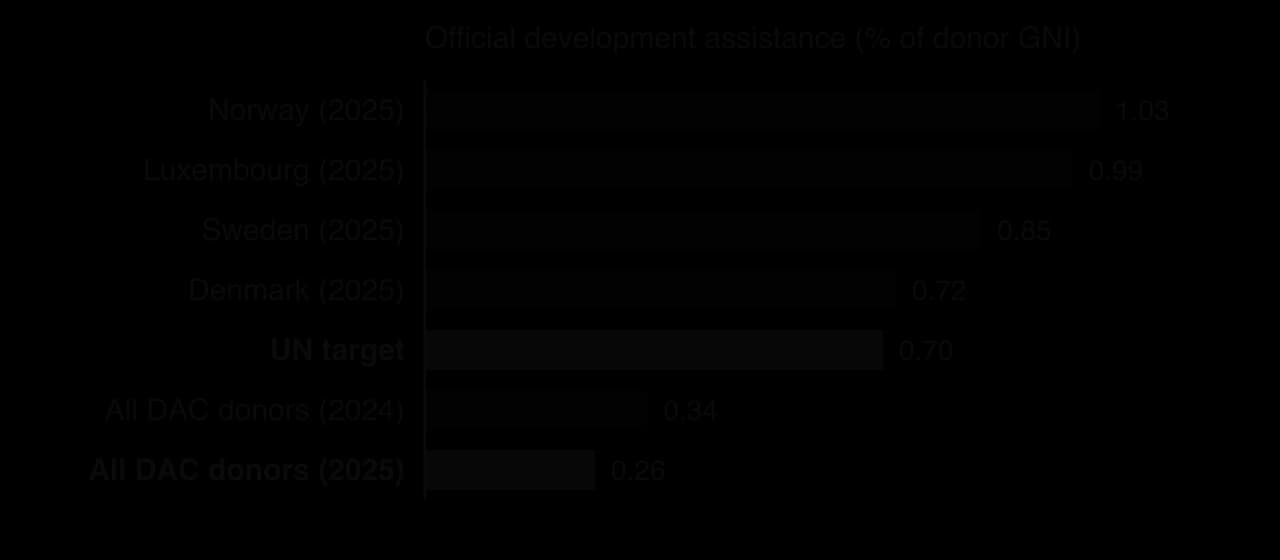
Sources: OECD, preliminary ODA data for 2025 (9 April 2026), as reported by Focus 2030 and the Hellenic Ministry of Foreign Affairs (2026).
Tied aid reduces the value of aid to the recipient, because it may have to buy more expensive goods, consultants or equipment from the donor. It serves the donor’s commercial interests as much as development. Most donors have reduced formal tying since 2001, but informal tying, through contracts that favour donor-country firms, remains common.
NGOs range from large international organisations, such as Oxfam, Médecins Sans Frontières or BRAC (founded in Bangladesh), to small local groups. They often work at community level, reach people the state does not, and can be more flexible and less affected by corruption than government-to-government aid. Their limitations are that they are small relative to national needs, may duplicate or undermine government services, depend on donors’ priorities and fashions, and are accountable mainly to donors rather than to the people they serve.
Debt relief answers the barrier of indebtedness. The Heavily Indebted Poor Countries (HIPC) Initiative, launched by the IMF and World Bank in 1996, and the Multilateral Debt Relief Initiative (MDRI) added in 2005, cancelled much of the debt of the poorest countries, most of them in Africa. To qualify, countries had to show a record of reform and prepare a poverty reduction strategy; 36 countries had completed the process and were receiving full relief by early 2023.
Sources: IMF factsheet, "Debt relief under the Heavily Indebted Poor Countries (HIPC) Initiative" (2023).
A new wave of debt problems after 2020 led to the G20 Common Framework, under which official creditors, including China, agree together on debt treatment for a low-income country. Zambia, which defaulted in 2020, reached agreement with official creditors on about $6.3 billion of debt in 2023 and with bondholders in 2024, but the process took more than three years.
Debt relief frees resources and can break a debt cycle. Its limitations are that it rewards past borrowing and may encourage future over-borrowing (a form of moral hazard); that relief is slow, so damage is done while negotiations continue; that it does nothing for the barriers that caused the debt, such as commodity dependence; and that savings may not be spent on development if governance is weak.
Whether aid works is one of the longest-running debates in development economics. The case for aid is that it fills the saving and foreign exchange gaps, pays for public goods and merit goods that poor governments cannot afford, and saves lives in emergencies. Specific programmes, such as vaccination campaigns and the global fight against HIV, malaria and tuberculosis, have clearly saved millions of lives.
Critics argue that large flows of aid to governments can feed corruption, weaken the link between governments and taxpayers, cause Dutch disease by raising the exchange rate, crowd out local producers (food aid can depress prices for local farmers) and create dependency. Aid allocation may follow donors’ political interests rather than need. The fall in ODA in 2025 also shows that aid is unpredictable, which makes long-term planning hard.
 YouTube
Because the institutions that provide multilateral development assistance pool money from many countries, they can fund large projects, coordinate donors and are less tied to any one country’s commercial interests. Their influence comes partly from their money and partly from the conditions they attach to it.
The World Bank Group includes the International Bank for Reconstruction and Development (IBRD), which lends to middle-income countries at close to market rates, and the International Development Association (IDA), which gives grants and very cheap long-term loans to the poorest countries. It finances infrastructure, education, health, agriculture and reforms, and its research and data, including the World Development Indicators used throughout economics, shape development policy worldwide.
The IMF is not mainly a development lender, but its role in crises makes it central to development. When a country cannot pay for imports or service its foreign debt, the IMF lends foreign currency to stabilise the economy. In 1997 it lent $21 billion to South Korea as part of a $58.4 billion package, which South Korea repaid by 2001; in 1991 India turned to the IMF during its balance of payments crisis; and in 2022 it approved a $1.3 billion Extended Credit Facility for Zambia.
Sources: Wikipedia, "Economy of South Korea" (2026); IMF press release 23/235 (June 2023).
Conditions aim to ensure that the loan fixes the problem and is repaid. In the 1980s and 1990s, IMF and World Bank loans to many developing countries came with structural adjustment programmes.
Supporters argue that conditionality forced overdue reforms and that countries in crisis had few alternatives. Critics argue that cuts to health and education spending and the removal of food subsidies hurt the poor, that austerity during a crisis deepened recessions, and that one set of policies was applied to very different countries with little ownership by their governments. Since the late 1990s both institutions have put more weight on poverty reduction, country-designed strategies and protecting social spending, though conditions remain controversial.
Strengths: large-scale finance on cheap terms; crisis lending when no one else will lend; technical expertise and data; coordination of donors; less tied to one donor’s interests.
Limitations: conditions may be inappropriate or harsh; voting power is weighted towards rich members; projects have sometimes displaced people or harmed the environment; loans add to debt; and the slow pace of debt restructuring can leave countries cut off from finance for years.
Institutional change tackles the political and social barriers: who can borrow, who owns land, who is protected by law and how honestly the state works. Many economists see it as the foundation on which other strategies depend.
Poor people are excluded from banks because their loans are too small to be profitable and they have no collateral. Microfinance solves this with group lending: members of a small group guarantee each other’s loans, so social pressure replaces collateral. Loans finance small businesses, such as a sewing machine, livestock or a market stall, which can raise incomes and help a household escape the poverty trap.
The Grameen Bank in Bangladesh, which grew out of a 1976 research project by the economist Muhammad Yunus and became a bank in 1983, is the best-known example. Yunus and the bank shared the Nobel Peace Prize in 2006. By January 2022 it had nearly 9.5 million borrowers, about 97% of them women.
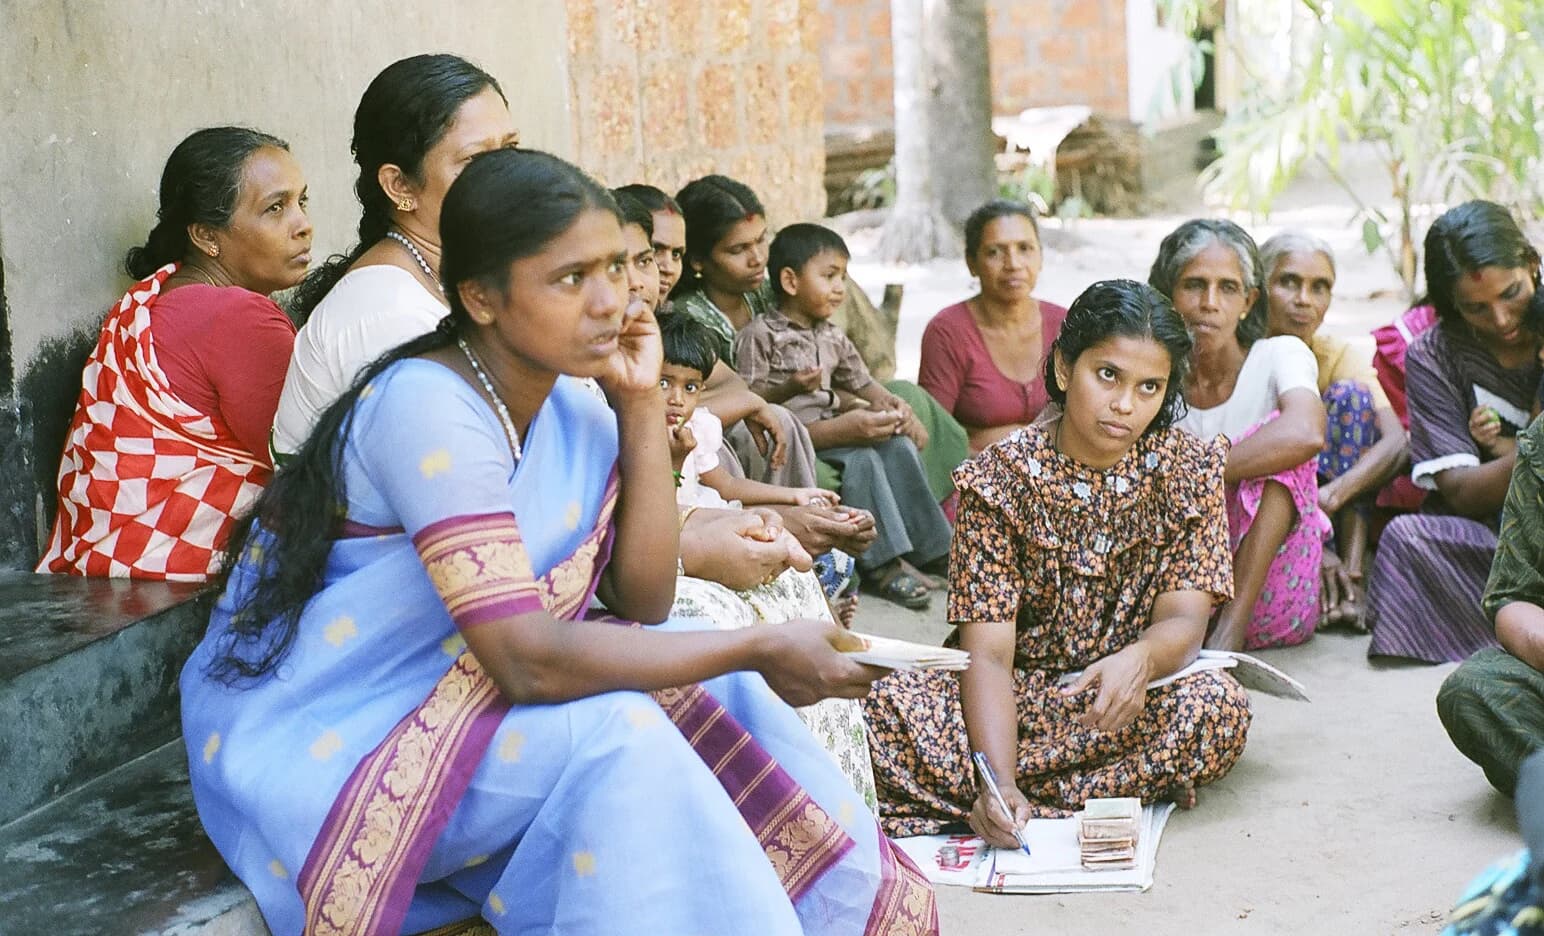
Careful evidence has tempered early enthusiasm. A review of six randomised evaluations of microcredit across different countries found a consistent pattern of modestly positive effects that were not transformative: many borrowers used loans to smooth consumption or expand existing businesses rather than start new ones, and average incomes rose little. Interest rates are often high, because small loans are costly to administer, and some borrowers fall into debt to several lenders.
Sources: Wikipedia, "Grameen Bank" (2026); Banerjee, Karlan and Zinman, _American Economic Journal: Applied Economics (2015)._
Mobile banking is one way of achieving financial inclusion.
M-Pesa, launched commercially by Safaricom and Vodafone in Kenya in March 2007 after a pilot partly funded by the UK’s Department for International Development, showed what mobile money can do. People can send money to relatives across the country by text message and convert it to cash at a local shop. A study by Tavneet Suri and William Jack, published in Science in 2016, estimated that access to M-Pesa lifted about 194 000 Kenyan households, or 2% of the total, out of poverty, with larger effects for households headed by women, many of whom moved from farming into business; other researchers have disputed the study’s methods.
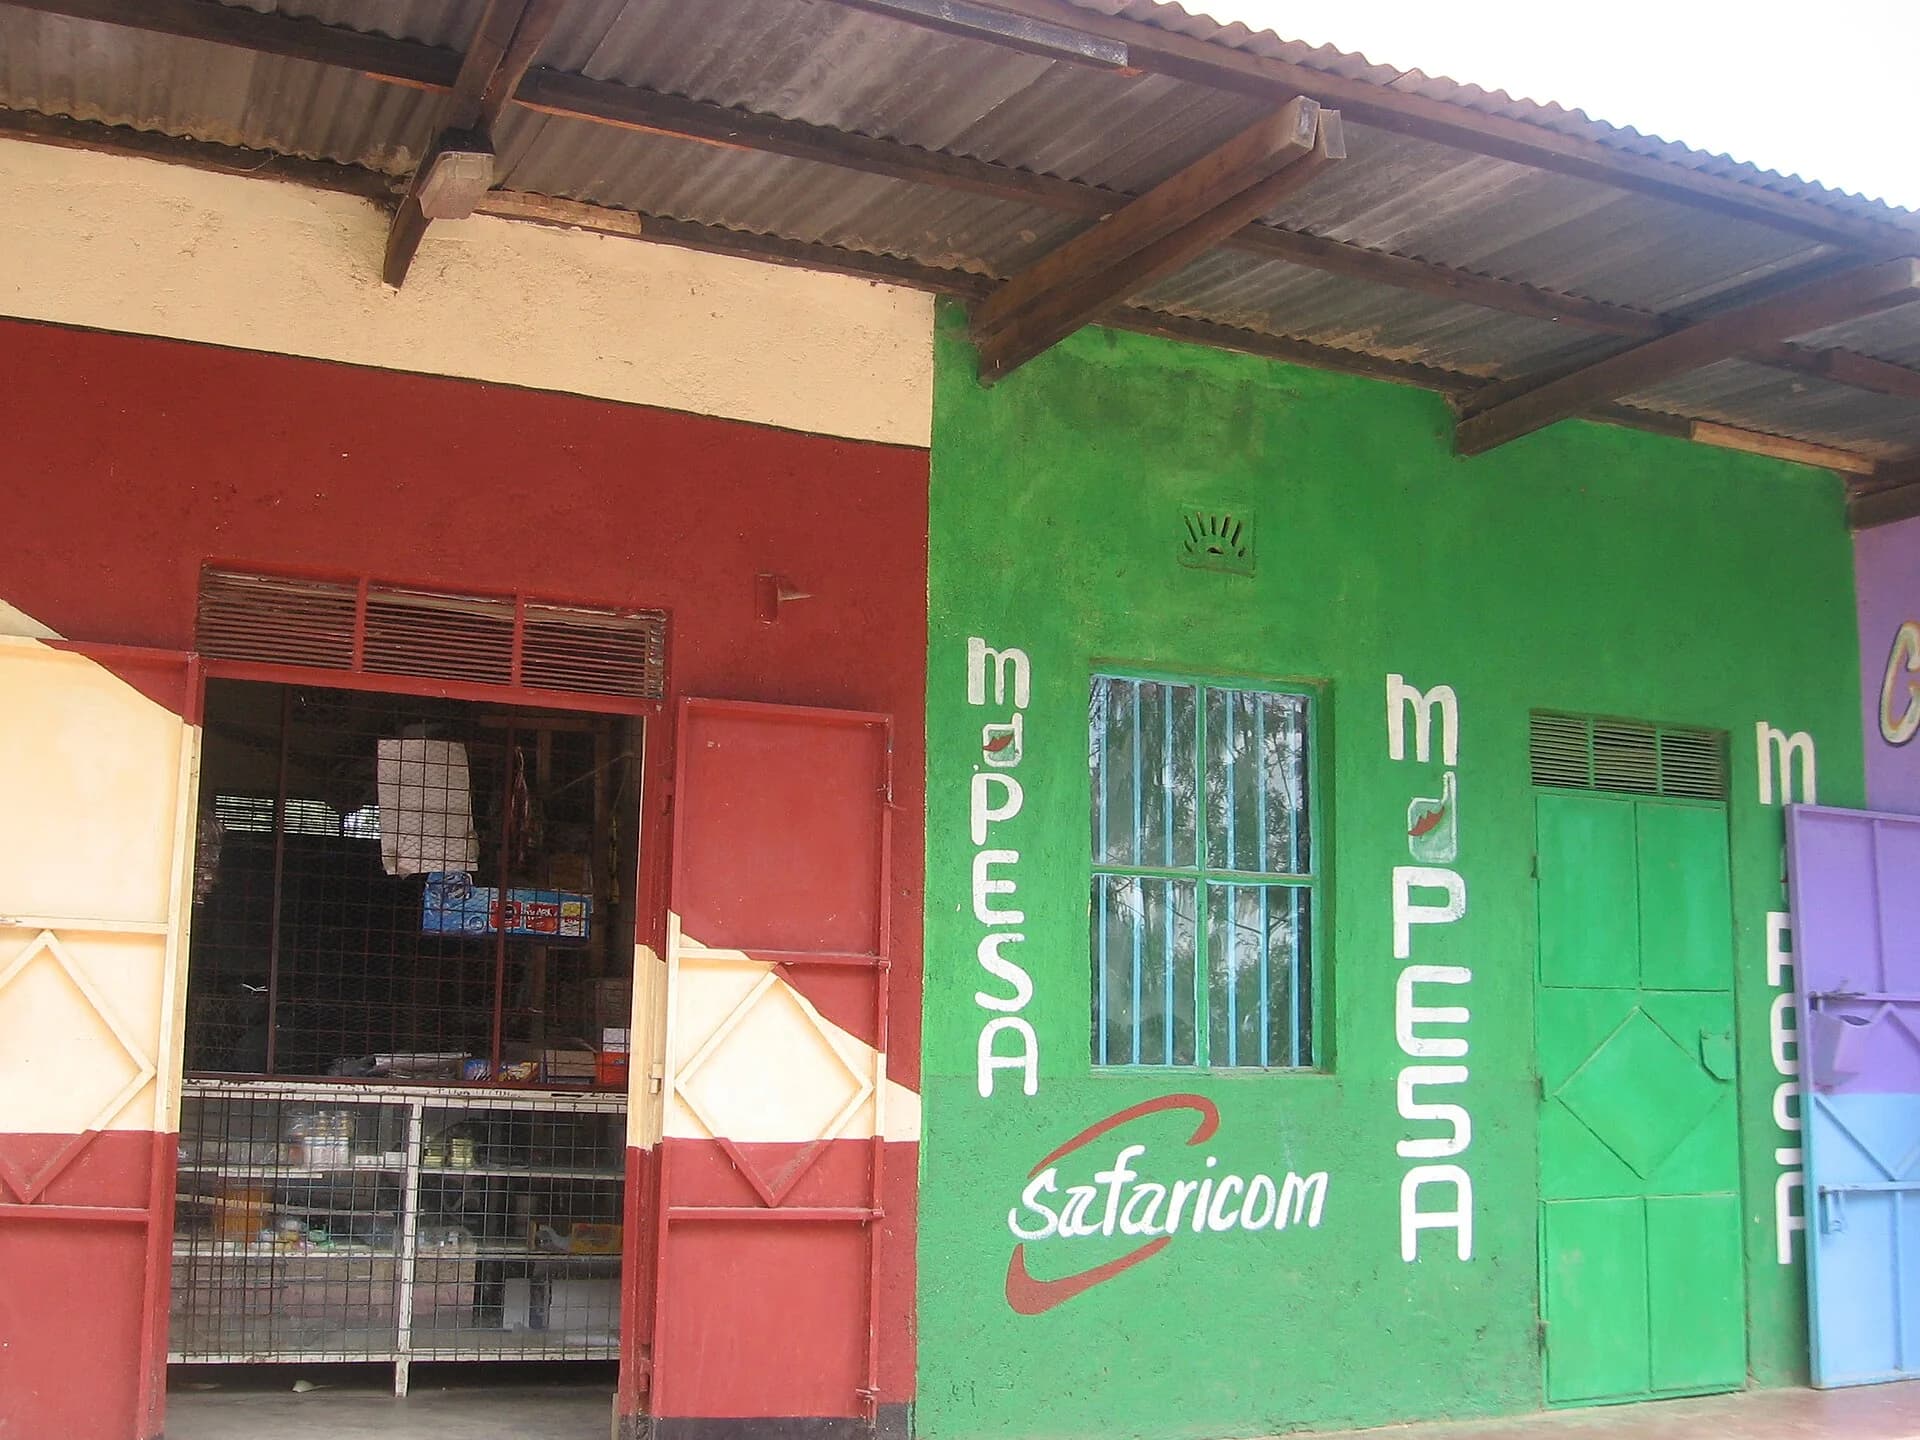
Mobile money spread rapidly. The share of Kenyan adults with a bank or mobile-money account rose from 42% in 2011 to 90% in 2024, and large gains followed in other countries.

Mobile banking cuts the cost of transactions, makes savings safer than cash, lets families receive remittances and government transfers directly, and gives a record of payments that can support borrowing. Its limitations are that it requires phone coverage and some literacy, that the main providers can gain market power, that digital lending apps can encourage high-interest borrowing, and that payments alone do not create jobs or raise productivity unless other barriers are also addressed.
Empowering women is both a goal of development and a strategy for it. Policies include keeping girls in school (for example through free schooling, scholarships or school meals), equal inheritance and property laws, access to bank accounts and credit, maternal health services, and laws against discrimination and violence. Microfinance and mobile money have given many women their own financial resources for the first time.
The returns are high. Educated women earn more, have fewer and healthier children and invest more in those children’s education, so the effect passes to the next generation. A larger female labour force raises potential output. The limitations are that laws can change faster than social norms, that women’s paid work may be added to unpaid care work rather than replacing it, and that progress depends on wider job creation.
Anti-corruption strategies include independent courts and anti-corruption agencies, transparent public procurement, publishing budgets and contracts, paying public servants enough to live on, digital payments that cut cash handling, a free press and protection for whistle-blowers. International rules, such as requirements for extractive firms to publish payments to governments, address corruption around natural resources.
Georgia after its 2003 Rose Revolution is a widely cited case. In 2004 the government dissolved the traffic police, a byword for bribery, dismissing about 16 000 officers and replacing them with a new force on higher pay. A 2012 World Bank report described Georgia’s fight against petty corruption as a "unique success". Later reviews found that progress on high-level corruption stalled, and Georgia’s Corruption Perceptions Index score was 50 in 2025.
Sources: Wikipedia, "Corruption in Georgia" (2026); Transparency International, CPI 2025 (2026).
Reducing corruption raises the return on investment, improves the quality of public spending and increases trust and tax compliance. It is hard because those who benefit from corruption are often powerful, and because reforms need political will that a corrupt system may not produce. Successes tend to follow political turning points.
Secure property rights and land rights give people an incentive to invest, because they know they will keep the returns, and they let land or a house be used as collateral for a loan. The economist Hernando de Soto argued that the assets of the poor are "dead capital" because they are held informally and cannot be used in this way.
Peru put his ideas into practice. A titling programme that began as a pilot in 1992 had registered 1.4 million urban households and issued about 920 000 titles by 2004. The evidence on its effects is mixed: titling did little to improve access to credit, contrary to de Soto’s claim, but studies in Peru and Argentina found that titled families invested more in their homes and that their children received more education.
Sources: Wikipedia, "Hernando de Soto Polar" (2026).
Land rights for women are especially important in farming economies where women do much of the agricultural work but rarely own land. The limitations of titling programmes are cost, the risk that the powerful use registration to claim land that poor households used under customary rights, and the fact that a title helps little if courts do not enforce it.
Every strategy sits somewhere between relying on markets and relying on the state. Deciding which approach works better is the central debate in development economics, and the evidence points to a combination rather than a single answer.
Market-oriented approaches | Government intervention | |
|---|---|---|
Examples | Trade liberalisation, privatisation, deregulation, openness to FDI | Redistribution, merit goods, infrastructure, industrial policy, state-led investment |
Strengths | Efficiency through competition and incentives; less scope for state corruption over licences; attract private capital | Correct market failures (merit goods, public goods, externalities); reduce inequality; coordinate large investments |
Limitations | Ignore market failure and equity; gains may go to the rich; risky where institutions are weak | Government failure: corruption, poor information, political allocation, high costs and debt |
Depends on | Strength of regulation, competition and property rights | Quality, honesty and capacity of the state |
The historical evidence supports elements of both. The fastest sustained growth, in South Korea, Taiwan, China and Viet Nam, came from economies that were oriented towards export markets and used markets increasingly, but where the state invested heavily in education, infrastructure and selected industries. Countries that relied almost entirely on state control and protection, such as India before 1991, grew slowly; countries that liberalised rapidly with weak institutions, as in parts of Latin America and Africa in the 1980s and 1990s, often saw little growth and rising inequality.
A reasonable judgement is that markets are usually the better way to allocate resources between competing private uses, while the state is essential for education, health, infrastructure, the rule of law and a safety net. The right balance depends on the country’s institutions: where the state is capable and honest, more intervention can work; where it is not, building institutions comes first, and market-based reforms need strong regulation to avoid simply transferring monopolies to private owners.
The Sustainable Development Goals (SDGs), adopted by the UN in 2015, set 17 goals and 169 targets for 2030. Comparing countries’ progress towards particular targets shows which strategies have worked and why progress differs. Bangladesh, Viet Nam and Nigeria are useful to compare, because they started from different points and followed different strategies.
Share of population below $3.00 a day (2021 PPP) | Earlier survey | Latest survey |
|---|---|---|
Viet Nam | 43.3% (2002) | 1.6% (2022) |
Bangladesh | 41.4% (2000) | 5.9% (2022) |
Nigeria | 51.1% (2003) | 41.8% (2022) |
Sources: World Bank, Poverty and Inequality Platform, via WDI SI.POV.DDAY (2026).
Viet Nam and Bangladesh started with similar poverty rates to Nigeria in the early 2000s, but by 2022 they had almost eliminated extreme poverty at this line, while in Nigeria it remained above 40% and rose again after 2018. Viet Nam’s progress followed export-oriented manufacturing, FDI and investment in rural infrastructure and education after Đổi Mới; Bangladesh’s followed the growth of garment exports, which employ many women, together with health and microfinance programmes delivered with NGOs such as BRAC and Grameen.
SDG target 3.2 aims to reduce under-5 mortality to at most 25 deaths per 1 000 live births in every country by 2030.
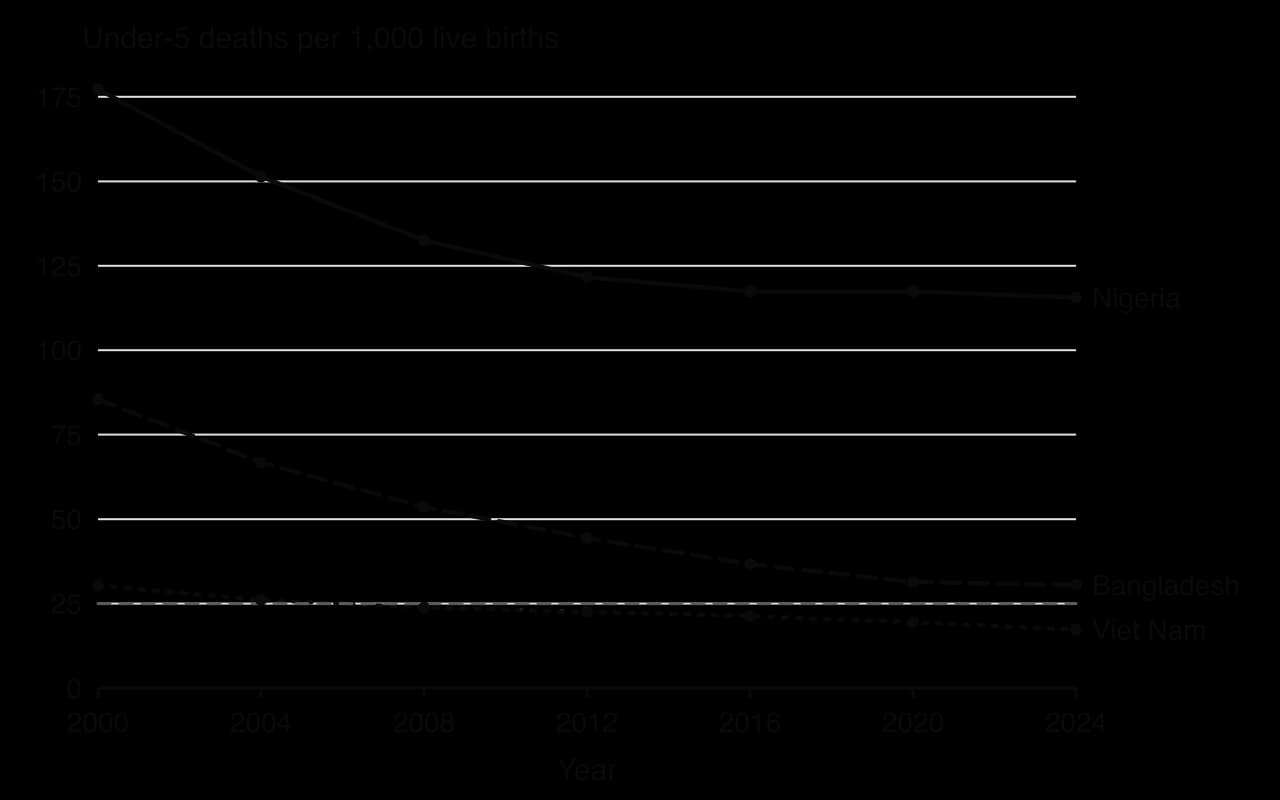
The chart shows Viet Nam already below the target, Bangladesh close to it after a fall of about two-thirds since 2000, and Nigeria at 115.6 in 2024, more than four times the target, with almost no improvement since 2016. Nigeria’s slow progress reflects barriers rather than a lack of resources: dependence on oil, weak institutions and corruption (a CPI score of 26 in 2025), conflict in the north-east, and low public spending on health.
Strategies matter, but so do institutions. Similar strategies (export promotion, health spending) produced fast progress where the state was capable and stable.
Growth helps, but its pattern matters. Labour-intensive export growth that employed many people, especially women, reduced poverty faster than oil-based growth that employed few.
Social programmes can run ahead of income. Bangladesh cut child mortality faster than its income alone would predict, through low-cost health programmes delivered with NGOs.
Shocks set progress back. The COVID-19 pandemic and, in Nigeria, inflation and conflict reversed some gains, showing that progress towards the SDGs is not automatic.
Data limits. Poverty data come from household surveys taken every few years, so recent progress is uncertain, and national averages hide differences between regions and groups.
Key concept | Where it appears in growth and development strategies |
|---|---|
Intervention | The central choice between market-oriented and interventionist strategies, and the role of aid and multilateral institutions. |
Efficiency | Trade liberalisation, privatisation and export promotion aim to raise efficiency through competition. |
Equity | Redistribution, women’s empowerment and land rights aim to spread the gains of development. |
Interdependence | Export promotion, FDI, aid and debt relief all depend on decisions in other countries. |
Sustainability | Diversification and saving resource revenue protect future generations; debt and pollution can harm them. |
Economic well-being | The SDGs measure progress in poverty, health and education, not only in income. |
Botswana became independent in 1966 as one of the poorest countries in the world, landlocked, with little infrastructure, low literacy and an economy based on cattle. Diamonds were discovered at Orapa in 1967. Over the following decades Botswana became one of the fastest-growing economies in the world and an upper-middle-income country, avoiding the "resource curse" that affected many other resource exporters. Its experience brings together several strategies: partnership with foreign investors, saving resource revenue, investment in human capital and, more recently, the attempt to diversify.
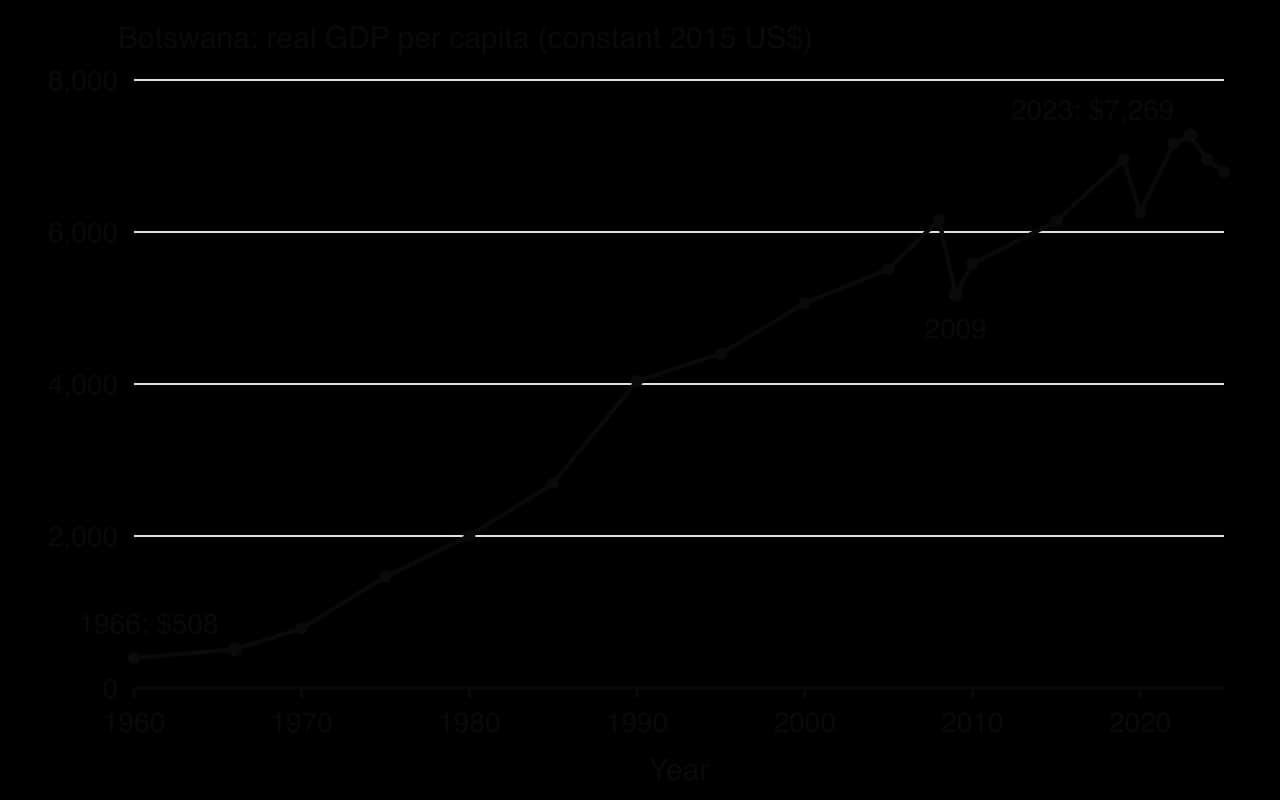
Real GDP per capita rose from $508 in 1966 to $4 039 in 1990 and $7 269 in 2023, in constant 2015 US dollars, an average growth rate of about 4.8% a year over 57 years. The core of the strategy was a partnership with the mining firm De Beers. Their joint venture, now called Debswana, was formed in 1968–69 with a government share of 15%, which rose to 50% within a few years, so the state captured a large share of diamond profits. Mineral revenue, almost all of it from diamonds, was worth 13.3% of GDP in 2022.
Botswana used the revenue in ways that strengthened development rather than consumption. A sovereign wealth fund, the Pula Fund, was set up in 1993 to invest surplus diamond revenue abroad, smoothing spending over the price cycle and saving for future generations. Public spending went into roads, water, schools and health; government spending on education was between about 8% and 11% of GDP in most years from 2005 to 2020. Botswana has been regularly ranked by Transparency International as among the least corrupt countries in Africa, with a Corruption Perceptions Index score of 58 in 2025.
Botswana’s success fits the institutional view of development. Its post-independence governments kept the rule of law, competitive elections and a professional civil service, and they treated diamond revenue as national wealth to be invested. Foreign direct investment by De Beers brought the capital, technology and access to world diamond markets that Botswana lacked, while government ownership of half of Debswana kept much of the profit at home. Saving the revenue in the Pula Fund reduced the risk of Dutch disease and of boom-and-bust public spending.
Botswana’s record also shows what this strategy did not achieve. Diamonds still dominate exports and government revenue, and the economy remains exposed to their price. When global demand for natural diamonds fell in 2023–24, partly because of competition from cheaper lab-grown stones, mineral revenue fell to 7.4% of GDP in 2023, and Botswana’s real GDP fell by 2.8% in 2024 and a further 0.7% in 2025. With less mineral revenue, the budget deficit was projected to widen to about 6% of GDP in the 2024/25 fiscal year. The government announced plans to diversify the economy as early as 2009, but manufacturing remains around 5% of GDP.
Development has also been uneven. Inequality remained very high, with a Gini coefficient of 54.9 in 2015, and unemployment was about 24% of the labour force in 2022, with youth unemployment far higher, because capital-intensive mining creates few jobs. The HIV/AIDS epidemic cut life expectancy from about 60 years in 1990 to 52 in 2000 before a government programme of free or cheap antiretroviral drugs from 2003 helped it recover to 69 by 2024. Growth in income, in other words, did not on its own produce broad development.
Botswana shows that a resource-rich, landlocked country can grow fast if institutions are strong, revenue is captured and saved, and spending goes into infrastructure and human capital. It also shows the limit of relying on one commodity, however well managed: diversification is far harder than saving, and the next stage of development depends on creating jobs outside mining. As evidence for other countries, Botswana’s small population, its single valuable and easily taxed resource, and its unusual political history mean that its success cannot simply be copied.
Sources: World Bank WDI NY.GDP.PCAP.KD, NY.GDP.MKTP.KD.ZG, SE.XPD.TOTL.GD.ZS, SI.POV.GINI, SL.UEM.TOTL.ZS, SP.DYN.LE00.IN, NV.IND.MANF.ZS (2026); IMF, 2024 Article IV consultation with Botswana, press release 24/321 (September 2024); Wikipedia, "Debswana" and "Pula Fund" (2026); Transparency International, CPI 2025 (2026).
Growth and development strategies are among the most common topics for Paper 1 part (b) questions in Unit 4 and for the final [15]-mark part of Paper 2. Because the subtopic is evaluative, answers are judged mainly on the quality of evaluation and the use of real examples or of the text and data. HL Paper 3 part (b) often asks for a policy recommendation to promote development in a country described in the data.
Paper 1 part (a) questions on strategies require explanation without evaluation, usually of two strategies or two effects, with a diagram.
Paper 1 (a) [10]: Using an appropriate diagram, explain how investment in education can promote economic development. (Merit good diagram and/or LRAS shift; link to human capital and the poverty cycle.)
Paper 1 (a) [10]: Explain two ways in which microfinance may help to break a poverty cycle. (Draw the poverty cycle and mark where credit breaks the link between low saving and low investment; women’s empowerment.)
Paper 1 (b) [15]: Using real-world examples, discuss the effectiveness of foreign aid in promoting economic development.
Paper 1 (b) [15]: Using real-world examples, to what extent are market-oriented strategies more effective than government intervention in achieving economic growth?
Paper 2 short items test definitions, calculations from the data and short explanations; the final part asks for an evaluation using the text.
Define [2]: official development assistance; tied aid; microfinance; import substitution; conditionality.
Calculate [2]: a donor’s ODA as a percentage of GNI; the percentage change in a country’s exports or poverty rate; the cost of a subsidy from a diagram or data.
Explain [4]: using an AD/AS diagram, how a government’s investment in a hydroelectric dam could affect the economy in the short run and the long run.
Evaluate [15]: using information from the text and your knowledge of economics, evaluate the government’s decision to diversify the economy away from copper exports. (Use the text’s figures on export shares and price volatility; strengths, costs, time lags, institutions; a judgement for this country.)
Strategies respond to barriers: each should be judged by which barrier it addresses, through what mechanism, for whom and at what cost.
Import substitution protects domestic industry but tends to produce inefficient firms; export promotion, combined with an active state, drove East Asia’s rapid growth but depends on world demand and market access.
Diversification reduces commodity dependence but is slow and difficult; social enterprise and fair trade serve the poor through markets but on a small scale.
Market-based policies (trade liberalisation, privatisation, deregulation) raise efficiency but can increase inequality and need strong regulation; redistribution and provision of education, health and infrastructure correct market failure but depend on state capacity and revenue.
FDI, aid, debt relief and World Bank and IMF assistance bring foreign resources; their effect depends on how they are used, on conditions attached and on the recipient’s institutions.
Institutional change, including mobile banking, microfinance, women’s empowerment, anti-corruption reform and secure land rights, underpins other strategies.
Successful countries have usually combined markets and intervention; progress towards the SDGs in Viet Nam and Bangladesh compared with Nigeria shows the role of strategy and institutions.
I can explain import substitution and export promotion and use a tariff diagram and an AD/AS diagram to analyse them.
I can explain diversification, social enterprise and economic integration as strategies, with examples.
I can explain market-based policies and interventionist policies (redistribution and merit goods) with the relevant diagrams.
I can explain the roles and limits of FDI, foreign aid, debt relief, NGOs, the World Bank and the IMF.
I can explain how microfinance, mobile banking, women’s empowerment, anti-corruption reform and land rights promote development.
I can calculate growth rates, ODA shares and subsidy costs from data.
I can evaluate any strategy for a specific country, including a comparison with an alternative.
I can evaluate government intervention against market-oriented approaches with real examples.
I can compare progress towards selected SDGs in two or more countries and explain the differences.
Marks
Descriptor |
|---|
0 | 0 | The work does not reach a standard described by the descriptors below. |
1 | 1–2 | Little understanding of the specific demands of the question. Relevant economic theory is stated but not relevant. Economic terms are stated but not relevant. |
2 | 3–4 | Some understanding of the specific demands of the question. Relevant economic theory is described. Some relevant economic terms are included. |
3 | 5–6 | The specific demands of the question are understood but only partially addressed. Relevant economic theory is partly explained. Some relevant terms are used appropriately. Where appropriate, relevant diagram(s) are included. |
4 | 7–8 | The specific demands of the question are understood and addressed. Relevant economic theory is explained. Relevant terms are used mostly appropriately. Where appropriate, relevant diagram(s) are included and explained. |
5 | 9–10 | The specific demands of the question are understood and addressed. Relevant economic theory is fully explained. Relevant terms are used appropriately throughout. Where appropriate, relevant diagram(s) are included and fully explained. |
Using real-world examples, evaluate the view that investment in education and training is the most effective way to increase an economy's productive capacity.
15 marks
Answers may include:
Terminology: human capital, productive capacity, potential output, long-run aggregate supply (LRAS), supply-side policies, interventionist and market-based policies, infrastructure, productivity.
Explanation: education and training raise labour productivity, adaptability and innovation, increasing the quality of the labour factor; this shifts the PPC and LRAS outward and can reduce structural unemployment; positive externalities justify government provision or subsidy.
Diagram(s): PPC shifting outward; AD/AS diagram showing LRAS (or the vertical section of Keynesian AS) shifting right.
Synthesis/evaluation: long time lags before benefits appear; high opportunity cost for government budgets; benefits depend on quality and on whether skills match labour market needs; brain drain may remove the gains; alternatives may be more effective in some contexts: infrastructure investment, investment in physical capital, research and development, market-based policies (deregulation, labour market reform, competition policy), institutional change and property rights; the relative effectiveness depends on the country's stage of development and binding constraints; consideration of 'most effective' and a reasoned judgement.
Examples: South Korea's heavy investment in education since the 1960s and its rapid growth; Germany's dual vocational training (apprenticeship) system; Singapore's SkillsFuture programme (2015); India's large infrastructure programmes as an alternative route to capacity growth; emigration of trained nurses and doctors from countries such as Zimbabwe reducing the returns to education.
For 'most effective' questions, a maximum of [12] should be awarded where no alternative policies are considered.
N.B. Terminology, theory, diagrams and examples given in part (a) and referred to in part (b) should be rewarded.
Examiners should be aware that candidates may take a different approach which, if appropriate, should be rewarded.
Markbands (best fit)
Level | Marks | Descriptor |
|---|---|---|
0 | 0 | The work does not reach a standard described by the descriptors below. |
1 | 1–3 | Little understanding of the specific demands of the question. Theory is stated but not relevant. Terms are not relevant. No synthesis or evaluation. Real-world examples are identified but not relevant. |
2 | 4–6 | Some understanding of the demands. Relevant theory is described. Some relevant terms are included. Synthesis or evaluation is superficial. A relevant real-world example is identified. |
3 | 7–9 | The demands are understood but only partially addressed. Theory is partly explained. Some terms are used appropriately. Relevant diagram(s) are included where appropriate. Synthesis or evaluation is appropriate but lacks balance. Example(s) are identified and partly developed in context. |
4 | 10–12 | The demands are understood and addressed. Theory is explained. Terms are used mostly appropriately. Diagram(s) are included and explained. Synthesis or evaluation is appropriate and mostly balanced. Example(s) are identified and developed in the context of the question. |
5 | 13–15 | The demands are understood and addressed. Theory is fully explained. Terms are used appropriately throughout. Diagram(s) are included and fully explained. Synthesis or evaluation is effective and balanced. Example(s) are identified and fully developed to support the argument. |
Natural disasters and armed conflict can cause severe damage to a country's economy.
Using a production possibilities curve (PPC), explain how a major natural disaster could affect both an economy's production possibilities and its actual output.
10 marks
Using real-world examples, discuss the effectiveness of foreign aid in promoting economic growth and development.
15 marks
Several economies that were once centrally planned have moved towards greater use of markets.
Explain how a planned economy answers the basic economic questions and why it may fail to allocate resources efficiently.
10 marks
Using real-world examples, evaluate the effects on stakeholders of the privatization of state-owned enterprises.
15 marks