The scientific investigation
What the chemistry internal assessment is, how its four criteria award 24 marks, the rules on length, groups and academic integrity, and a timeline from first idea to final report.
- IB Chemistry
- Internal assessment
- SL and HL
The internal assessment in IB Chemistry is a scientific investigation: an open-ended piece of research in which each student formulates their own research question, designs a way to collect or select data to answer it, analyses those data with their uncertainties, and writes a report that justifies a conclusion and evaluates the method. It is the same task, marked against the same criteria, at SL and HL, and the same in biology, chemistry and physics. The teacher marks the report, and a sample from each school is re-marked by the IB, a process called moderation, so that standards are the same worldwide.
The investigation rewards the habits of a working chemist rather than recall: asking a question that can actually be answered in a school laboratory, measuring carefully, handling uncertainty honestly and reasoning from evidence to a conclusion. The same skills are tested in Paper 1B, so the work done for the internal assessment also prepares students for the data-based questions in the written papers.
What the investigation is
The investigation starts from a question about how one variable affects another in a chemical system, or about how two variables are correlated in data that cannot be controlled directly, such as values taken from a database. Many chemistry investigations go one step further and use the relationship to determine a quantity: an activation energy from rates at several temperatures, an enthalpy change from temperature measurements, a concentration from a calibration curve. The student chooses the question, usually after some reading and trial experiments, and the teacher acts as a supervisor who checks that it is safe, feasible and appropriate.
Two requirements shape every investigation. Each student formulates, investigates and answers a unique research question, and the investigation must collect and analyse quantitative data, supported by qualitative observations where they help. A colour change, the appearance of a precipitate or a gas evolving too quickly to collect cleanly are qualitative observations that often explain features of the numbers later.
About 10 hours of teaching time are given to the whole process: explaining the task, class time for practical work and questions, consultation between the teacher and each student, and checks on progress and authenticity. Ten hours is not long. The most successful investigations are small and focused, with one independent variable, one dependent variable and a well-controlled method that can be completed in two or three laboratory sessions.
Kinds of investigation
Data can come from several sources. The approach is chosen to suit the question, and approaches can be combined.
Approach | Where the data come from | Chemistry example |
|---|---|---|
Hands-on laboratory work | Measurements made by the student in a controlled experiment | How the temperature of the reacting mixture (20–60 °C) affects the time for sodium thiosulfate to react with hydrochloric acid |
Fieldwork | Measurements made outside the laboratory, where the student selects conditions rather than setting them | How the pH or dissolved oxygen of a stream changes with distance downstream of a drainage outlet |
Database | Values selected from a published data set (secondary data) | How the boiling point of straight-chain alkanes depends on the number of carbon atoms, from the NIST Chemistry WebBook |
Simulation | Results generated by a computer model that the student controls | How the yield of ammonia at equilibrium depends on pressure, using an equilibrium simulation |
Spreadsheet modelling | A model built by the student from chemical equations, often tested against real data | A spreadsheet that calculates the pH during a titration and is compared with pH-probe data |
Combination | Two or more of these, used together | Measured enthalpies of combustion of alcohols compared with values calculated from average bond enthalpies |
Each approach has its own demands. A laboratory investigation is judged on control of variables and precision of measurement. A database investigation is judged on how the data were selected, filtered and sampled, and on whether the source is reliable. A simulation investigation is judged on the student’s understanding of the model and its assumptions, so a simulation that the student cannot explain is a weak basis for a report.
What a chemistry investigation looks like
The best chemistry investigations measure something that changes smoothly and reproducibly with the independent variable, so that a graph of five or more values tests a clear prediction. Common, well-tested territory includes:
Rates of reaction, followed by the volume of gas collected in a gas syringe, mass lost from an open flask, the time for a precipitate to obscure a mark, or the change in absorbance measured with a colorimeter.
Calorimetry, such as the enthalpy change of a displacement reaction in a polystyrene cup or the enthalpy of combustion of a fuel burned under a copper can.
Titration, for example the concentration of an acid, a base or an oxidizing agent in a commercial product, compared across brands, storage times or temperatures.
Electrochemistry, such as how the potential difference of a voltaic cell depends on the concentration of one of its solutions.
Separation and analysis, such as how the retardation factor of a dye in paper chromatography depends on the composition of the solvent.
Each of these turns a chemical idea from the course into a measurable relationship.
The four criteria at a glance
The report is marked against four criteria, each worth 6 marks, for a total of 24. Each criterion is worth 25 % of the internal assessment, and the internal assessment is worth 20 % of the final grade at both SL and HL. The criteria follow the stages of an inquiry: designing the investigation, analysing the data, and drawing and evaluating conclusions.
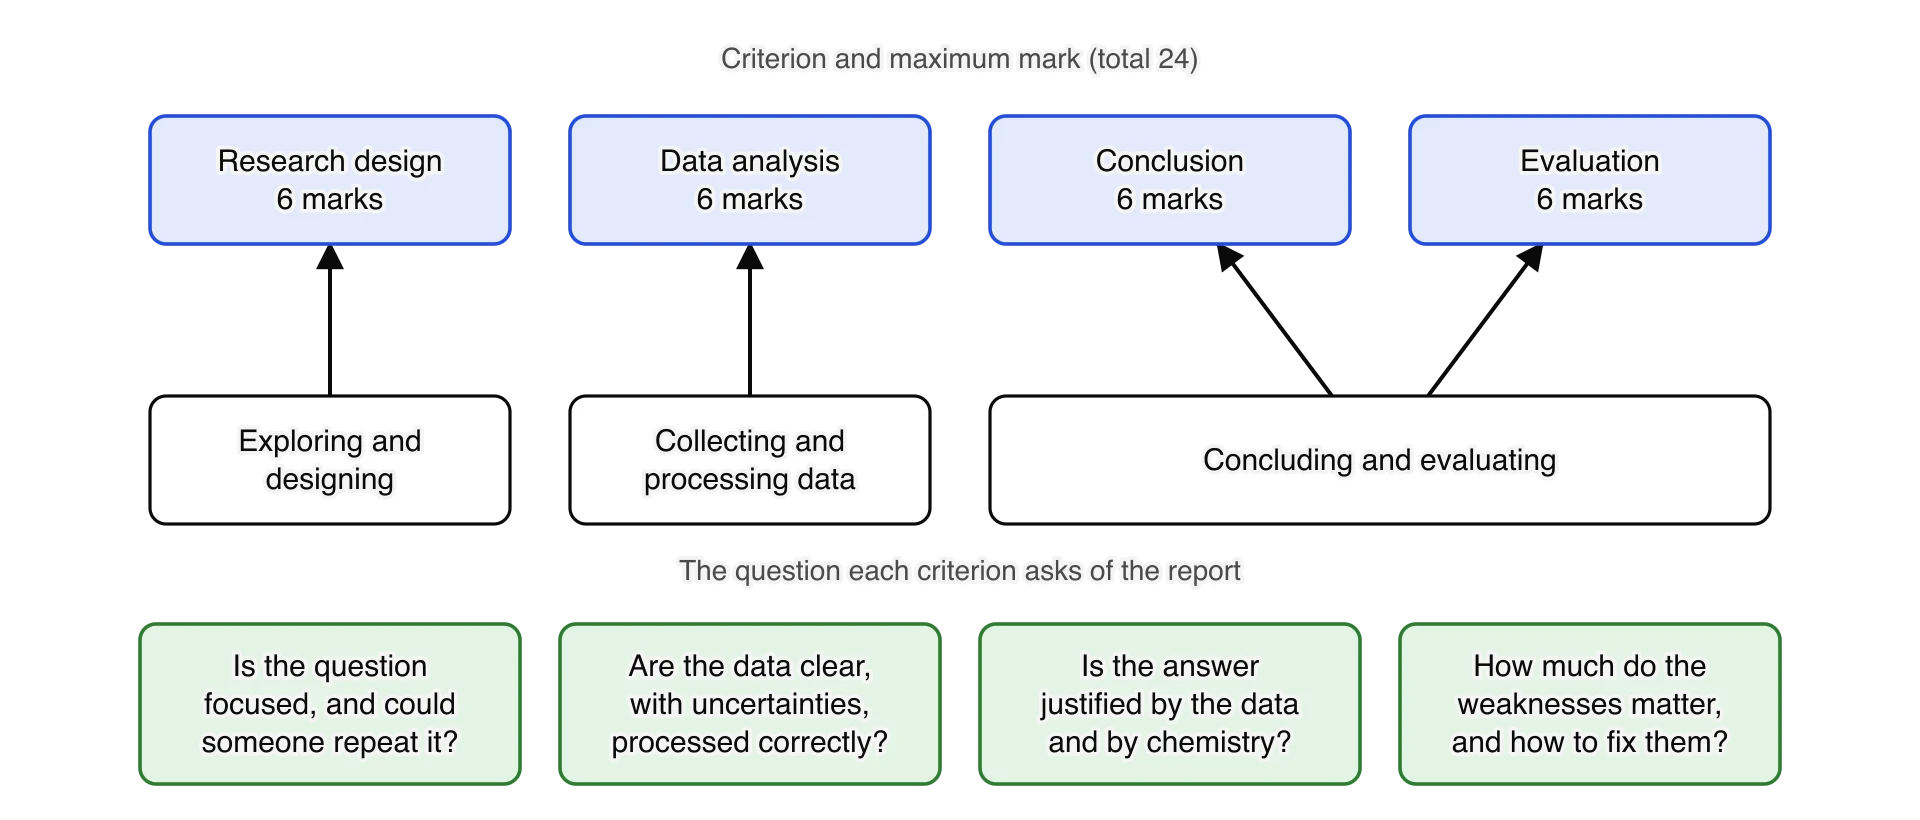
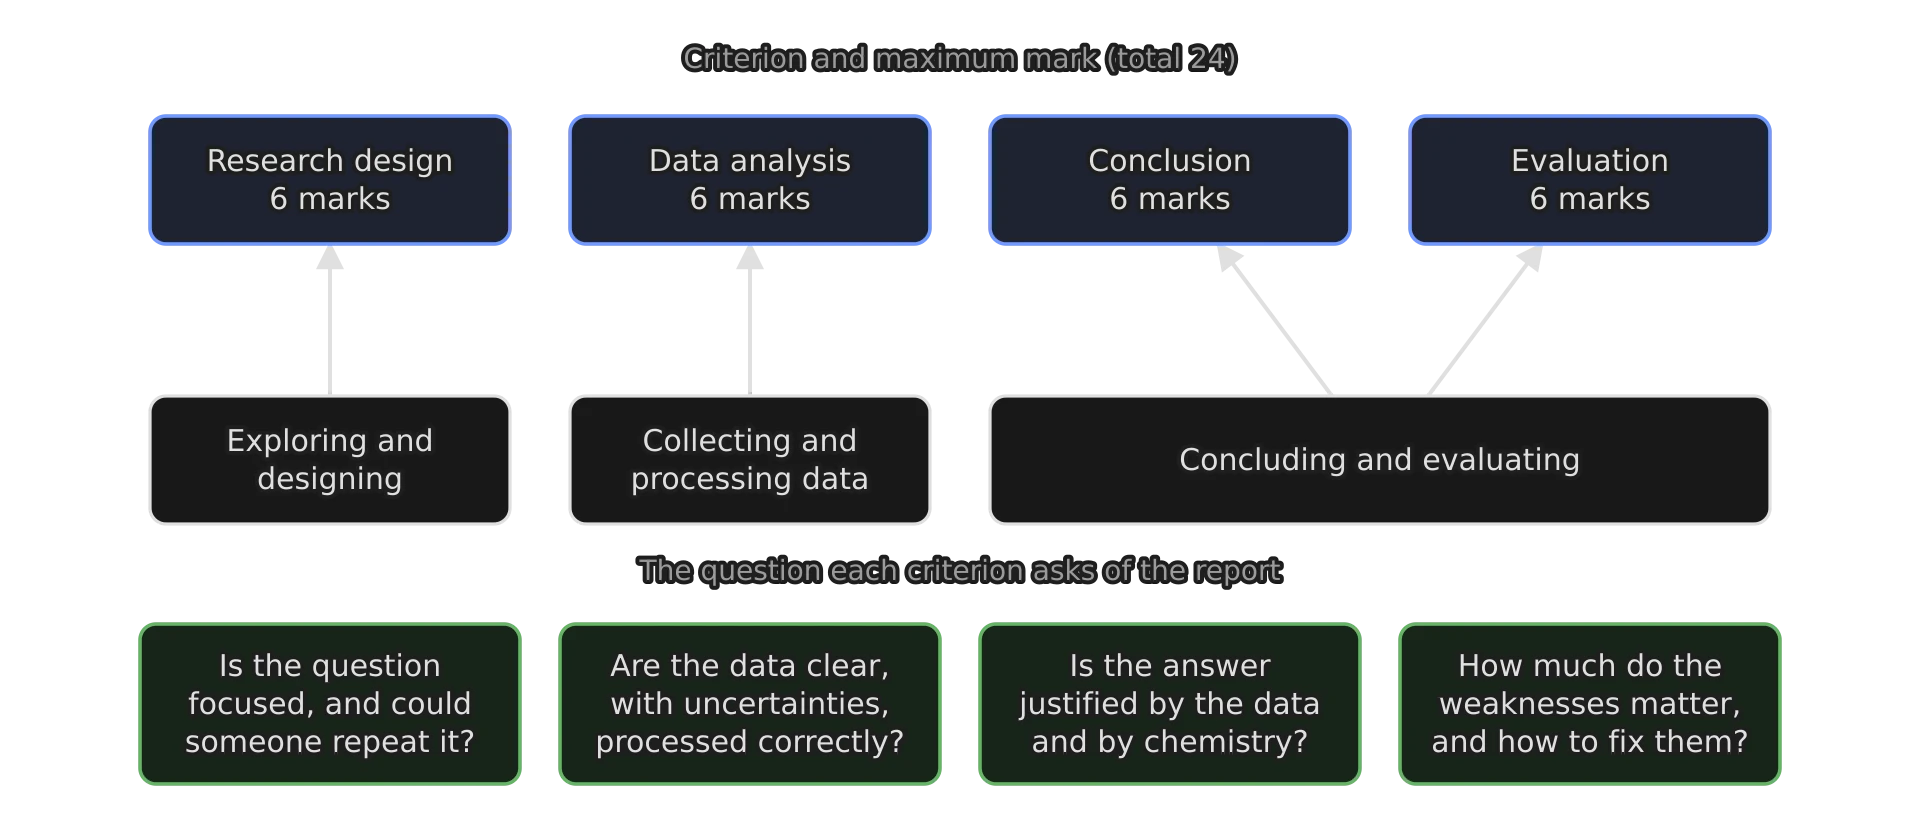
Each criterion has four levels: 0, 1–2, 3–4 and 5–6. The teacher reads the descriptors for each criterion, finds the level that best fits the report as a whole, and then chooses the upper or lower mark in that level depending on how fully the report meets it. This best-fit marking means that a report does not need to meet every point of a descriptor to earn it, and the top level does not demand a faultless report. The criteria are marked independently, so a weak conclusion does not drag down a strong data analysis.
What each criterion rewards
The descriptors step up through the command terms. At 1–2 a report states, at 3–4 it describes or outlines, and at 5–6 it explains or justifies. The verbs are the clearest guide to what moves a report up a level: listing a control variable is "stating"; saying why it affects the dependent variable and how it was kept constant is "explaining".
Criterion | What it assesses | The top level (5–6), paraphrased |
|---|---|---|
Research design | How well the report communicates the methodology, its purpose and practice, used to answer the question | The question is described in a specific and appropriate context. The methodological considerations needed to collect relevant and sufficient data are explained. The method is described well enough for someone else to reproduce the investigation. |
Data analysis | How the data were recorded, processed and presented in ways relevant to the question | Recording and processing are communicated both clearly and precisely. Uncertainties are considered appropriately. Processing relevant to the question is carried out appropriately and accurately. |
Conclusion | How well the report answers its question, using its analysis and the accepted scientific context | A conclusion relevant to the question is justified and fully consistent with the analysis, including the uncertainties. It is justified by relevant comparison with the accepted scientific context. |
Evaluation | How well the report evaluates the methodology and suggests improvements | The relative impact of specific weaknesses or limitations of the method is explained. Realistic improvements, relevant to those weaknesses or limitations, are explained. |
The clarifications that accompany the criteria add useful detail. A research question "with context" names the dependent and independent variables (or two correlated variables), briefly describes the system and gives the background theory that bears directly on it. "Precise" communication means following conventions for tables and graphs, units, decimal places and significant figures. A "fully consistent" conclusion interprets the processed data with their uncertainties. The "scientific context" can be published values, textbooks or other sources, cited well enough to be traced. A "generic" weakness is one that would apply to almost any investigation ("human error", "more repeats"), and generic points stay in the lowest level.
 YouTube
How the criteria depend on each other
Although the criteria are marked separately, the work behind them is linked. A question without a clear dependent variable makes the analysis vague. Data with no uncertainties cannot support a "fully consistent" conclusion. A method that was never piloted produces surprises that the evaluation can only list rather than explain. Planning for all four criteria from the start avoids most of these problems.
Decision at the design stage | Effect later in the report |
|---|---|
Five or more values of the independent variable over a wide range | A graph can test a relationship, not just show that one value is bigger than another |
Three or more repeats at each value | Random uncertainty can be estimated from the spread and shown as error bars |
A prediction based on chemical theory | The conclusion has something specific to compare with |
A measured or published reference value | The size of systematic error can be judged, which strengthens the evaluation |
Recording qualitative observations as they happen | Anomalies and weaknesses can be explained with evidence rather than guessed |
The rules
Length and what counts towards it
The report has a maximum of 3,000 words. Several things are not counted: charts and diagrams, data tables, equations, formulas and calculations, citations and references (in any style), the bibliography and headers. The words of the explanation, the method and the discussion are counted. The limit is a maximum, not a target: material beyond it risks not being considered by the teacher or the moderator, and long reports usually lose clarity.
The start of the report gives the title of the investigation, the student’s IB candidate code, the candidate codes of any group members, and the word count. No cover page or contents page is needed.
Working with others
Collaboration is optional. Where it happens, groups have no more than three students, and each student still investigates their own research question. Within a group, each student must change one of three things:
a different independent variable from the others in the group;
the same independent variable, but a different dependent variable;
different data selected from within a larger data set that the group collected or obtained together.
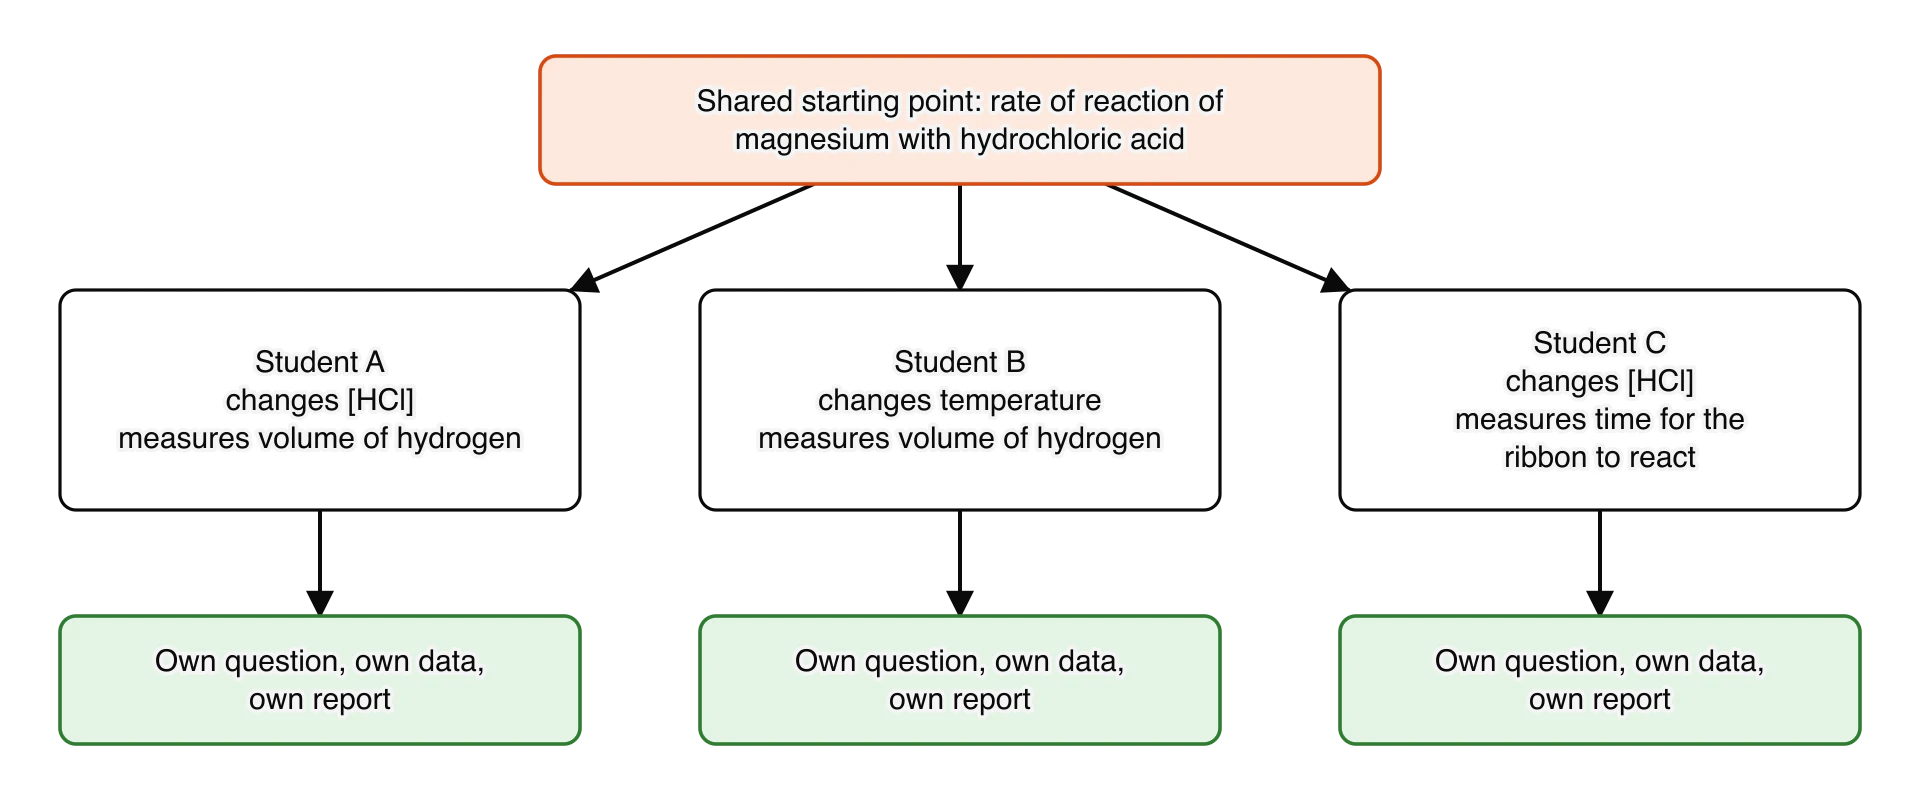
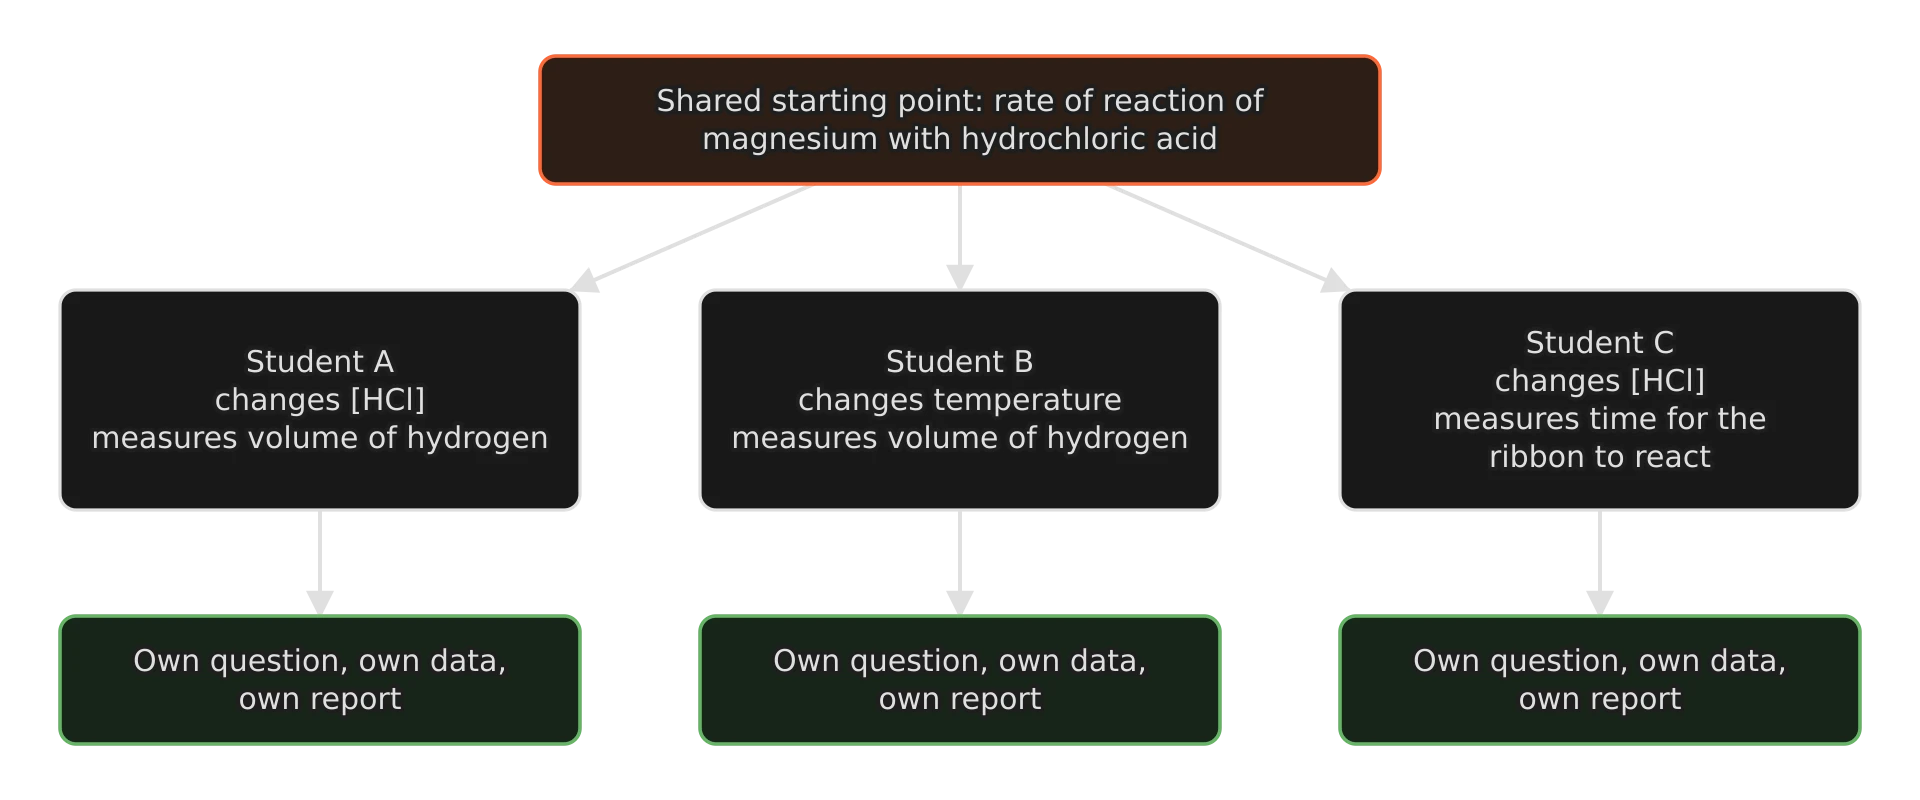
The method may grow partly out of group discussion, and students may help one another collect data, but all authoring is individual, including the description of the method. A group report is not allowed, and no student may present the same raw data as another. If a class builds a shared database with a standard protocol and a student uses it, the investigation counts as a database investigation: the method then focuses on how the student filtered and sampled data from the whole set.
Academic integrity
Every idea, value, method or image taken from a source must be cited in the text and listed in the bibliography, in enough detail that a reader could find it. Omitted or improper referencing is treated as academic misconduct. Collusion, where one student’s work is presented as another’s or two students submit work that should be individual, is also misconduct. The difference between collaboration (allowed and encouraged within the rules) and collusion must be clear to every member of a group.
Literature values used for comparison, such as the standard enthalpy of combustion of ethanol from the data booklet or an activation energy from a journal article, need a citation just as much as a quoted sentence does. So does a method adapted from a textbook or a website. Adapting a published method is good practice; presenting it as one’s own is not.
Safety, ethics and the environment
Chemistry investigations involve hazardous substances, so every method needs a risk assessment before practical work begins, and the report summarizes the relevant points. Concentrated acids and alkalis, flammable alcohols, toxic metal ions such as copper(II) and lead(II), and gases such as sulfur dioxide (released by the thiosulfate–acid reaction) are typical hazards. Schools follow their own national or local rules, and the teacher must approve the method before it is carried out.
Ethical and environmental considerations also count. Wasteful use of chemicals, disposal of heavy-metal solutions down the sink and investigations on living organisms or human subjects without proper consent all need to be addressed. Using small volumes (a microscale method), choosing less hazardous reagents and planning how each waste solution will be disposed of are as much part of a good design as the choice of glassware.
Timeline: from idea to final report
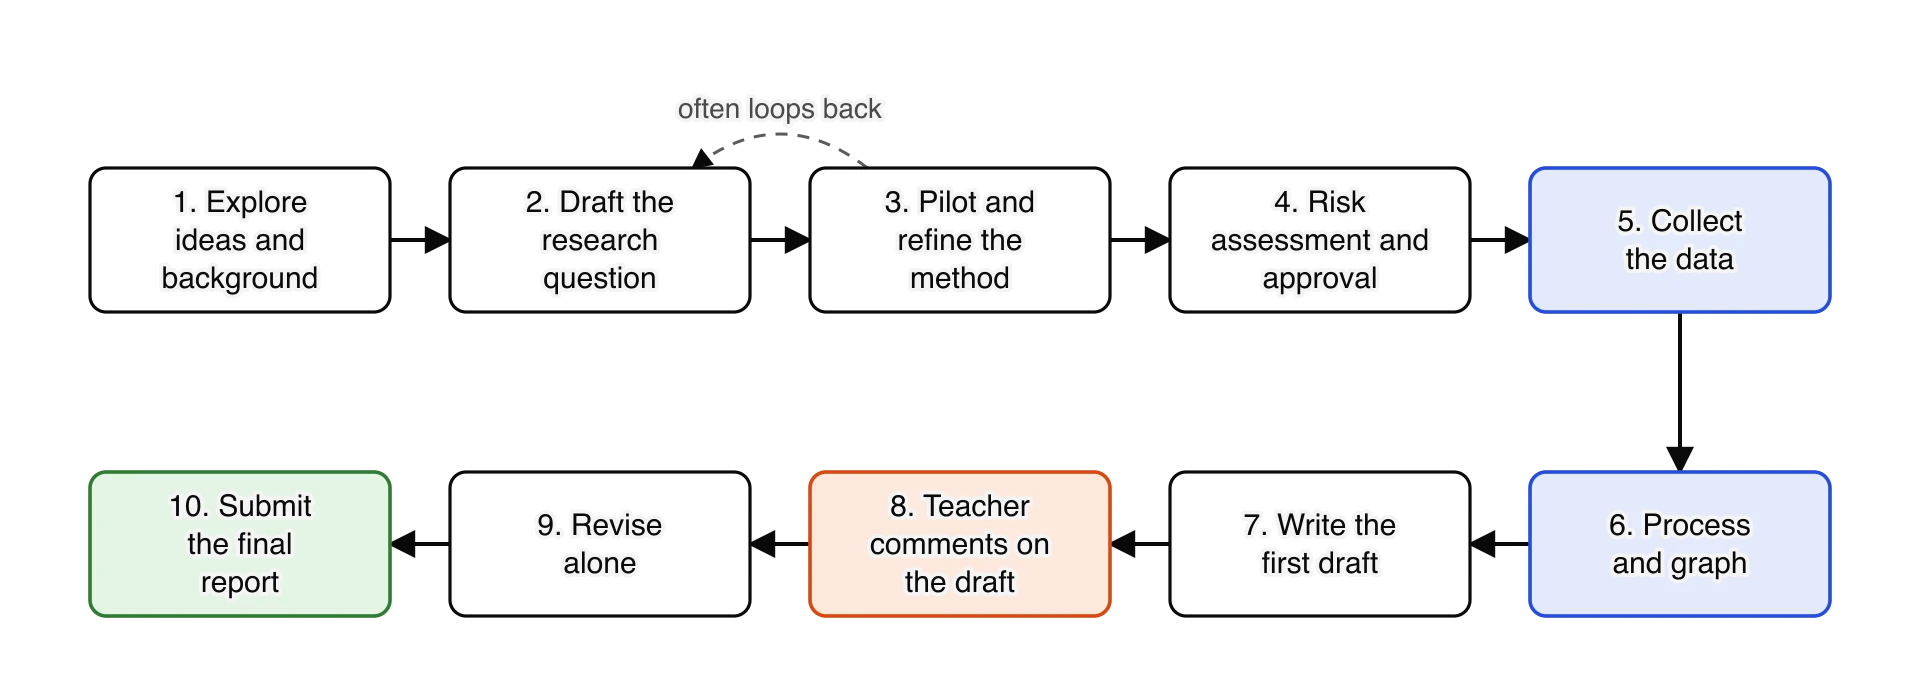
Schools set their own calendars, but most investigations follow the same sequence. Practical work usually comes after the first year of the course, when students have met enough chemistry to choose a meaningful question.
Stage by stage
Explore. Read around a topic of interest, look at how others have measured similar quantities, and try a few quick tests. A rate, an enthalpy change or a concentration that varies with something the student can control is a promising start.
Draft the research question. Name the independent variable with its range, the dependent variable with how it is measured, and the system.
Pilot. Run a few trial measurements to check the range, the timing, the precision of the instruments and the hazards. A pilot often changes the question: a reaction may be too fast to time at the highest concentration, or a colour too pale to measure at the lowest.
Risk assessment and approval. Write the hazards, precautions and disposal for each chemical, and agree the method with the teacher.
Collect the data. Record raw data and qualitative observations directly into a table, with units and uncertainties, as they are taken.
Process and graph. Calculate means and derived quantities with their uncertainties, and plot the graph that tests the prediction. Doing this promptly allows extra data to be collected if a gap appears.
Write the first draft, complete enough for useful comments.
Teacher comments on the draft, once.
Revise alone, responding to the comments.
Submit the final report.
A sensible structure for the report
There is no compulsory format, but the moderator must be able to find the evidence for each criterion quickly. Headings that follow the inquiry make this easy.
Section | Contents | Main criterion |
|---|---|---|
Research question and background | The question; the chemistry behind it, with equations; a prediction | Research design |
Variables | Independent, dependent and control variables, with how and why each is controlled | Research design |
Method | Apparatus with uncertainties, a numbered procedure, pilot results, safety, ethics and disposal | Research design |
Raw data | Tables of raw measurements with units and uncertainties; qualitative observations | Data analysis |
Processing | A sample calculation of each step, uncertainty propagation, processed data tables, graphs | Data analysis |
Conclusion | The answer to the question, supported by the processed data and uncertainties, compared with theory or literature values | Conclusion |
Evaluation | Strengths; specific weaknesses and limitations in order of impact; realistic improvements | Evaluation |
References | Every source cited in the text | All criteria |
A typical word budget for a 3,000-word report
Research question, background and prediction: about 500 words. Variables and method: about 700 words. Data analysis commentary (tables, graphs and calculations are not counted): about 400 words. Conclusion: about 500 words. Evaluation: about 700 words. This leaves a margin of about 200 words. The budget is a guide only, but a report that spends 1,200 words on background theory has little room left for the conclusion and evaluation, which together carry half the marks.
Applying the ideas
The scenarios that follow test the rules and the criteria. Each answer explains the reasoning a teacher or moderator would use.
Is this collaboration allowed?
Which words count?
Moving up a level
Choosing an approach
Self-check
- To do:
I can describe what the scientific investigation is and what makes a research question unique and quantitative.
- To do:
I can name the four criteria and state what each one assesses.
- To do:
I can explain how the command terms state, describe, explain and justify separate the levels of each criterion.
- To do:
I can apply the rules on the 3,000-word limit and on what does not count towards it.
- To do:
I can decide whether a group arrangement meets the rules on collaboration.
- To do:
I can explain the difference between collaboration and collusion, and cite every source I use.
- To do:
I can plan an investigation from first idea to final report, allowing time for piloting and processing.
- To do:
I can organize a report so that the evidence for each criterion is easy to find.
Carry on with Chemistry in Augment
With a free account, Augment remembers where you stopped in the notes and which questions you have marked.