Drawing structures, mechanisms and graphs
The conventions markschemes reward for Lewis formulas, structural formulas, 3D shapes, repeating units, curly-arrow mechanisms, energy profiles and sketched or plotted graphs.
- IB Chemistry
- Exam skills
- SL and HL
Many marks in chemistry are for drawings: a Lewis formula, the structure of an isomer, the repeating unit of a polymer, a mechanism with curly arrows, an energy profile, a Maxwell–Boltzmann sketch, a pH curve, a best-fit line. Each has fixed conventions, and markschemes list exactly which features earn the marks. A drawing that is chemically right but leaves out one required feature, such as a lone pair, a charge or a continuation bond, often scores zero.
The command term sets the standard. Draw asks for an accurate, labelled diagram, with every atom, bond and electron pair that the convention requires. Sketch asks for the general shape of a graph with its key features, but not accurate values. Annotate asks for brief notes on a diagram, and label for names of its parts.
Lewis formulas
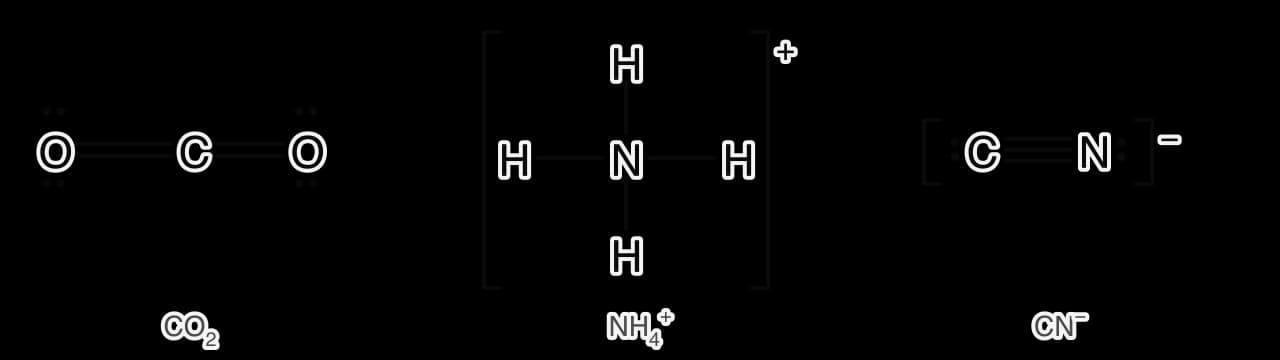
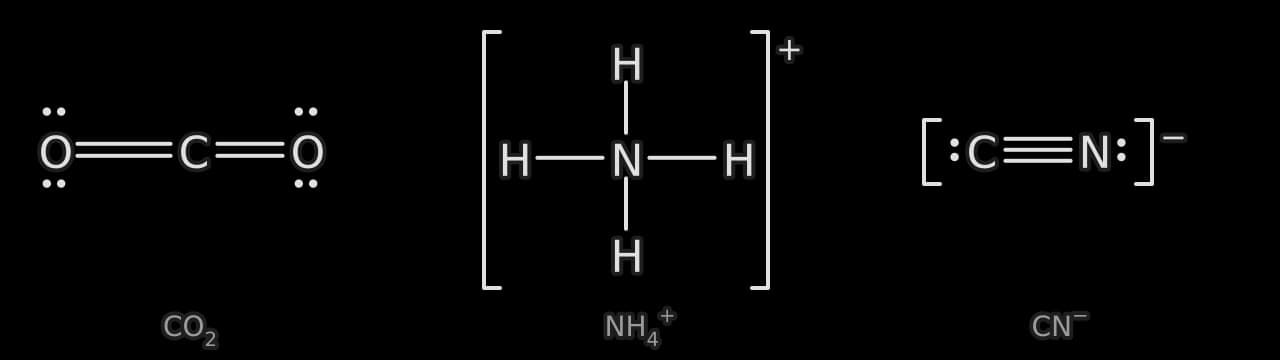
A Lewis formula shows all the valence electrons in a molecule or ion. The rules that markschemes apply are strict:
Show every bonding pair (as a line, a pair of dots or a pair of crosses) and every lone pair, including the lone pairs on halogen and oxygen atoms.
Any combination of dots, crosses and lines is accepted, but each pair of electrons must be clear.
For an ion, draw square brackets round the whole structure and write the charge outside, top right.
Check the total number of electrons: the sum of the valence electrons of the atoms, plus one for each negative charge, minus one for each positive charge.
A coordination bond may be drawn as an arrow from the donor atom, or as an ordinary line; both are accepted.
Structural and skeletal formulas
Organic structures are drawn in several ways, and the question says which is wanted. A full structural formula (displayed formula) shows every atom and every bond, including each C–H and O–H bond. A condensed structural formula writes the atoms in order, with groups in brackets, so that the structure is unambiguous. A skeletal formula shows the carbon chain as a zig-zag line, with carbon atoms at the ends and corners, hydrogen atoms on carbon left out, and functional groups drawn in.
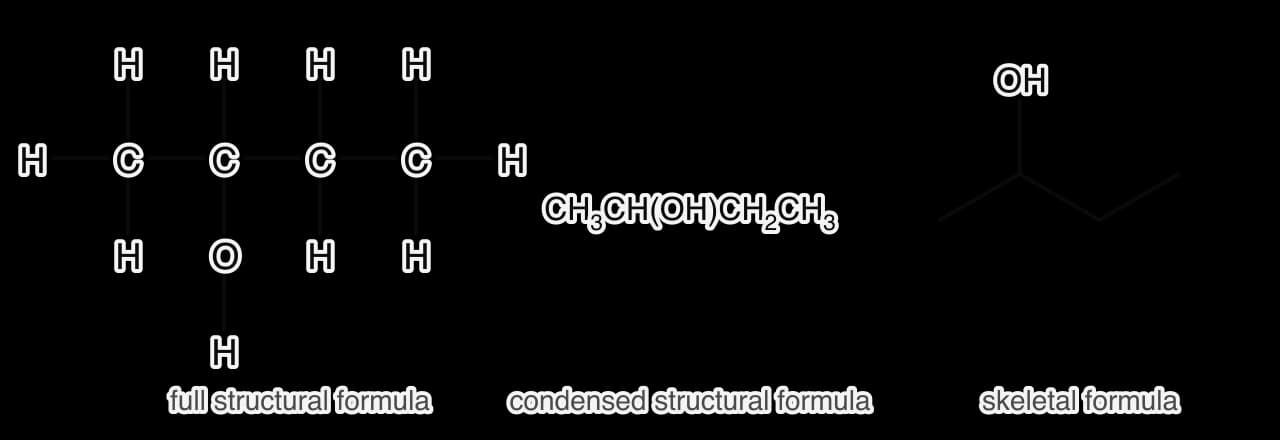
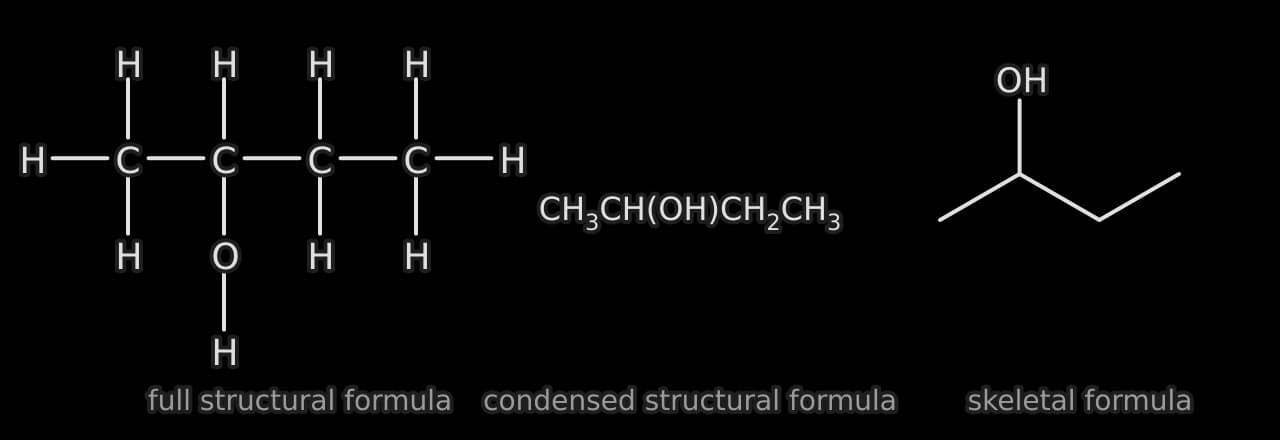
A full structural formula must show the O–H bond as a line, not "–OH", if the question asks for all bonds; markschemes vary, so drawing it costs nothing.
The C–O bond in an alcohol joins the carbon to the oxygen atom. Writing "HO–C" on the left of a chain is fine; a bond drawn from carbon to the H of OH is wrong.
A carboxyl group is , with both oxygen atoms drawn: one double-bonded to carbon and one single-bonded to carbon and hydrogen.
When a question asks for a structure "showing all the bonds", use the full structural formula; when it asks for "the structural formula", a condensed formula is usually enough.
Three-dimensional shapes and bond angles
When a question asks for the shape of a molecule to be drawn, the drawing must show its geometry in three dimensions. A plain line is a bond in the plane of the paper, a solid wedge is a bond coming towards the viewer, and a hashed wedge is a bond going away. A tetrahedral centre is drawn with two bonds in the plane, one wedge and one hashed bond. Lone pairs on the central atom are drawn as well, as a pair of dots or a lobe.
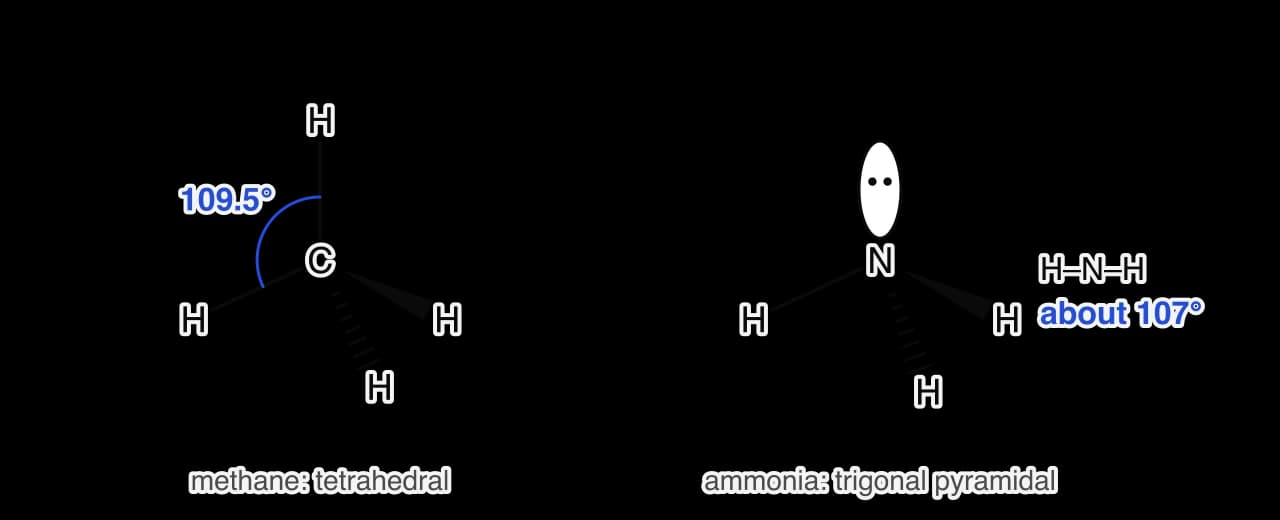
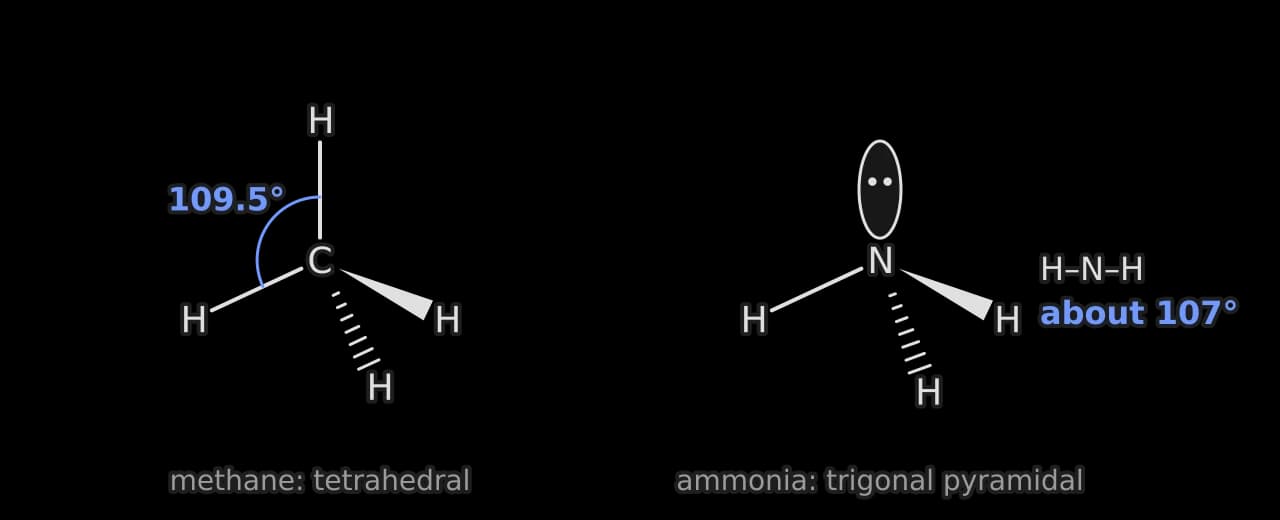
Most shape questions are marked on two points: the name of the shape and the bond angle. The angle is usually accepted within a range (for the trigonal pyramidal ammonia molecule, for example, values from about to ), but the reasoning must be right: lone pairs repel more strongly than bonding pairs, so they reduce the bond angle below . An "explain the shape" part needs the number of electron domains and the idea that they repel to be as far apart as possible.
Electron domains | Lone pairs | Molecular geometry | Bond angle | Example |
|---|---|---|---|---|
2 | 0 | linear | 180° | |
3 | 0 | trigonal planar | 120° | |
3 | 1 | bent | about 117° | |
4 | 0 | tetrahedral | 109.5° | |
4 | 1 | trigonal pyramidal | about 107° | |
4 | 2 | bent | about 104.5° |
At HL, five and six electron domains add trigonal bipyramidal, seesaw, T-shaped, octahedral, square pyramidal and square planar geometries; the drawing rules are the same, with wedges and hashes showing which bonds leave the plane.
Repeating units of polymers
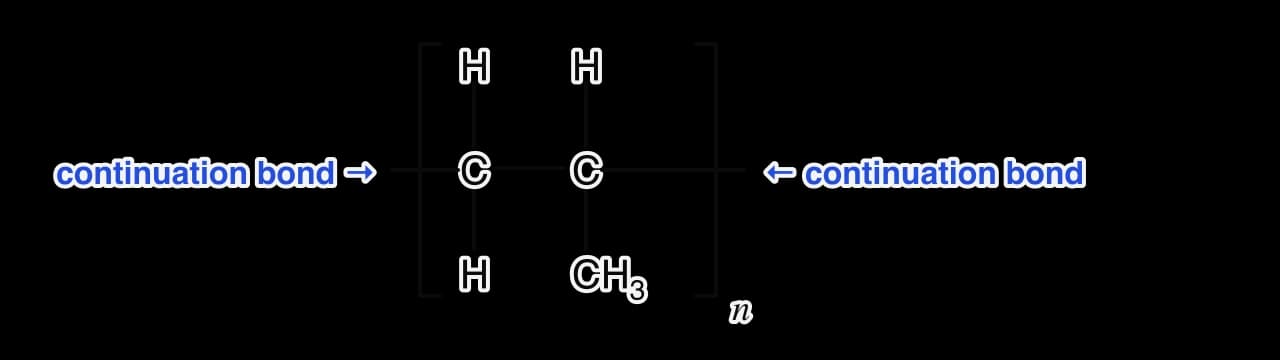
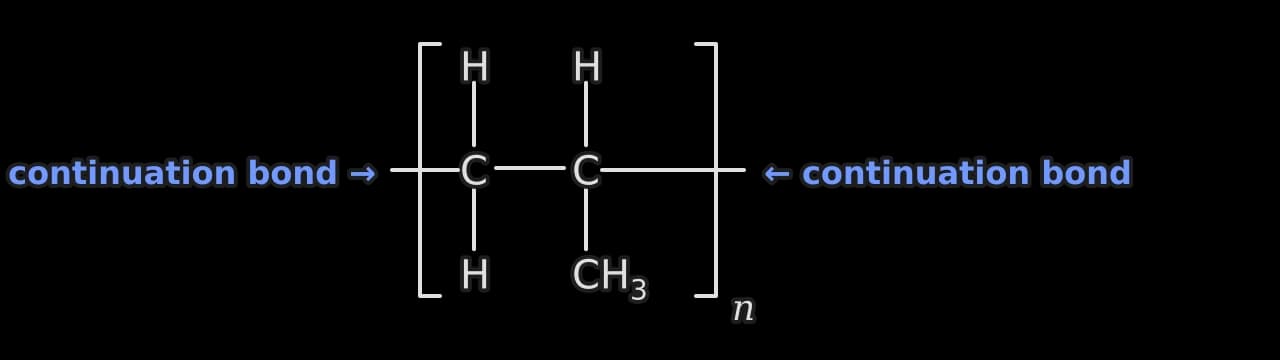
An addition polymer is drawn as its repeating unit: the two carbon atoms that were joined by the C=C double bond in the monomer, now joined by a single bond, with their substituents. The unit sits inside square brackets with an outside, and a continuation bond passes through each bracket to show that the chain carries on. At HL, the repeating units of condensation polymers (polyesters and polyamides) follow the same rule, with the ester or amide linkage inside the brackets.
Curly arrows and mechanisms
A curly arrow shows the movement of a pair of electrons. Mechanisms are marked arrow by arrow, and each arrow is judged on where it starts and where it ends:
A double-headed (two-barbed) curly arrow moves an electron pair; a single-barbed fish-hook arrow moves one electron, as in the homolytic fission that forms radicals.
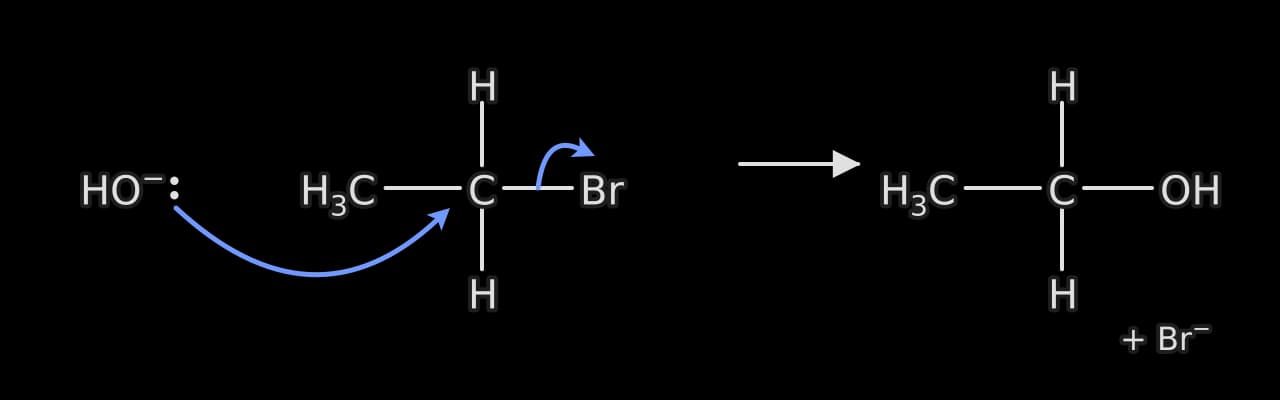
An arrow starts at a lone pair, a negative charge or the middle of a bond: wherever the electrons are. It never starts at an atom symbol with no electrons drawn, or at a hydrogen atom.
An arrow ends at the atom that receives the electrons, or between two atoms where a new bond forms.
Every species shows its charges, and an ion or nucleophile that donates a pair shows that lone pair.


In heterolytic fission, both electrons of the bond go to one atom, usually the more electronegative one, and two ions form. In homolytic fission, one electron goes to each atom and two radicals form, which needs ultraviolet light or heat for a molecule such as chlorine.
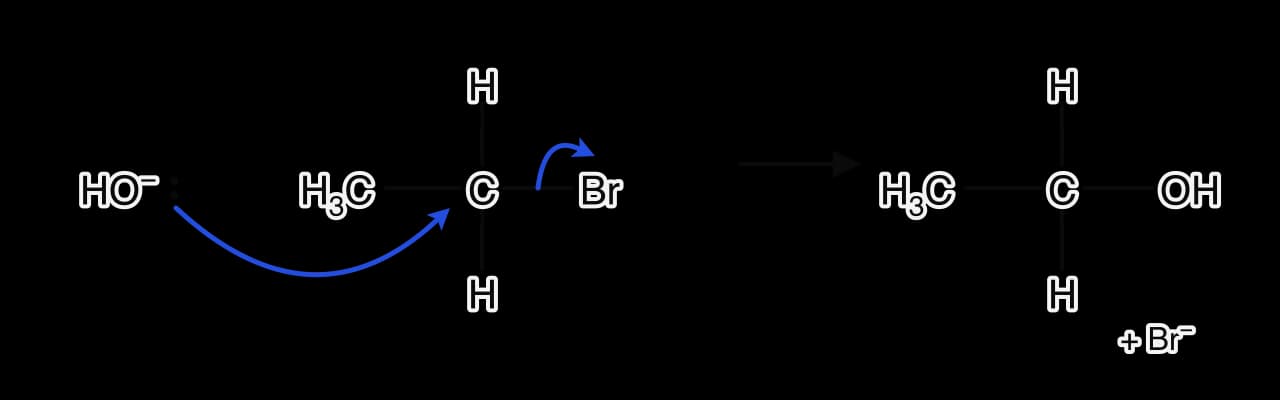
The SL mechanism that uses curly arrows is nucleophilic substitution of a halogenoalkane. The nucleophile donates a lone pair to the carbon atom bonded to the halogen, which carries a partial positive charge, and the carbon–halogen bond breaks heterolytically so that the halogen leaves as a halide ion.
Energy profiles and enthalpy diagrams
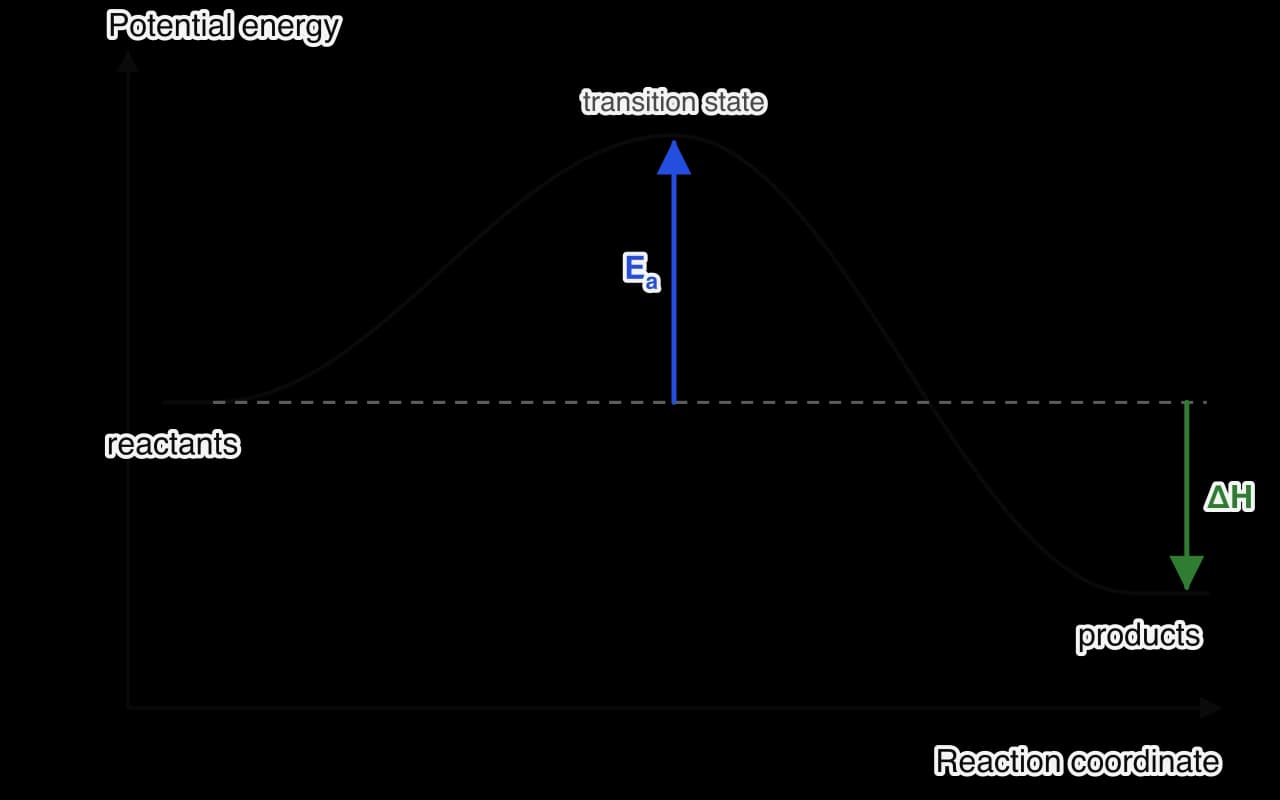
An energy profile plots potential energy against the reaction coordinate. A complete one has both axes labelled ("Potential energy" and "Reaction coordinate"), the reactants and products labelled at the correct relative heights, a single hump for a one-step reaction, and two arrows: the activation energy from the reactants up to the top of the hump, and from the reactants to the products.
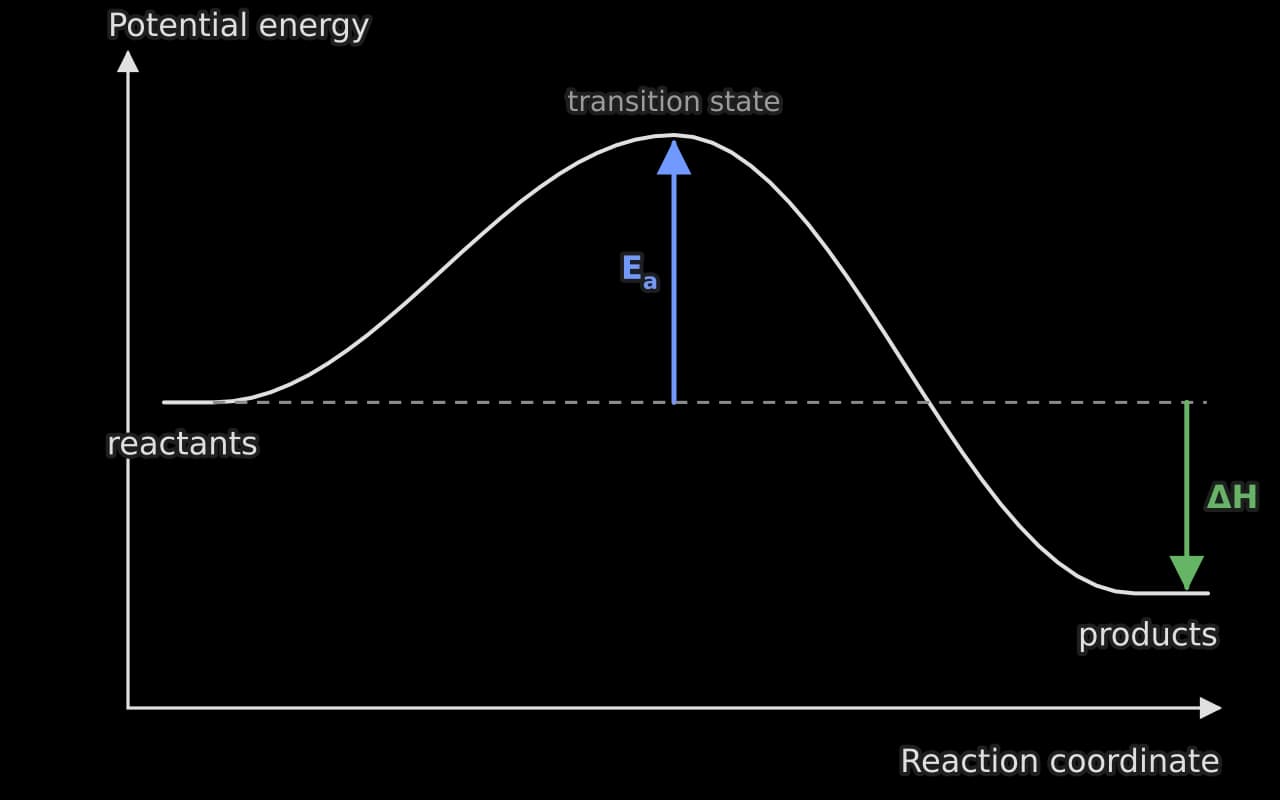
For an exothermic reaction the products are lower than the reactants and the arrow points down; for an endothermic reaction they are higher and the arrow points up.
The arrow starts at the reactant level, not at zero and not at the products. The activation energy of the reverse reaction runs from the products to the peak.
A catalysed pathway is drawn as a lower hump between the same reactant and product levels, so is unchanged; label both curves.
At HL, a two-step mechanism has two humps with an intermediate in the dip between them; the higher hump belongs to the rate-determining step.
An enthalpy level diagram is simpler: two horizontal levels labelled with the reactants and products, including state symbols, and one vertical arrow between them labelled with and its sign. It has no hump, because it shows only the overall energy change, not the pathway.
Sketching and plotting graphs
Sketch graphs
A sketch shows the shape of a relationship and its key features, without a scale. Label both axes with the quantities (and units if values are marked), start the curve where the chemistry says it starts, and show the features the question tests: where the curve peaks, where it levels off, which of two curves lies above the other, where it crosses an axis. Markschemes usually give one mark for labelled axes and one or two for the features.
Sketch | Features that earn the marks |
|---|---|
Maxwell–Boltzmann distribution | axes "number of particles" and "kinetic energy"; curve from the origin, never touching the energy axis again; at a higher temperature, a lower peak further right and above the original curve at high energy |
Concentration of reactant against time | starts at the initial concentration; falls steeply at first, then more slowly; levels off (at zero if the reactant is used up) |
Volume of gas product against time | starts at the origin; steep at first; levels off at the final volume; a faster reaction is steeper but levels off at the same volume if the limiting amount is the same |
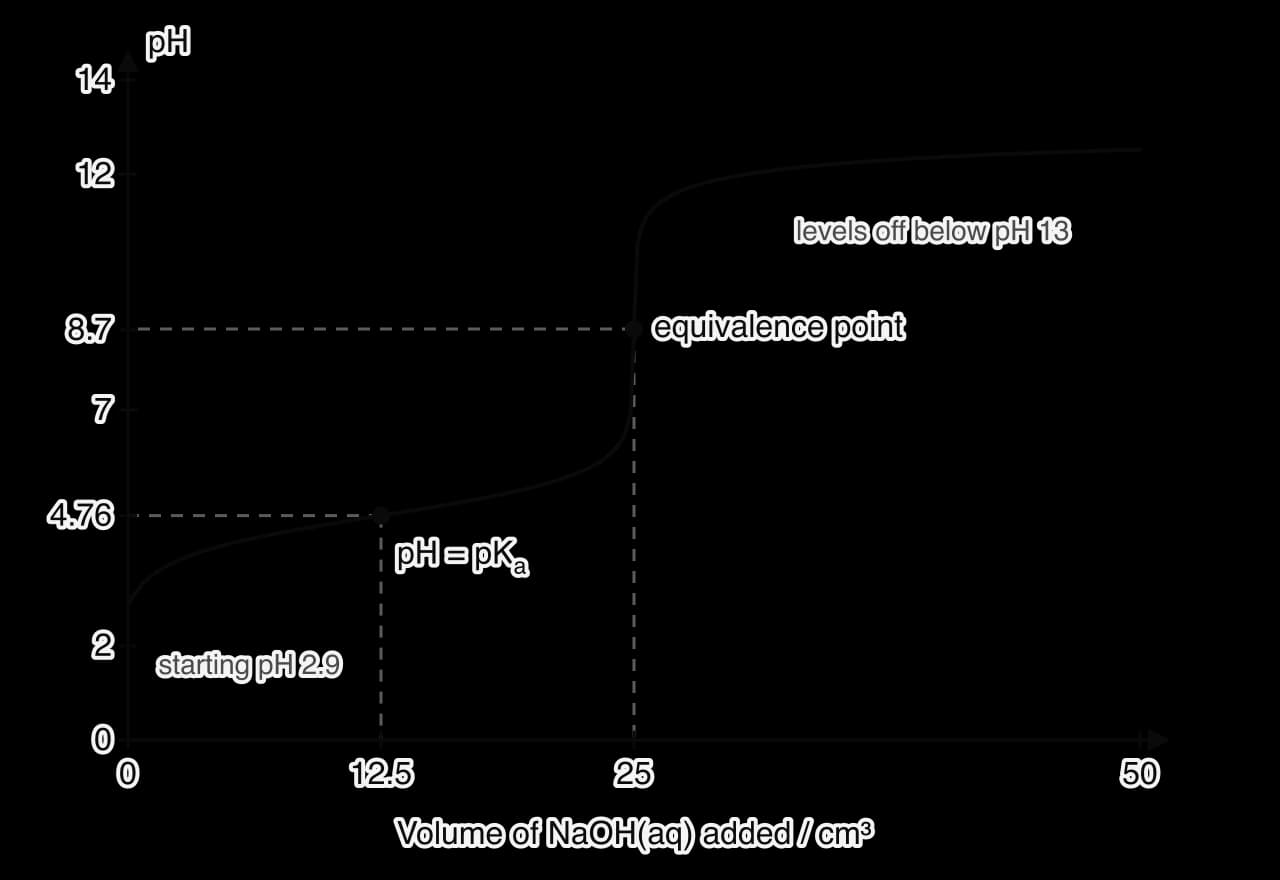
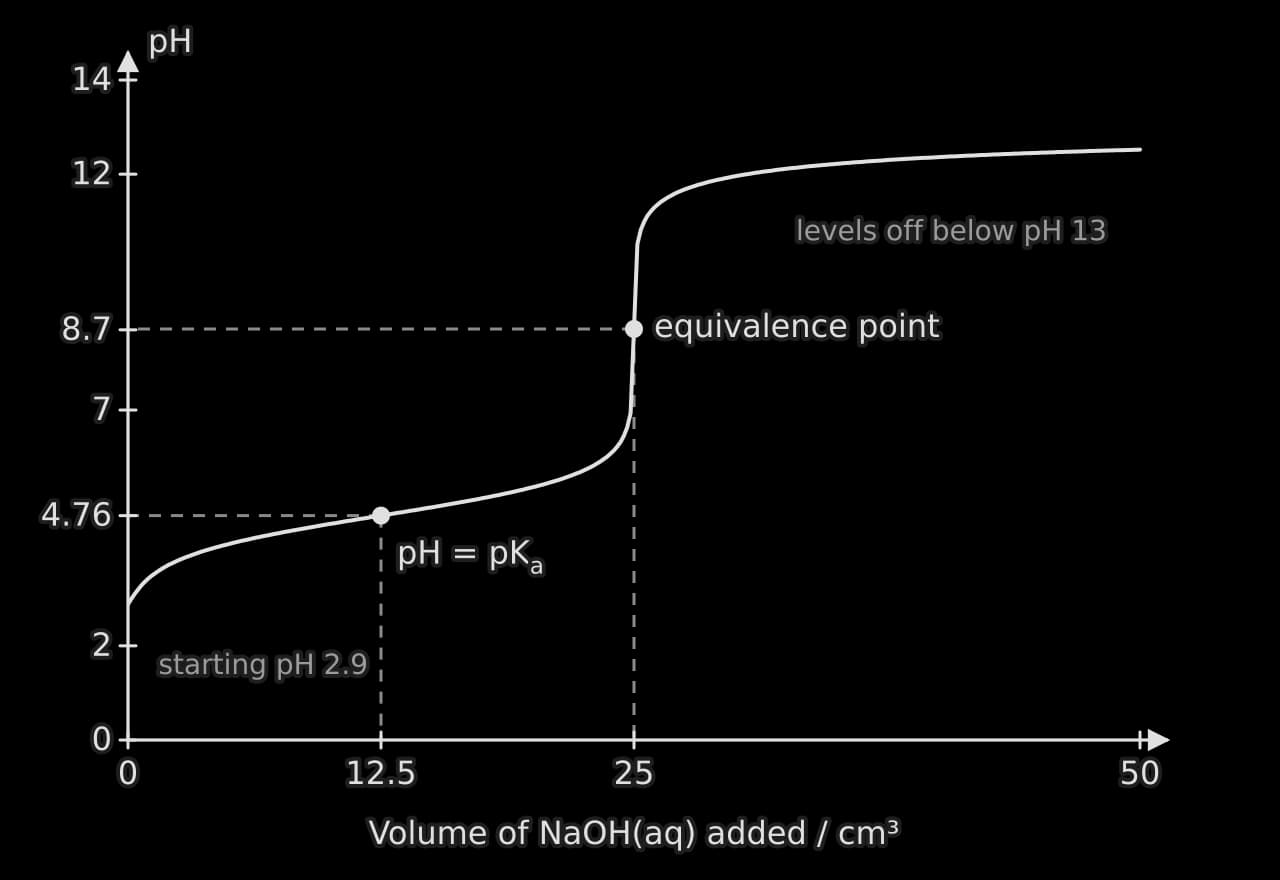
pH curve (HL) | correct starting pH; shape (buffer region for a weak acid or base); vertical section at the equivalence volume; correct equivalence pH; correct final level |
Pressure–volume for a fixed mass of gas | curve falling towards both axes without touching them (inverse proportion) |
The pH curve for a weak acid titrated with a strong base shows how the features of a sketch carry the chemistry. The starting pH is higher than for a strong acid of the same concentration, the curve rises gently through a buffer region, the pH equals at half the equivalence volume, and the equivalence point lies above pH 7.
Plotted graphs and best-fit lines
When data are plotted, draw applies. Choose scales that use most of the grid and go up in convenient steps (1, 2 or 5 units per division); label each axis with the quantity and its unit ("Volume of gas / cm³"); plot each point accurately as a small cross or dot; and draw one line of best fit. The best-fit line is a single straight line or smooth curve that passes as close as possible to as many points as it can, with points scattered on both sides. It is never drawn dot to dot, and it does not have to pass through the first or last point, or through the origin unless the chemistry requires it.
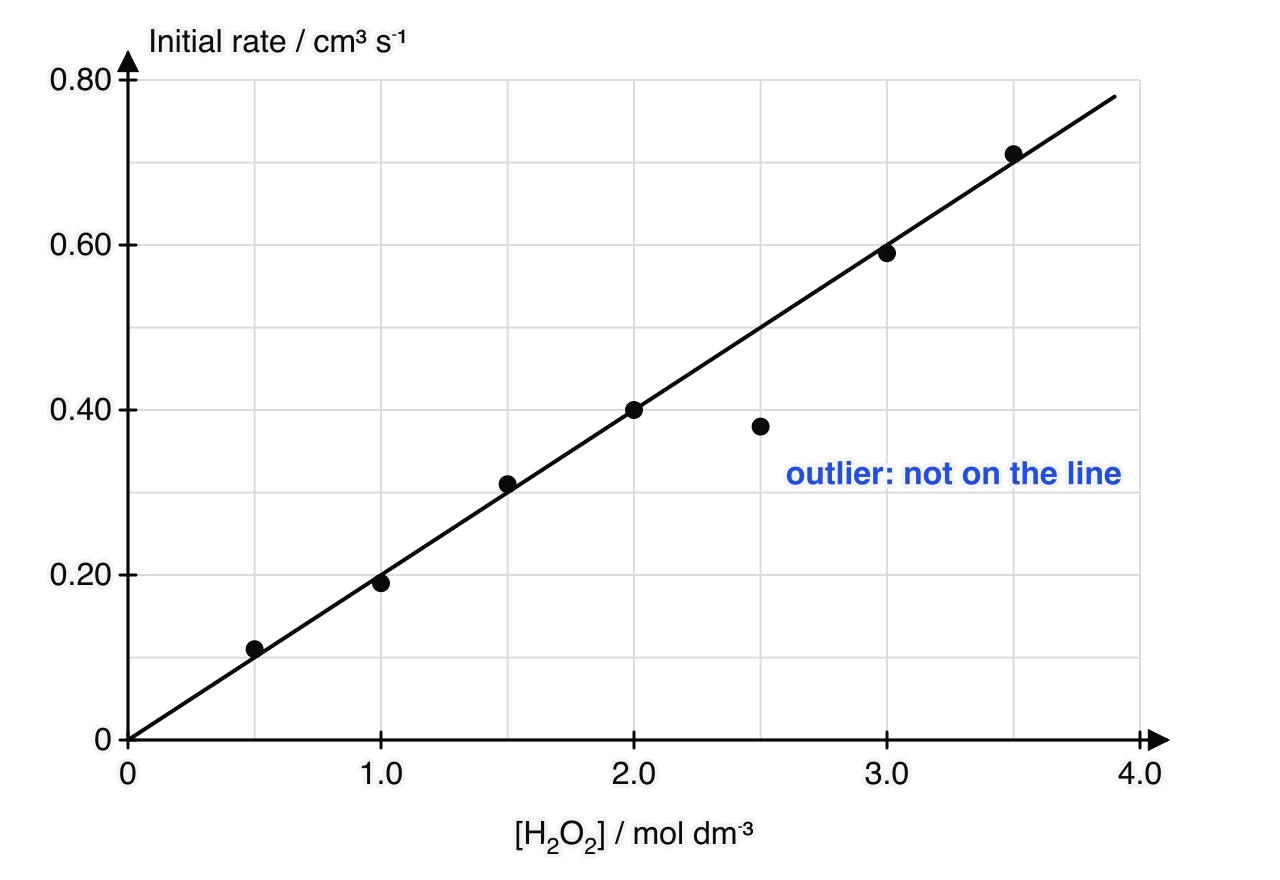
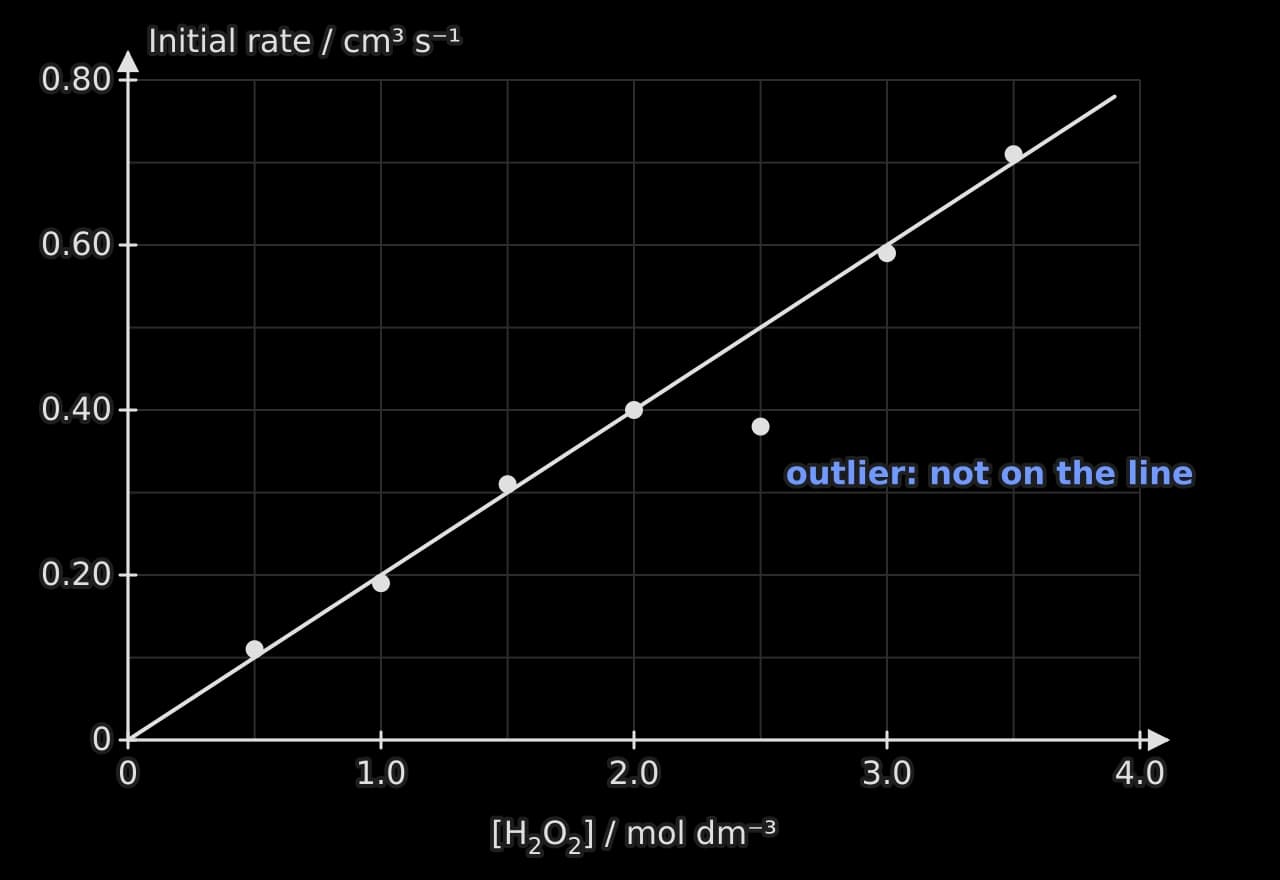
An outlier is ignored when the line is drawn, and identified (circled or labelled) if the question asks. A tangent, used to find a rate at one instant, is a separate straight line that touches the curve at one point; its gradient is calculated from two well-separated points on the tangent, not on the curve.
Self-check
- To do:
I can draw Lewis formulas showing every bonding pair and lone pair, with ions in square brackets and their charge.
- To do:
I can draw full structural, condensed structural and skeletal formulas, and choose the one a question asks for.
- To do:
I can draw three-dimensional shapes with wedges and hashed bonds, and state their bond angles with the reasoning.
- To do:
I can draw the repeating unit of an addition polymer with continuation bonds and no double bond.
- To do:
I can draw curly arrows that start at a lone pair or bond and end at the atom receiving the electrons, and fish-hook arrows for single electrons.
- To do:
I can draw the nucleophilic substitution of a halogenoalkane with curly arrows, and the SN2 transition state (HL).
- To do:
I can draw and label energy profiles and enthalpy level diagrams for exothermic and endothermic reactions, with and without a catalyst.
- To do:
I can sketch Maxwell–Boltzmann distributions, concentration–time and gas volume–time graphs, and pH curves (HL) with their key features.
- To do:
I can plot data with suitable scales and labelled axes and draw a single line of best fit that ignores outliers.
Carry on with Chemistry in Augment
With a free account, Augment remembers where you stopped in the notes and which questions you have marked.