Choosing a research question
How to turn an interest into a focused, measurable chemistry research question, identify the independent, dependent and control variables, make a prediction from theory and check that the question is feasible.
- IB Chemistry
- Internal assessment
- SL and HL
The research question is the single sentence the whole investigation sets out to answer. It decides what is measured, which graph is drawn, what the conclusion can claim and what the evaluation examines, so it is worth sharpening before any data are collected. A good chemistry research question names one variable that is changed and one that is measured, says which reaction or system they belong to and over what range, and can be answered safely with the apparatus and time available.
Many weak investigations go wrong at this first step. A vague question ("What affects the rate of a reaction?") cannot lead to a precise method, and a question with no link to chemistry ("Which brand of bleach is best?") leaves nothing to compare the result with. Narrowing an idea into a good question is a skill that improves with practice, and it can be applied to any part of the course.
What makes a research question good
A strong research question has five features. It is focused on one relationship. It names the independent variable with its range or its values, and the dependent variable with how it will be measured. It describes the system: the reaction, the substances and any fixed conditions that matter. And it is answerable with numbers, so that the conclusion can state a relationship or a value rather than a yes or no.
The question is usually written as "How does [independent variable, with range] affect [dependent variable, and how it is measured] in [system]?" The form is not compulsory, but it makes it hard to leave anything out. Where the investigation uses the relationship to determine a quantity, the question can say so: "… and what is the activation energy of the reaction?"
Weak | Better | Strong |
|---|---|---|
Does temperature affect reaction rate? | How does temperature affect the rate of the reaction between sodium thiosulfate and hydrochloric acid? | How does the temperature of the reaction mixture (20, 30, 40, 50 and 60 °C) affect the time taken for the sulfur precipitate to obscure a mark, when sodium thiosulfate reacts with hydrochloric acid? |
How much vitamin C is in juice? | How does storage time affect the vitamin C content of orange juice? | How does the time for which freshly squeezed orange juice is stored open at 20 °C (0 to 5 days) affect its ascorbic acid concentration, determined by titration with DCPIP? |
What affects the voltage of a cell? | How does concentration affect the potential difference of a cell? | How does the concentration of copper(II) sulfate in the copper half-cell (0.0010 to ) affect the potential difference of a zinc–copper voltaic cell at 25 °C, with zinc sulfate in the other half-cell? |
The strong versions do more than add detail. Each one fixes the measurement method (time to obscure a mark, a titration, a voltmeter reading), so the method section follows directly. Each sets a range wide enough to show a trend. Each names a system with known chemistry, so there is theory to make a prediction from and literature to compare with.
Variables
Identifying the variables precisely is the bridge between the question and the method. Each variable needs a name, a unit and a method: how the independent variable is set, how the dependent variable is measured, and how each control variable is kept constant. The variables table for the zinc and copper(II) sulfate investigation shows the level of detail that makes a method reproducible.
Variable | Type | How it is set, measured or controlled | Why it matters |
|---|---|---|---|
Concentration of | Independent | Six solutions, 0.10 to , made by diluting a standard solution with a burette and volumetric flask | Sets the amount of available to react |
Maximum temperature rise | Dependent | Digital thermometer ( °C) logging every 5 s; rise found by extrapolating the cooling curve back to the time of mixing | Proportional to the heat released by the reaction |
Mass of zinc powder | Control | g weighed on a balance, same batch of powder | Zinc becomes the limiting reactant at high concentrations |
Volume of solution | Control | from a burette | The same mass of solution absorbs the heat each time |
Calorimeter | Control | The same polystyrene cup with a lid, inside a beaker | Heat losses depend on the container and its insulation |
Initial temperature | Control (monitored) | Solutions left to reach room temperature; recorded for each run | Rate of heat loss depends on the temperature difference with the surroundings |
Stirring | Control | Stirred continuously with the thermometer at a steady rate | Zinc powder settles; poor mixing slows the reaction and lowers the peak |
Quantitative data are what the analysis is built on, but qualitative data often explain them. In the zinc investigation, noting that the blue colour disappears completely at low concentrations but remains at high concentrations is direct evidence that zinc becomes the limiting reactant, which supports the levelling-off in the temperature rise.
The measured variable and the processed variable
The dependent variable is the quantity actually measured, not a value calculated from it. In a titration investigation the measured variable is the titre, from which a concentration is calculated; in a calorimetry investigation it is the temperature change, from which is calculated; in a rate investigation it may be a time, a volume of gas or an absorbance, from which a rate is calculated. A clear report names the measured variable as the dependent variable and then explains how the processed quantity is obtained from it.
Continuous, discrete and categorical independent variables
A continuous variable can take any value within its range, such as temperature, concentration or volume. A discrete variable can take only certain values, such as the number of carbon atoms in an alcohol molecule. A categorical variable has named groups with no numerical order, such as brands of antacid or types of metal.
Continuous and discrete independent variables give a graph that tests a relationship: a trend, a gradient or a turning point. Categorical variables give only a bar chart that ranks the groups, which supports a much weaker conclusion. A categorical comparison can often be turned into a continuous one by finding the numerical property behind the categories. "Which metal reacts fastest with acid?" becomes stronger as "How does the standard electrode potential of the metal affect …", and "Which brand of antacid is best?" becomes "How does the mass of calcium carbonate per tablet affect …".
From a topic to a question
Most research questions start as a broad interest: a topic from the course, an everyday observation or a technique the student enjoyed. Narrowing it is a sequence of decisions. Choose a specific reaction or system; choose one variable to change and one to measure; decide which other variables must be fixed; then write the question with the range included. The funnel for an energetics investigation shows each decision in turn.
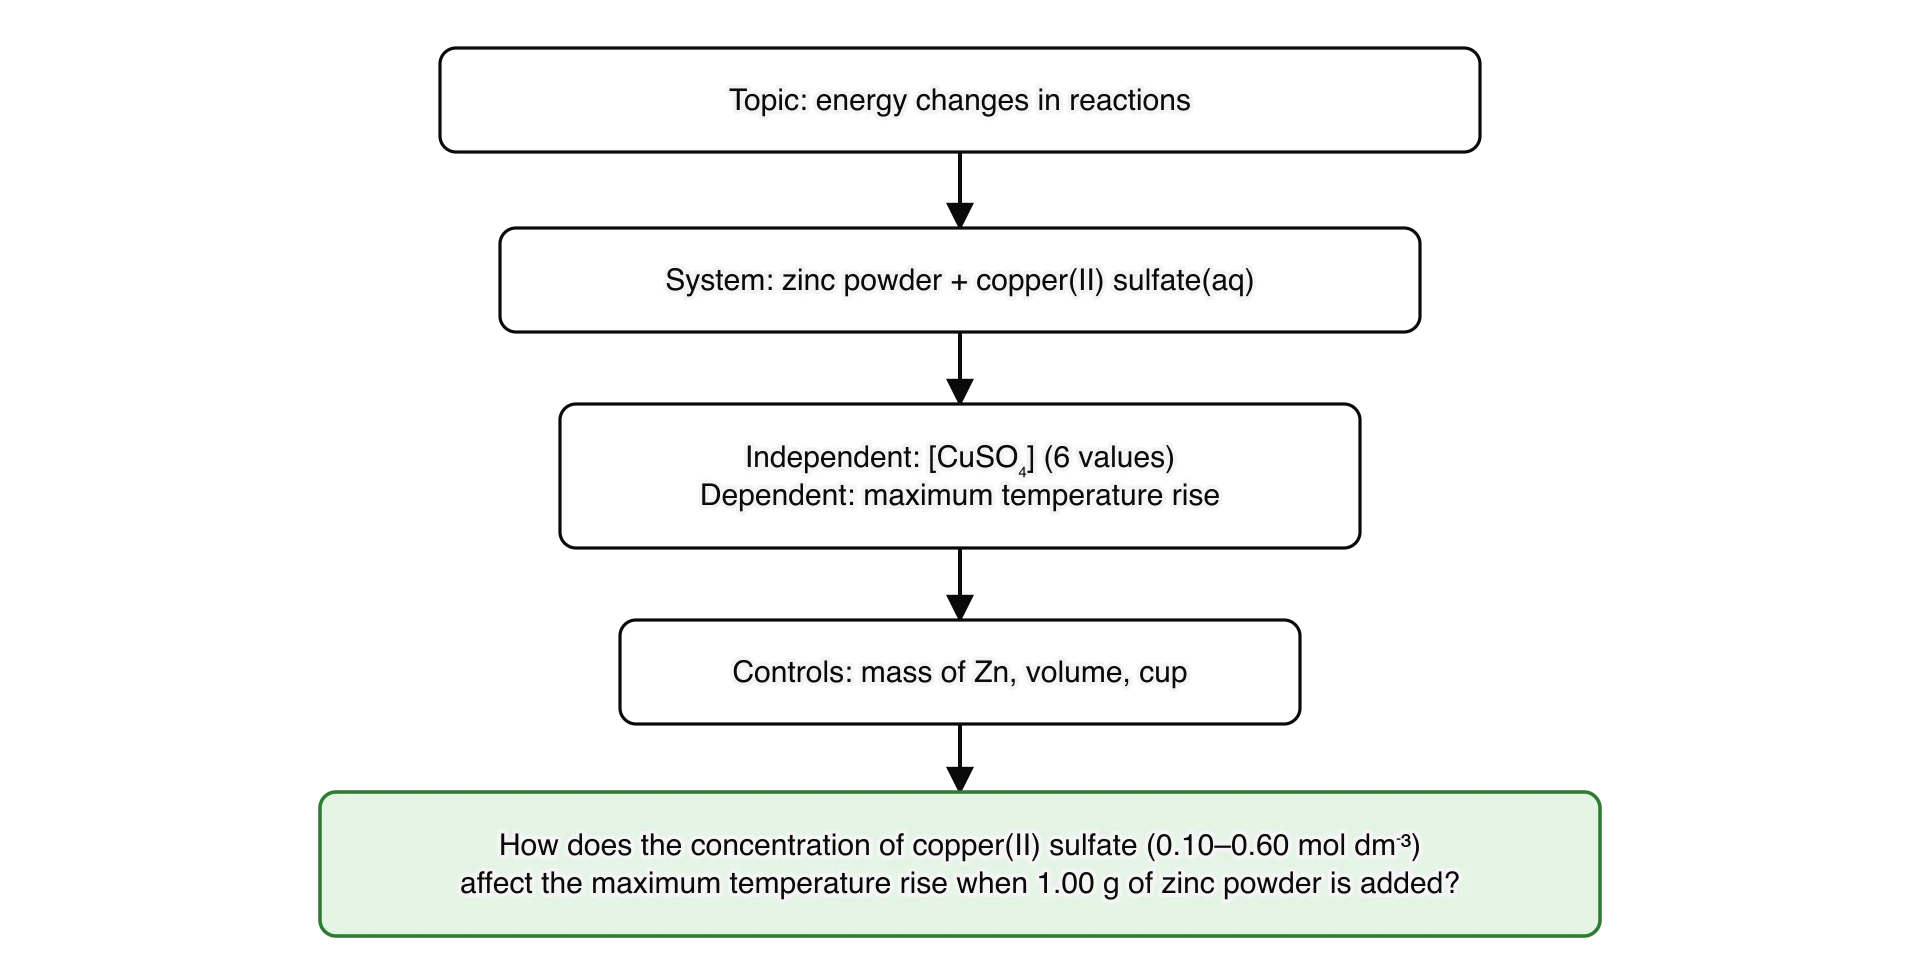
Each decision is checked against the apparatus and time available. Zinc powder and copper(II) sulfate are cheap and quick to use, a temperature probe measures the dependent variable directly, and six concentrations with three repeats each fit easily into two lessons. A topic that cannot pass these checks, however interesting, is better replaced early.
Background theory
The context that the Research design criterion asks for is the chemistry behind the question, explained briefly and precisely. It includes the balanced equation with state symbols, the principle that links the two variables, and any equation used in processing. For the zinc investigation it is:
together with , the idea that the heat released depends on the amount of the limiting reactant, and the reason heat losses make the measured temperature rise smaller than the true value. Background theory is not a general essay on enthalpy: anything the question does not use is left out.
Making a prediction
A prediction turns the theory into a specific expected result, ideally a shape of graph or a numerical value. It gives the conclusion something definite to test. A hypothesis is a testable explanation; the prediction is what the hypothesis says the data should show.
For the zinc investigation, the amount of zinc is fixed at . In of solution this is the same amount as the copper(II) ions in a solution. Below that concentration, copper(II) is limiting and the heat released is proportional to its concentration; above it, zinc is limiting and the temperature rise should stop increasing. The predicted graph has two straight sections.
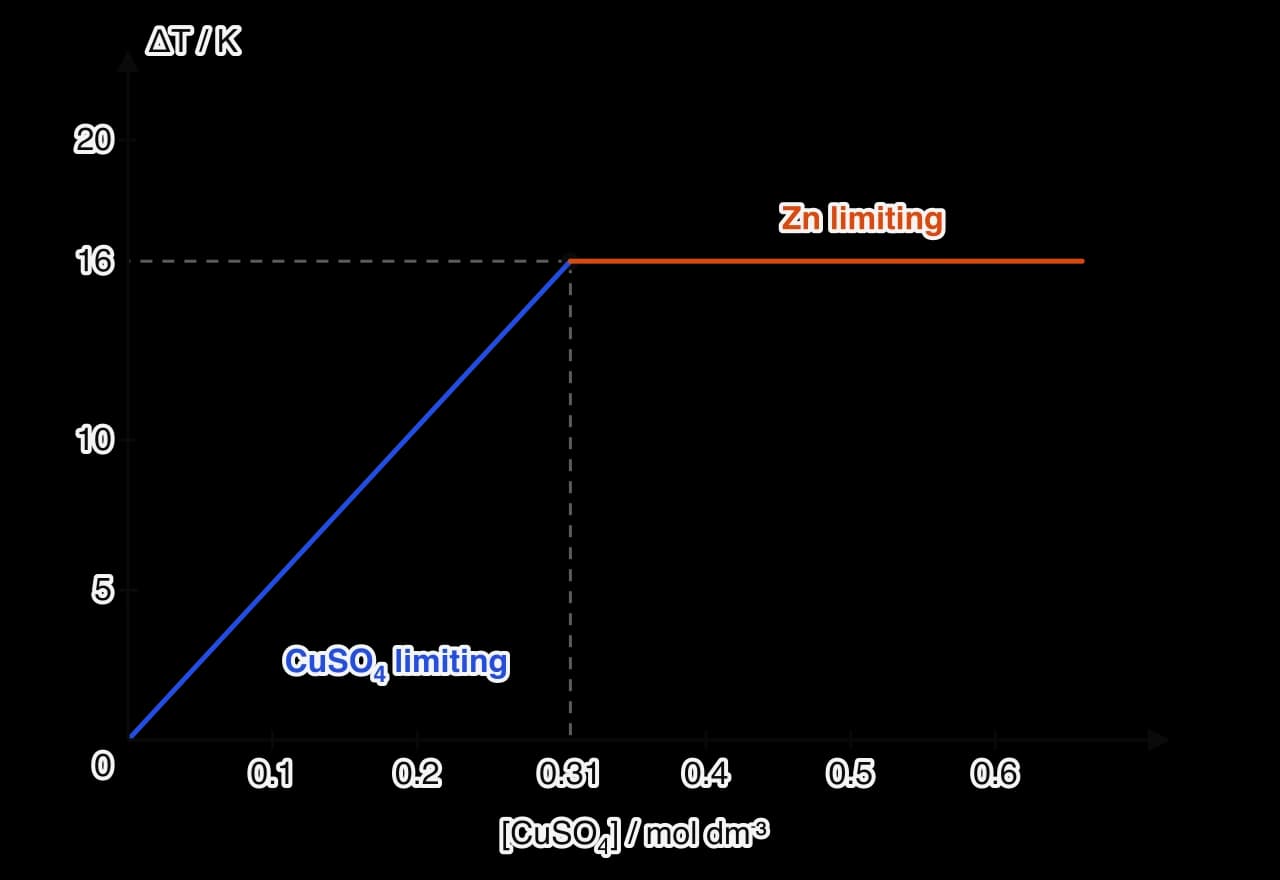
A prediction this specific makes the investigation much stronger. The data will either show a change of gradient near or not, and the size of the plateau can be compared with the calculated value of about 16 K. A real experiment will give a smaller rise because heat is lost, and the difference becomes a measure of the systematic error that the evaluation can discuss.
Improving weak questions across chemistry
The same improvements apply in every area of the course: replace a vague variable with a measurable one, add a range, name the system and the method, and connect the question to theory that predicts a result. Weak questions from four different areas of the course can each be improved in this way.
The improved rate question fixes the size range of the chips because surface area is now a control variable, and it chooses an initial rate because the rate falls as the acid is used up.
Turning a brand comparison into a graph of a continuous variable gives a gradient with an uncertainty, which supports a far stronger conclusion than a ranking.
The electrochemistry question goes slightly beyond the course, since the dependence of cell potential on concentration is described by the Nernst equation. That is acceptable: the student explains the extra theory in the background, and the course chemistry (voltaic cells, half-equations) supports it.
Every improved question in the examples names a quantity that changes smoothly with the independent variable, so the data can be graphed and tested against a prediction.
Questions for databases and simulations
A database investigation uses secondary data: values measured by others and published in a reliable source. It suits questions about patterns across many substances, which no school laboratory could measure. The research question still names two variables and a system, and it also defines the selection: which compounds are included, from which source, and why.
"How does the number of carbon atoms (1 to 10) affect the standard enthalpy of combustion of straight-chain alkanes and primary alcohols, using values from the NIST Chemistry WebBook?" The two homologous series can be compared on one graph, and the gradient (about per group) compared with a value from average bond enthalpies.
"How does the molar mass of straight-chain alkanes ( to ) correlate with their boiling point?" The London forces between molecules increase with the number of electrons, and the curve flattens as chains get longer.
"How does the electronegativity difference between the two elements in a binary compound correlate with its lattice enthalpy?" This needs a careful choice of compounds with the same ion charges, or the effect of charge swamps the trend.
A simulation investigation uses a computer model to generate data, for example an equilibrium or kinetics simulation. It suits questions where the real experiment is too slow, too hazardous or too expensive. The student must understand and describe the assumptions built into the model, because the conclusion can only be as good as those assumptions. A simulation that simply returns the textbook relationship it was programmed with tests nothing; combining it with real data, or using it to explore a range the laboratory cannot reach, gives it a purpose.
Checking feasibility
Before collecting data, the question is tested against practical limits. A short pilot run of two or three measurements at the extremes of the range answers most of these questions quickly.
Check | What can go wrong | Typical fix |
|---|---|---|
Range | At the highest concentration the reaction is over in 3 s and cannot be timed; at the lowest it takes an hour | Narrow the range, or measure an initial rate instead of a completion time |
Sensitivity | The dependent variable changes by less than its uncertainty across the whole range | Use a more precise instrument, a larger quantity of reactant, or a wider range |
Number of measurements | Too few values or repeats for a reliable graph in the time available | Use smaller volumes (microscale) so each run is quicker |
Safety | A reagent is too hazardous at the concentrations planned (for example from the thiosulfate reaction at high temperature) | Lower the concentration, use a fume cupboard, or choose a different system |
Cost and availability | A reagent is expensive, or the school has one colorimeter for twenty students | Choose a cheaper system, or book the instrument in advance |
Time | Each run takes 40 minutes, so 15 runs need 10 hours | Shorten each run, or reduce the number of variables measured |
Applying the ideas
Identifying the variables
Rewriting a question
Judging feasibility
Database or laboratory?
Self-check
- To do:
I can write a research question that names the independent variable with its range, the dependent variable with how it is measured, and the chemical system.
- To do:
I can identify independent, dependent and control variables, and explain why each control variable matters.
- To do:
I can distinguish the measured dependent variable from a quantity calculated from it.
- To do:
I can distinguish continuous, discrete and categorical variables, and turn a categorical comparison into a numerical one.
- To do:
I can write background theory that includes only the chemistry the question uses, with a balanced equation.
- To do:
I can make a quantitative prediction from theory and sketch the expected graph.
- To do:
I can improve a weak research question in any area of chemistry.
- To do:
I can frame a question for a database or simulation investigation.
- To do:
I can use a pilot run to check the range, sensitivity, safety and timing of an investigation.
Carry on with Chemistry in Augment
With a free account, Augment remembers where you stopped in the notes and which questions you have marked.