Conclusion and evaluation
How to justify a conclusion with processed data and uncertainties, compare it with the accepted scientific context, and evaluate weaknesses and limitations by their relative impact, with realistic improvements.
- IB Chemistry
- Internal assessment
- SL and HL
The Conclusion and Evaluation criteria together carry half the marks of the internal assessment. The conclusion answers the research question using the analysis and compares the answer with accepted chemistry. The evaluation judges how far the method can be trusted: which weaknesses and limitations affected the result, how much each mattered, and what would realistically improve it.
Both depend on the analysis. A conclusion is only as strong as the processed data and uncertainties behind it, and an evaluation is only specific if it can point to features of the data, such as a non-zero intercept, a large scatter at one end of the range, or a result outside the uncertainty of the literature value. Two investigations illustrate both criteria: the enthalpy change of the reaction between zinc and copper(II) sulfate, and the effect of acid concentration on the initial rate of reaction with magnesium.
What the criteria reward
Criterion and strand | 1–2 | 3–4 | 5–6 |
|---|---|---|---|
Conclusion: relevance and consistency | Stated; relevant but not supported by the analysis | Described; relevant but not fully consistent with the analysis | Justified; relevant and fully consistent with the analysis |
Conclusion: scientific context | Superficial comparison | Some relevant comparison | Justified through relevant comparison |
Evaluation: weaknesses and limitations | Generic ones stated | Specific ones described | The relative impact of specific ones explained |
Evaluation: improvements | Realistic improvements stated | Realistic, relevant improvements described | Realistic, relevant improvements explained |
The clarifications are precise about what the top level needs. A "fully consistent" conclusion interprets the processed data including their uncertainties. The "scientific context" can be published values, journal articles, textbooks or course notes, cited well enough to be traced. A "generic" weakness is one that would apply to almost any method. "Weaknesses" concern the control of variables, the precision of measurement and the variation in the data; "limitations" concern how far the conclusion extends, given the range of the data, the confines of the system and the assumptions made.
Writing a justified conclusion
Answering the question
The conclusion begins by answering the research question directly, in the same terms: the relationship found, or the value determined, with its uncertainty. It then gives the evidence: the specific processed values, the shape and gradient of the graph, and whether the trend is larger than the uncertainties.
For the magnesium investigation a justified conclusion reads: "Over the range to , the initial rate of hydrogen production is directly proportional to the concentration of hydrochloric acid. The graph of initial rate against concentration is a straight line of gradient , and its intercept () is zero within the range given by the steepest and shallowest lines. All five points lie within their error bars of the line (). Increasing the concentration fivefold increased the initial rate from to , a factor of , far larger than the uncertainties of 6–8 % in each mean."
Every claim is tied to a number from the analysis, and the uncertainties are used as evidence, not just reported. The conclusion also states its range: proportionality is shown between and , and nothing is claimed outside it.
Using the uncertainties as evidence
Uncertainties decide what a conclusion can claim. If the change in the dependent variable across the range is no larger than the error bars, the data cannot show a relationship, however tempting the trend in the means looks. If the error bars of two results overlap, the results cannot be said to differ. If a straight line passes through all the error bars, the data are consistent with a linear relationship; if no straight line can, the relationship is not linear over that range.
Comparing with the accepted scientific context
A conclusion is justified by comparing it with what is already known. For a determined value, the comparison is with a published or literature value: an enthalpy change from the data booklet or a data table, an activation energy from a journal article, the concentration printed on a product label. For a relationship, the comparison is with theory: collision theory predicts that the rate rises with concentration, and a rate equation predicts the shape of the graph.
The literature value needs a traceable citation, and it is worth checking more than one source. Published values for the enthalpy change of range from about to , depending on the data table used to calculate them from enthalpies of formation. A spread like this is itself part of the scientific context, and is a fair central value.
Percentage error and the uncertainty range
The percentage error on its own does not show whether a result is good. It becomes meaningful when compared with the percentage uncertainty. For the zinc result of :
The percentage error is about three times the percentage uncertainty. Random errors alone, which the uncertainty describes, cannot explain the difference; the result is too small in magnitude for a reason that affected every run in the same way, which is a systematic error. In a polystyrene-cup experiment the obvious candidate is heat lost to the surroundings, which always makes less negative. The comparison therefore leads directly into the evaluation.
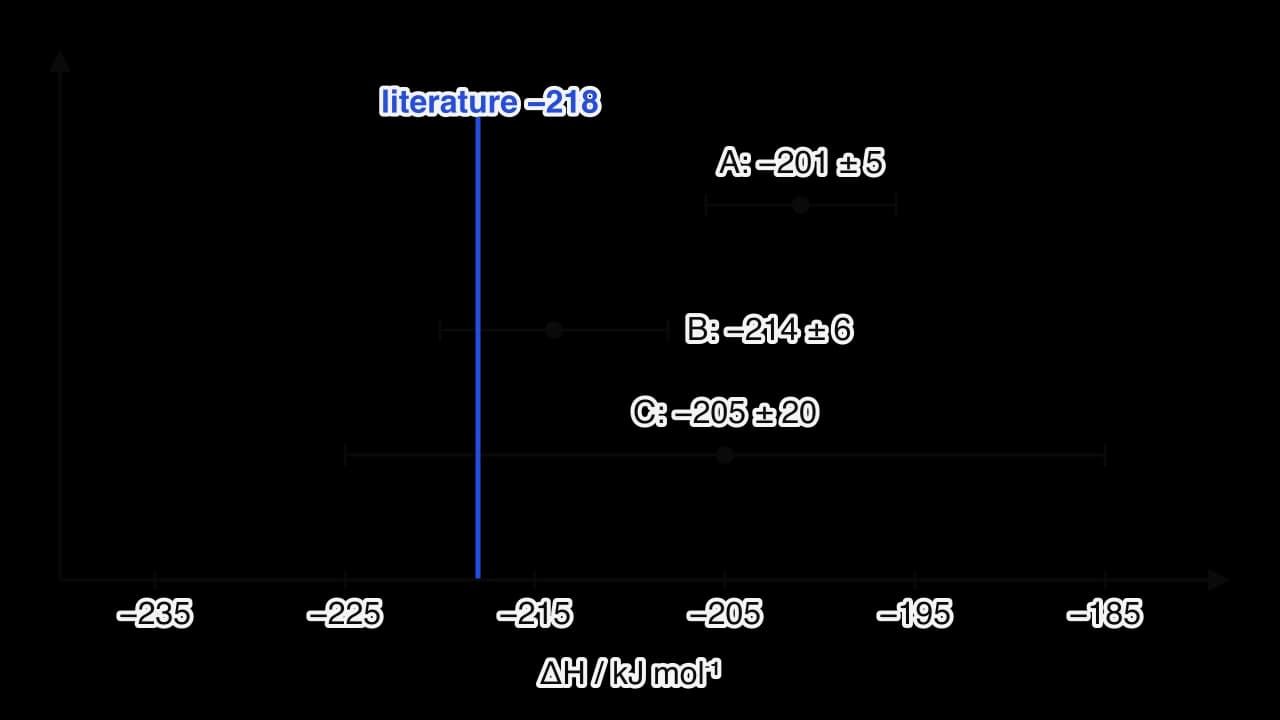
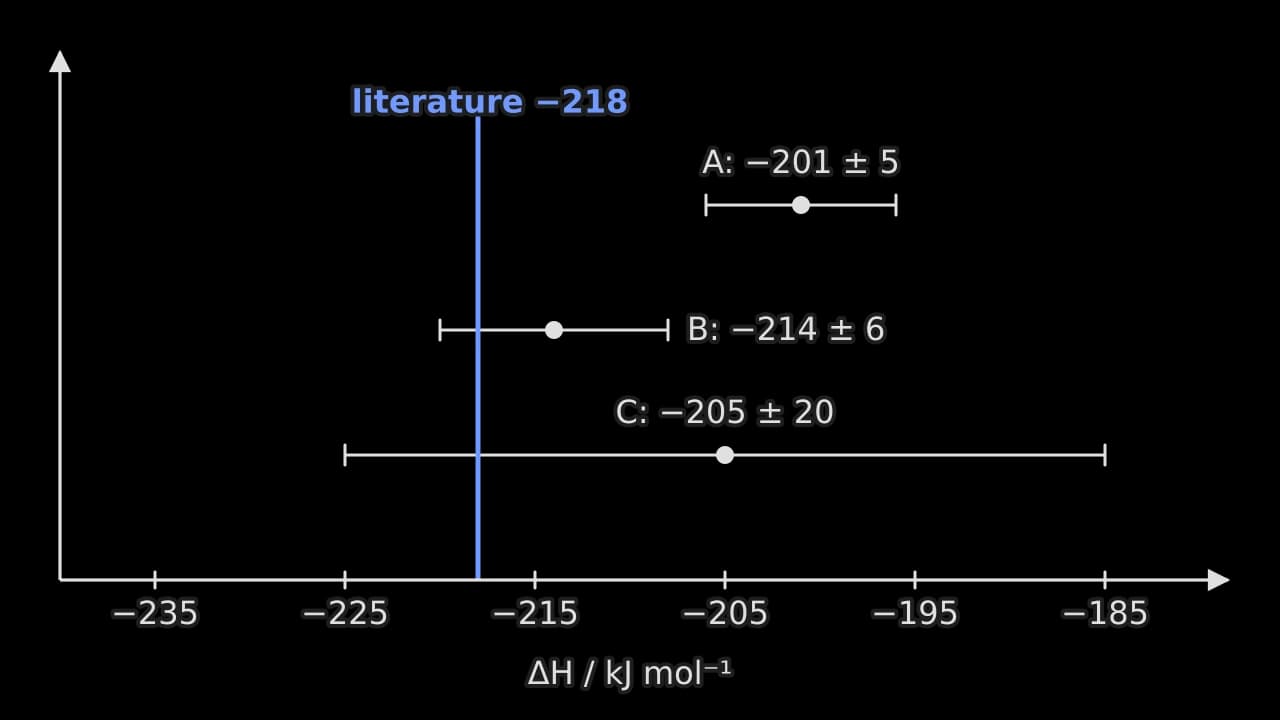
The comparison of three results with the literature value shows the possible outcomes. When the uncertainty range includes the accepted value (result B), the result agrees with it and there is no evidence of significant systematic error. When the range excludes it (result A), systematic error is present, and its direction (here, too small in magnitude) helps identify the cause. A very wide range (result C) agrees with almost anything, so the agreement is weak evidence; the useful conclusion is that the method needs to be more precise.
Comparing with theory
When the question is about a relationship, the scientific context is the model that predicts it. The proportionality between initial rate and acid concentration agrees with collision theory: doubling the concentration of hydrogen ions doubles the frequency of collisions with the magnesium surface, and so doubles the rate, if every other factor is the same. The conclusion can add a model-based interpretation, such as "the data are consistent with the reaction being first order with respect to over this range", and compare it with published kinetic studies, citing them.
Where the data disagree with the model, the disagreement is reported and explained, not hidden. A curve at high concentration might show that the reaction is limited by how fast hydrogen bubbles leave the surface, or that the solution warmed significantly in the fastest runs. A discrepancy explained with evidence from the investigation is a strength of a conclusion.
Weak and strong conclusions
Weak | Why it is weak | Strong |
|---|---|---|
"As concentration increased, the rate increased." | True but vague; no numbers, no uncertainty, no form of the relationship | "The initial rate is directly proportional to from 0.25 to : gradient …, intercept zero within uncertainty." |
"The enthalpy change was −201 kJ mol⁻¹, which is close to the literature value." | "Close" is not justified; the uncertainty is ignored | "; the 8 % error exceeds the 2.5 % uncertainty, so a systematic error, most likely heat loss, made the value less negative than ." |
"The hypothesis was proved correct." | Data cannot prove a hypothesis | "The data support the prediction from collision theory over the range tested." |
"The results were accurate and reliable." | Unsupported claims | Accuracy and precision are judged from the percentage error and the uncertainty, with numbers |
Evaluating the investigation
Random and systematic errors
Errors in an investigation are of two kinds, and they have different effects and different cures. Random errors make repeated measurements scatter unpredictably either side of the true value; they reduce precision and show up as the spread of repeats and the size of the error bars. Systematic errors shift every measurement in the same direction by a similar amount; they reduce accuracy and show up as a difference from the accepted value, or as a non-zero intercept on a graph that should pass through the origin.
Investigation | Random error (scatter) | Systematic error (shift) |
|---|---|---|
Calorimetry in a polystyrene cup | Judging the extrapolated temperature; fluctuations in the probe reading | Heat lost to the air and absorbed by the cup: always too small in magnitude |
Rate by gas syringe | Variation in the delay before the bung is inserted; reading a moving plunger | Gas lost before the bung is fitted; a sticking plunger that always reads low |
Titration | Judging the end point colour; reading the meniscus | A wrongly made standard solution; an indicator whose colour change lies away from the equivalence point |
Colorimetry | Fingerprints or bubbles on a cuvette in one reading | Colorimeter not zeroed with a blank: every absorbance too high |
Repeats reduce the effect of random errors on the mean, but they cannot detect or reduce a systematic error, because every repeat is shifted in the same way. A systematic error is found only by comparison: with an accepted value, with an independent method, or with what the graph should look like.
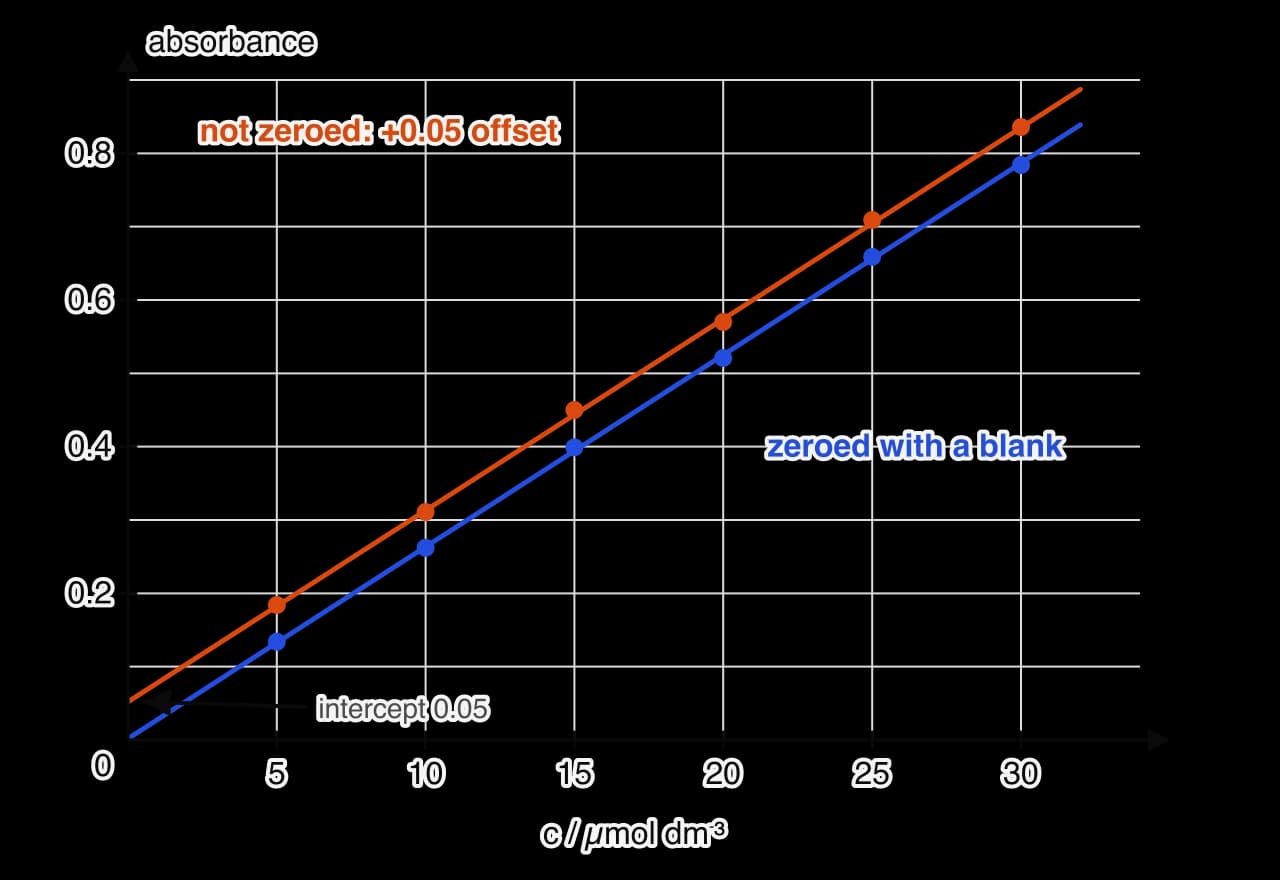
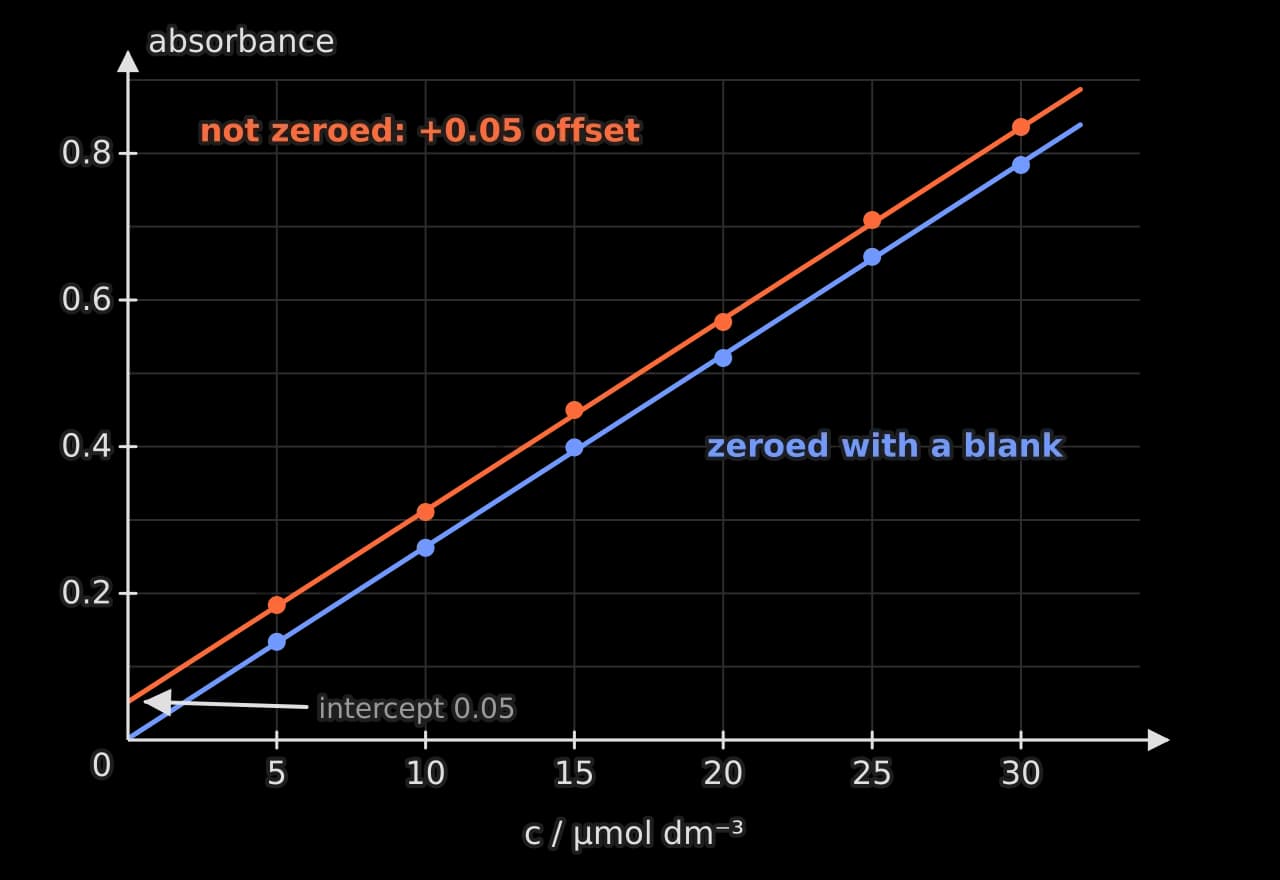
In the colorimeter example, every standard is too high, so the line is parallel to the correct one but does not pass through the origin. The gradient, and so a concentration read from a calibration line drawn with the same offset, is unaffected; a concentration calculated from a single standard and the assumption that absorbance is proportional to concentration would be wrong. Whether a systematic error matters depends on how the data are used, and explaining that is exactly what "relative impact" means.
Explaining the relative impact
The top level of the Evaluation criterion asks for the relative impact of specific weaknesses to be explained. That means saying which weaknesses mattered most, in which direction they pushed the result, and roughly how much, ideally with numbers from the investigation. A chain of four links turns a stated weakness into an explained one.


For the zinc calorimetry result, the main weaknesses can be ranked by size. Heat lost to the air through the top and sides of the cup is the largest: the result is 8 % less negative than the literature value, against a 2.5 % uncertainty, and only heat loss pushes the result in that direction by that much. The heat absorbed by the cup is small: a polystyrene cup of about 2 g with a specific heat capacity near absorbs about , against for the solution, so it accounts for little over 1 %. The assumption that the solution has the density and specific heat capacity of water introduces errors of a similar small size. Heat loss therefore deserves most of the evaluation, and the improvement that addresses it most directly is the one to explain in most detail.
Weak and strong evaluation points
Generic (1–2) | Specific and described (3–4) | Impact explained (5–6) |
|---|---|---|
"Heat was lost." | "Heat was lost to the surroundings through the open top of the cup." | "Heat lost through the open top of the cup made the temperature rise too small, so is less negative than the literature value; the 8 % error, three times the uncertainty, shows this was the largest effect." |
"More repeats would improve reliability." | "Only three runs were made at each concentration, and the scatter at was large." | "The scatter at (, 7 %) came from the ribbon floating; more repeats would narrow the mean, but stopping the ribbon floating would remove the cause." |
"The equipment was not precise." | "The gas syringe could only be read to ." | "The syringe uncertainty () is small next to the run-to-run spread of the initial rates, so a more precise syringe would barely change the result." |
Realistic improvements
An improvement is realistic if a student could carry it out in a school laboratory, and relevant if it addresses a weakness identified in the evaluation. At the top level it is explained: the report says how the change reduces the effect of that weakness on the result.
Heat loss in calorimetry: a lid with a hole only for the probe, a second cup nested around the first, and a temperature probe logging every second so the cooling line is defined by many points. These reduce the rate of heat loss and make the extrapolation more reliable, moving towards the literature value.
Gas lost before the bung is fitted: suspend the magnesium ribbon above the acid on a thread trapped by the bung, or in a small tube inside the flask, then tip the flask to start the reaction with the system already sealed. This removes the delay entirely, rather than just shortening it.
Floating ribbon: hold the ribbon under the surface with a small loop of plastic-coated wire or a plastic mesh, which does not react with the acid. Contact with a bare less reactive metal such as copper would be a poor choice, because it forms a small voltaic cell with the magnesium and speeds up the reaction.
Tangents drawn by eye: replace the syringe with a pressure sensor and data logger, which records hundreds of points in the first seconds, and calculate the initial gradient from a curve fitted in a spreadsheet.
Limitations and assumptions
Limitations concern how far the conclusion reaches rather than how well the data were measured. They include the range of the data (proportionality shown only between 0.25 and ; nothing can be said about concentrated acid), the confines of the system (one batch of magnesium ribbon, one temperature; the result may not apply to magnesium powder or other metals) and the assumptions made in processing.
Chemistry calculations rest on several common assumptions, each worth checking against the data. In calorimetry: the solution has the density and specific heat capacity of water; all the heat goes into the solution; the reaction goes to completion; the cooling rate is constant. In gas collection: the gas behaves ideally; none dissolves in the solution. In titration: the end point coincides with the equivalence point. When an assumption is unlikely to hold, its effect on the result is explained in the same way as a weakness.
Strengths deserve a sentence or two as well: a wide range, a precise instrument, good agreement between repeats, or a control that worked well. Naming them shows that the evaluation weighed the method as a whole, which is what "evaluate" means.
A complete evaluation, weak and strong
The two versions of an evaluation of the zinc and copper(II) sulfate investigation use the same observations. The difference lies in how far each point is taken.
Weak version (about 1–2)
"There were some errors in the experiment. Heat was lost to the surroundings, and the thermometer may have been misread. There could also have been human error when weighing the zinc. To improve the experiment, a better calorimeter should be used and more repeats should be done to make the results more reliable."
Every point is generic or vague, none says how the result was affected, and the improvements are stated without a link to a particular weakness.
Strong version (about 5–6)
"The main weakness was heat loss from the cup to the surroundings, mostly through the open top. It made every temperature rise too small and so every too small in magnitude. Its size can be judged from the result: differs from the literature value of by 8 %, three times the percentage uncertainty, and no other weakness acts in this direction by this much. Extrapolating the cooling line corrected part of the loss (it raised from 9.15 to 9.6 K), but assumes the rate of cooling during the reaction equalled the rate afterwards; since the mixture was hottest just after mixing, the true loss was probably larger. A lid with a single hole for the probe and a second cup around the first would reduce heat loss, and logging the temperature every second would define the cooling line more precisely."
"Two other weaknesses were minor. The cup itself absorbs about against for the solution, about 1 % of the heat, so including it in the calculation would change by only about . Zinc powder sometimes floated on the surface for the first few seconds, slowing the reaction and lowering the peak; continuous stirring with a magnetic stirrer would keep the powder suspended."
"The conclusion is limited to dilute copper(II) sulfate (up to ) at room temperature, and relies on assuming that the solution has the density and specific heat capacity of water, which for a dilute solution introduces an error of under 2 %. A strength of the method was the agreement between repeats ( K)."
The strong version ranks the weaknesses, uses numbers from the investigation to judge their size and direction, explains each improvement through the weakness it reduces, and separates limitations (range, assumptions) from weaknesses.
Applying the ideas
Error or uncertainty?
Judging a graph
An improvement that matches a weakness
A limitation
Self-check
- To do:
I can write a conclusion that answers the research question with processed values and their uncertainties.
- To do:
I can use error bars and uncertainty ranges to decide whether a relationship or a difference is shown by the data.
- To do:
I can compare a result with a cited literature value or with theory.
- To do:
I can calculate a percentage error and compare it with the percentage uncertainty to detect systematic error.
- To do:
I can distinguish random from systematic errors and give chemical examples of each.
- To do:
I can explain the relative impact of specific weaknesses, including their direction and size.
- To do:
I can suggest realistic improvements and explain how each reduces a particular weakness.
- To do:
I can identify limitations from the range of the data, the system studied and the assumptions made.
Carry on with Chemistry in Augment
With a free account, Augment remembers where you stopped in the notes and which questions you have marked.