A complete investigation, start to finish
One chemistry investigation followed from first idea to evaluation: how chain length affects the enthalpy of combustion of alcohols, with the design, data, uncertainties, graph, conclusion and evaluation.
- IB Chemistry
- Internal assessment
- SL and HL
A complete investigation shows how the four criteria fit together in practice. The example follows one student’s investigation of how the enthalpy of combustion of straight-chain primary alcohols depends on the number of carbon atoms, from the first idea to the evaluation. At each stage, the decisions are explained in the way a top-level report would explain them.
The investigation is deliberately simple in apparatus and rich in analysis. Spirit-burner calorimetry is cheap and familiar, but it has large systematic errors, so it tests whether the student can still extract a valid conclusion and evaluate the method honestly. The comparison with bond enthalpies and with literature values gives a strong scientific context.
From an idea to a research question
The student started from the observation that fuels with longer molecules release more energy per mole, and wanted to know whether the increase is regular. Alcohols suit a school laboratory: methanol, ethanol, propan-1-ol, butan-1-ol and pentan-1-ol are liquids that burn cleanly in a spirit burner, and they form a homologous series in which each member differs from the next by one group. The number of carbon atoms is a discrete variable with five values, enough for a graph.
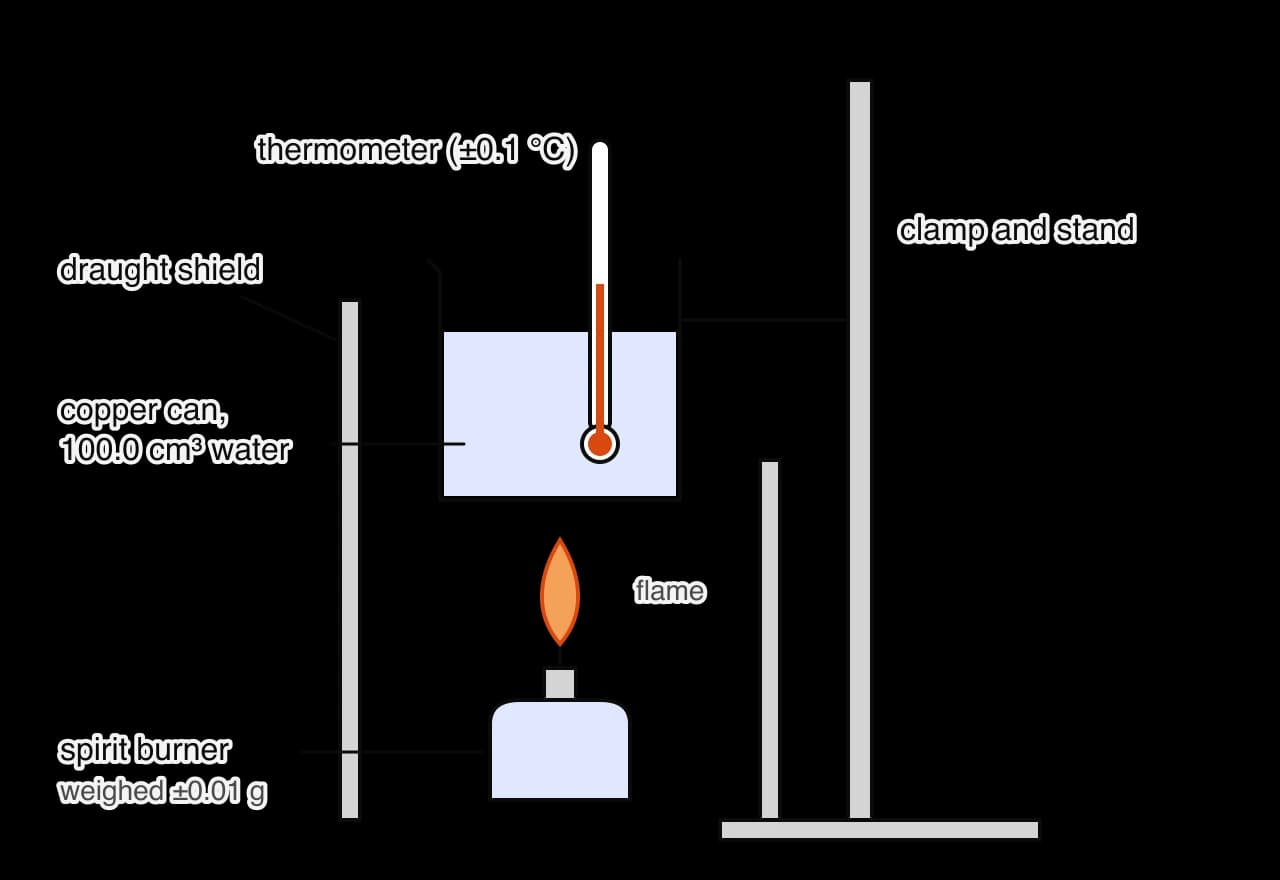
Research question: "How does the number of carbon atoms in a straight-chain primary alcohol (methanol to pentan-1-ol) affect its enthalpy of combustion, determined from the temperature rise of of water in a copper can heated by a spirit burner, and how does the increase per group compare with values from average bond enthalpies and the literature?"
What the pilot showed
A pilot run with ethanol heated the water by about 30 K before the flame was put out. The thermometer read to °C, so even a 20 K rise gives a percentage uncertainty of only 1 %, while the mass of alcohol burned, about g on a balance reading to g, gives a percentage uncertainty near 4 % for the difference of two readings. Heating for longer would burn more alcohol and reduce that uncertainty, but would also warm the water further above room temperature and increase heat loss. The student settled on a temperature rise of about 20 K, starting from room temperature, as a compromise.
The pilot also showed that the flame flickered whenever someone walked past, and that soot formed on the base of the can. The first led to draught shields; the second was recorded as an observation to discuss in the evaluation.
Background theory and prediction
Each alcohol burns completely in excess oxygen to carbon dioxide and water. For ethanol:
Moving from one alcohol to the next adds a group, which needs more and produces one more and one more . Average bond enthalpies (data booklet) predict the extra energy released per group, for gaseous reactants and products:
Prediction: the enthalpy of combustion becomes more negative by a constant amount for each group, so a graph of against the number of carbon atoms is a straight line with a gradient of about . The literature values give a gradient of ; the difference arises because the literature values refer to liquid alcohols and liquid water, so condensing the extra mole of water releases about more, partly offset by the slightly larger energy needed to vaporize the longer alcohol. Heat losses in the experiment are expected to make every measured value much less negative than the literature value, but if the fraction of heat lost is similar for every alcohol, the line should still be straight.
Variables and method
Variable | Type | How it was set, measured or controlled, and why |
|---|---|---|
Number of carbon atoms (1 to 5) | Independent | Five alcohols from one supplier, each in its own labelled spirit burner |
Temperature rise of the water | Dependent (measured) | Digital thermometer, °C; stirred before each reading; heated by about 20 K |
Mass of alcohol burned | Dependent (measured) | Burner with cap weighed before and after on a balance reading to g |
Volume of water | Control | from a measuring cylinder (); sets the mass heated |
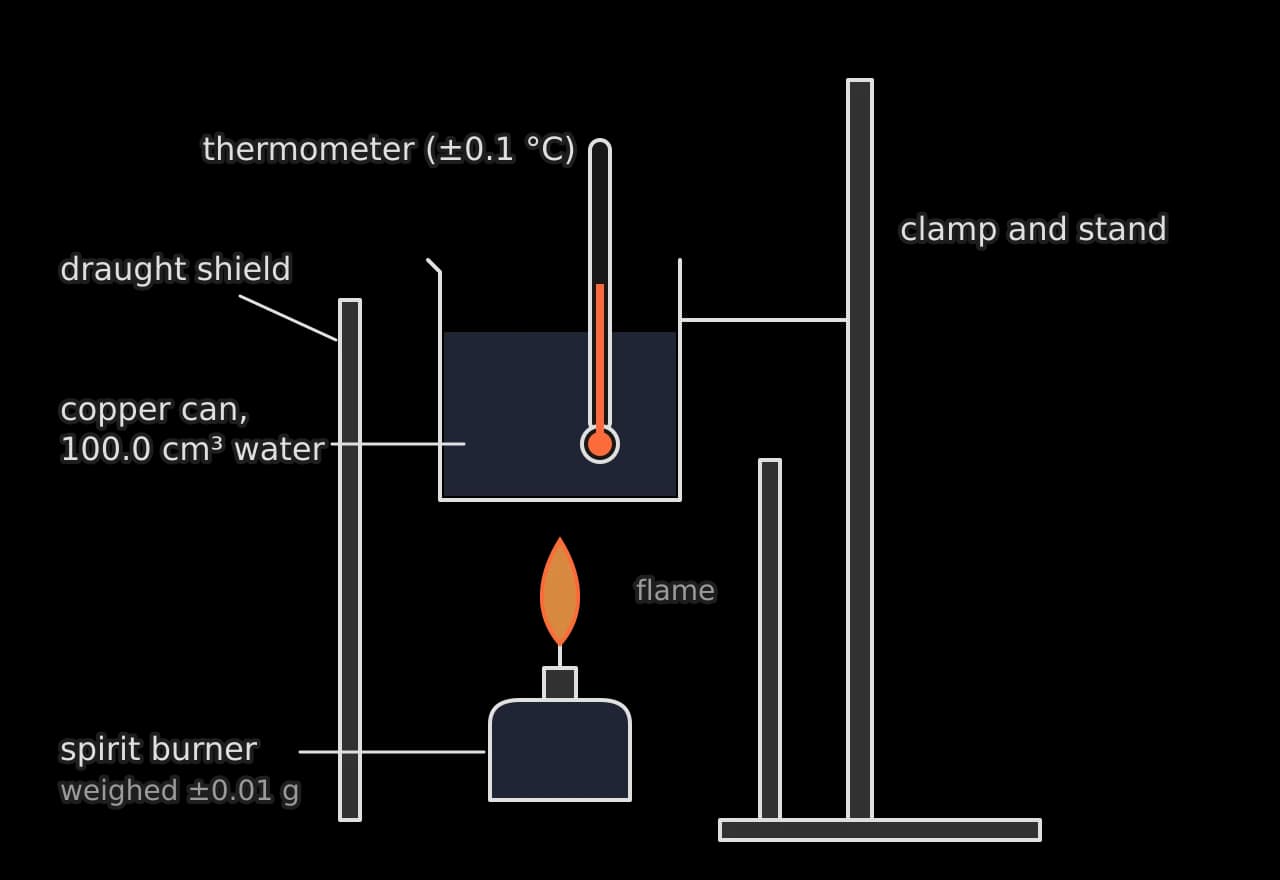
Distance from wick to can | Control | cm, set with a ruler, because the fraction of heat reaching the can depends strongly on it |
Wick length | Control | Trimmed to 5 mm above the holder, so flame size is similar |
Same copper can | Control | Its heat capacity and soot layer affect heat transfer; wiped clean between runs |
Draughts | Control | Draught shields on two sides; windows and doors closed |
Starting temperature | Monitored | Fresh water at room temperature (20.3–20.6 °C) for each run |
Procedure
Measure of water into the copper can and clamp the can so its base is cm above the wick.
Weigh the spirit burner with its cap on; record the mass to g.
Stir the water and record its starting temperature.
Remove the cap, light the wick, and stir the water gently and continuously with the thermometer.
When the temperature has risen by about 20 K, replace the cap to put out the flame, keep stirring, and record the highest temperature reached.
Reweigh the burner with its cap on immediately.
Empty the can, wipe off any soot, refill with fresh water and repeat. Carry out three runs for each alcohol, in a random order of alcohols.
Weighing the burner with its cap on, both times, prevents alcohol evaporating from the wick during weighing, which would add to the apparent mass burned. Randomizing the order of alcohols prevents a gradual change, such as soot building up on the can, from being mistaken for a trend with chain length.
Hazard | Precaution |
|---|---|
Alcohols are highly flammable | Only one burner lit at a time; bottles kept capped and away from the flame; burners refilled by the teacher |
Methanol is toxic by ingestion, inhalation and skin contact | Gloves; good ventilation; methanol burner kept capped when not in use |
Hot copper can and clamp | Left to cool before handling |
Disposal | Unused alcohol returned to labelled bottles; no alcohol poured down the sink |
Raw data
Run | Mass of burner before / g (±0.01) | Mass of burner after / g (±0.01) | Starting temperature / °C (±0.1) | Highest temperature / °C (±0.1) |
|---|---|---|---|---|
1 | 152.36 | 151.81 | 20.5 | 40.4 |
2 | 151.81 | 151.24 | 20.6 | 41.6 |
3 | 151.24 | 150.70 | 20.4 | 39.9 |
Sample raw data for ethanol; the other four alcohols were recorded in the same way. Volume of water in every run.
Qualitative observations. The flames of methanol and ethanol were pale blue and almost invisible in daylight; propan-1-ol, butan-1-ol and pentan-1-ol burned with increasingly yellow flames, and a black deposit of soot formed on the base of the can, heaviest for pentan-1-ol. Condensation appeared on the outside of the cold can in the first few seconds of each run. The water continued to rise by about °C after the flame was put out.
The observations matter later. A yellow, sooty flame is evidence of incomplete combustion, which releases less energy than complete combustion and would make the longer-chain results too small in magnitude. Condensation shows that water vapour from the flame was transferring heat to the can, which is part of the measured heating.
Processing
Enthalpy of combustion for one run, with its uncertainty
For ethanol, run 1: mass burned g, and temperature rise K. Taking the density of water as , the mass of water is g.
Uncertainty. The mass burned is a difference of two readings, g, which is of g. The temperature rise is also a difference, K, or . The volume of water contributes . These add (a product and a quotient) to , so for this run .
The three ethanol runs gave , and : a mean of and a half-range of . The propagated instrument uncertainty () is larger than the spread of the repeats, so the larger value is quoted. The mass reading dominates it: burning more alcohol per run would improve the precision most.
Alcohol | n | Mean mass burned / g | Mean / K | Experimental / | Literature / | Experimental as % of literature |
|---|---|---|---|---|---|---|
methanol | 1 | 0.73 | 19.7 | −726 | 50 % | |
ethanol | 2 | 0.55 | 20.1 | −1367 | 51 % | |
propan-1-ol | 3 | 0.49 | 20.1 | −2021 | 51 % | |
butan-1-ol | 4 | 0.47 | 20.1 | −2676 | 50 % | |
pentan-1-ol | 5 | 0.45 | 19.8 | −3331 | 49 % |
Processed data (sample). Uncertainties are the propagated instrument uncertainties, which exceeded the half-range of the repeats for every alcohol; values are rounded to the precision of their uncertainty. Literature values: IB Chemistry data booklet (2025) for methanol to butan-1-ol; NIST Chemistry WebBook for pentan-1-ol (Mosselman and Dekker, 1975).
The graph and its gradient
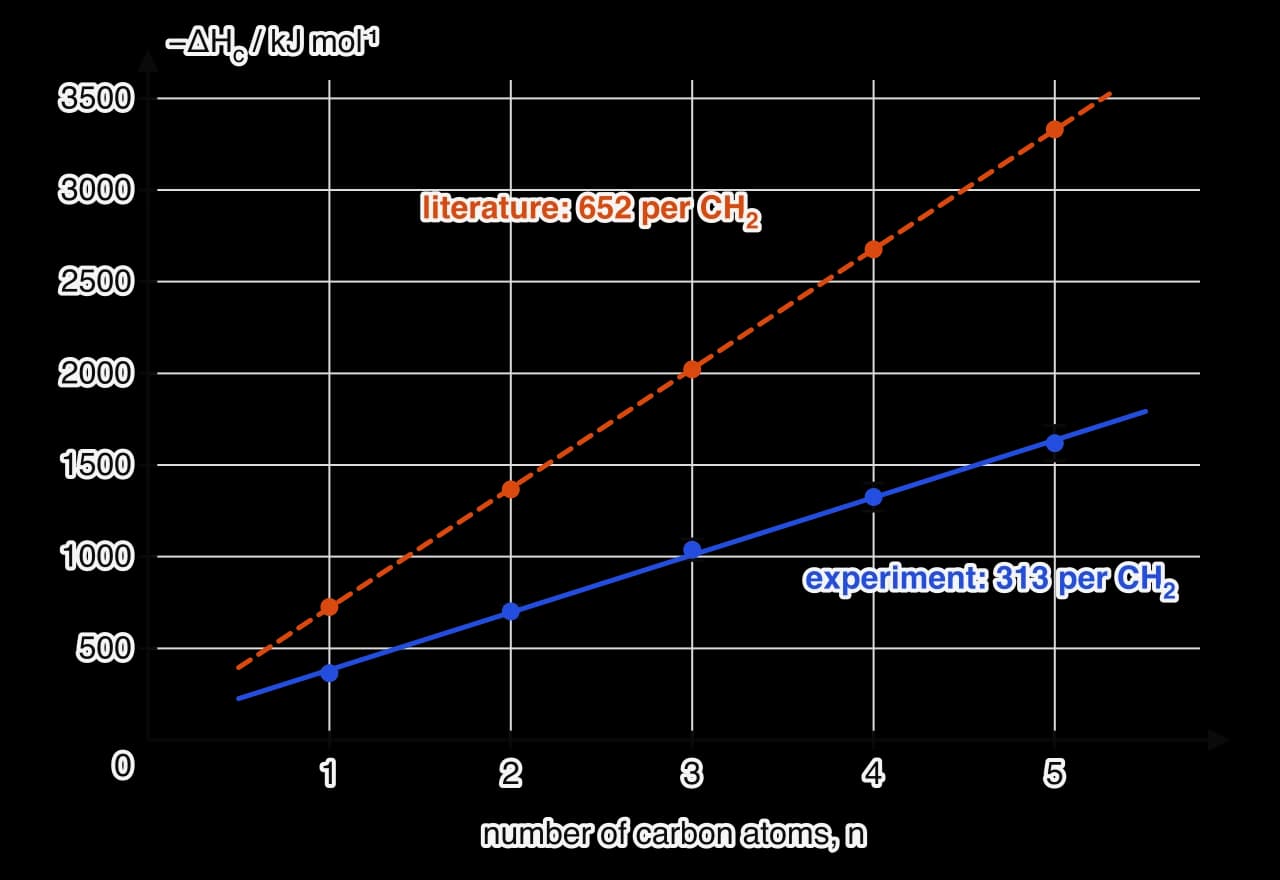
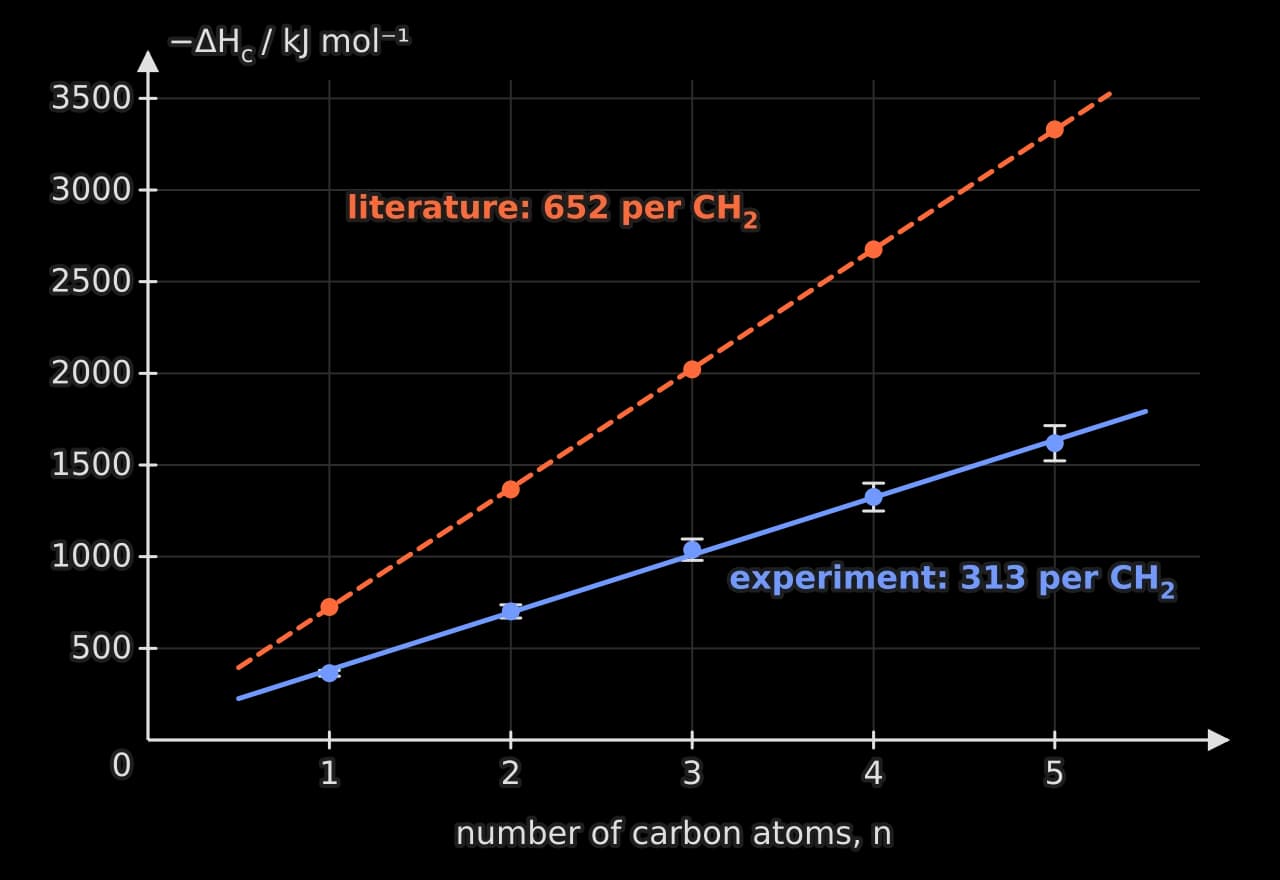
The five experimental values lie on a straight line within their error bars (). On the graph of against , the best-fit gradient is per carbon atom, and the steepest and shallowest lines that pass through every error bar have gradients of and . The gradient is therefore : each additional group makes more negative by (rounded to the precision of the uncertainty), a percentage uncertainty of about 7 %. The literature values give an increase of per ().
Conclusion
Over the range methanol to pentan-1-ol, the enthalpy of combustion of straight-chain primary alcohols becomes more negative by a constant amount for each additional carbon atom: the graph of experimental against the number of carbon atoms is a straight line, with every point within its uncertainty of the line (). This supports the prediction from bond enthalpies that each group adds the same set of bonds broken and formed, and so the same energy released.
The measured increase, per , is less than half of the literature value of (data booklet; NIST) and of the bond-enthalpy estimate of . The percentage error, , is far larger than the 7 % uncertainty, so random error cannot explain the difference: a large systematic error made every value too small in magnitude by a similar factor. The constant ratio of about 50 % between experimental and literature values across all five alcohols shows that the fraction of heat transferred to the water was similar for each, which is why the relationship is still linear and the conclusion about its form is valid, while the absolute values are not.
The bond-enthalpy estimate itself differs from the literature gradient by 6 %, mainly because average bond enthalpies apply to gases, while the literature values refer to liquid alcohols and liquid water. This agreement supports the model of combustion as the breaking and forming of a fixed set of bonds for each group.
Evaluation
Strengths
The repeats agreed closely (half-ranges of to , all smaller than the propagated uncertainties), so random error was small. Randomizing the order of the alcohols and cleaning the can between runs meant that soot build-up could not create a false trend. The five alcohols cover a wide range of carbon numbers, and the linear trend holds across all of them.
Weaknesses and limitations, in order of impact
Heat loss from the flame and the can. By far the largest effect: about half the energy released never reached the water. Hot combustion gases flowed up around the sides of the can, and the can radiated and conducted heat to the air and the clamp. This made every too small in magnitude by about 50 %, more than seven times the 7 % uncertainty. Because the fraction lost was similar for every alcohol (49–51 %), it scaled the values without changing the form of the relationship, but it halved the measured gradient.
Incomplete combustion of the longer alcohols. The yellow flames and soot for propan-1-ol to pentan-1-ol show that some carbon was released as soot or carbon monoxide, which releases less energy than conversion to carbon dioxide. This would make the longer alcohols’ values too small in magnitude, increasingly so with chain length, which would flatten the line slightly. The small fall in the percentage of the literature value, from 51 % for ethanol and propan-1-ol to 49 % for pentan-1-ol, is consistent with this, although it is within the uncertainties.
Heat absorbed by the copper can and the thermometer. The can (about 60 g of copper, ) has a heat capacity of about , compared with for the water. Ignoring it makes each value about 5 % too small in magnitude, a real but much smaller effect than heat loss.
Precision of the mass burned. At g on about g, this contributed most of the 5 % uncertainty in each value. It limits the precision but does not explain the difference from the literature values.
Limitations. The conclusion applies to straight-chain primary alcohols from to ; branched alcohols, or much longer chains where incomplete combustion becomes severe, were not tested. The calculation assumed that all the heat entered the water, that combustion was complete and that the water’s specific heat capacity applied; only the last of these is a good assumption.
Realistic improvements
Reduce heat loss: fit a heat-resistant collar (for example, a ring of ceramic fibre board) around the flame and the base of the can so that the hot gases are channelled past the can, and put a lid on the can. This targets the largest weakness directly and would raise the fraction of heat transferred.
Calibrate the apparatus: burn one alcohol with a known enthalpy of combustion (for example ethanol, ) under identical conditions to find the fraction of heat reaching the water, then correct the other results by that factor. This turns the systematic error into a measured quantity, and tests whether the fraction really is the same for each alcohol.
Reduce incomplete combustion: lower the wick so that the flame is smaller and gets more air, and raise the can slightly; a cleaner, bluer flame burns more completely.
Improve precision: heat the water by about 30 K so that more alcohol burns, or use a balance reading to g, halving or better the largest uncertainty; include the heat capacity of the can in the calculation.
How the investigation meets the criteria
Criterion | Evidence in the report |
|---|---|
Research design | A focused question naming both variables, the range and the system; background theory with equations and a bond-enthalpy prediction; pilot results used to choose the temperature rise; controls explained with reasons; a reproducible numbered method; hazards, precautions and disposal |
Data analysis | Raw data with units, uncertainties and consistent decimal places; qualitative observations; a full sample calculation with propagated uncertainty; comparison of instrument uncertainty with the spread of repeats; a graph with error bars, best-fit line and a gradient with uncertainty from the steepest and shallowest lines |
Conclusion | A direct answer to the question with the gradient and its uncertainty; the form of the relationship justified by the graph; comparison with cited literature values and with the bond-enthalpy prediction; percentage error compared with percentage uncertainty to identify systematic error |
Evaluation | Strengths; weaknesses ranked by size and direction, using numbers from the data and the qualitative observations; limitations of range and assumptions; realistic improvements, each linked to the weakness it reduces |
Applying the ideas
Checking a processed value
Using the calibration idea
Self-check
- To do:
I can turn an idea into a research question with a range, a measurement method and a system.
- To do:
I can use a pilot run to choose quantities that balance precision against systematic error.
- To do:
I can write background theory that leads to a quantitative prediction, such as one from average bond enthalpies.
- To do:
I can present a variables table, a reproducible method and a risk assessment for a calorimetry investigation.
- To do:
I can process combustion data into an enthalpy change with a propagated uncertainty.
- To do:
I can find a gradient with its uncertainty and compare it with a literature value.
- To do:
I can explain why a relationship can be valid even when the absolute values carry a large systematic error.
- To do:
I can rank weaknesses by their size and direction and propose realistic improvements, including calibration.
- To do:
I can map each part of a report to the criterion it addresses.
Carry on with Chemistry in Augment
With a free account, Augment remembers where you stopped in the notes and which questions you have marked.