Paper 1B: data-based questions
How to answer Paper 1B questions on experimental work: uncertainties and their propagation, graphs, percentage error, random and systematic errors, evaluation and improvements, with a complete worked question.
- IB Chemistry
- Exam skills
- SL and HL
Paper 1B is the second booklet of Paper 1. It contains a few questions, each built around one experiment, often an investigation of a real-world sample: iron in a food, a vitamin in a vegetable, the rate of a reaction at several temperatures. A short stem describes the purpose and the method, then a table of data or a graph follows, and the parts step through the skills of practical chemistry. Each part is small, usually 1 or 2 marks.
The questions test the same skills as the internal assessment: reading data with their uncertainties, processing them, drawing and reading graphs, and judging how far a result can be trusted. The chemistry needed is usually simple; what earns the marks is precision about measurement, error and method.
Reading the experiment and its data
Read the stem twice: once for the chemistry (the reaction, the equation, what is measured) and once for the method (the apparatus, the amounts, what is kept constant). Then look at the table headings. In IB data tables, each column heading gives the quantity, its unit and its uncertainty, such as "Volume of NaOH added / cm³ ± 0.05" or "Temperature / °C ± 0.1". The values in the column are recorded to the precision of the instrument, so every value in a column has the same number of decimal places.
Most experiments change one independent variable, measure one dependent variable and keep every other factor that could affect the result constant as control variables. Questions often ask for these by name, and the commonest lost mark is naming a processed quantity as the dependent variable. In a titration the measured dependent variable is the titre, not the concentration calculated from it; in a rate experiment it is the time taken, not the rate.
Uncertainty in a measurement
For a digital instrument such as a balance or a temperature probe, the uncertainty is usually taken as the smallest division of the display: for a balance reading to two decimal places. For an analogue scale such as a burette or a thermometer, it is usually half the smallest division: a burette marked every is read to . Volumetric glassware carries a manufacturer's tolerance printed on it, such as for a pipette, and questions give this value when it is needed.
Many quantities are the difference of two readings: a titre (final minus initial burette reading), a temperature change (final minus initial temperature) or a mass lost (before minus after). Each reading has its own uncertainty, so the difference carries both: a titre found from two burette readings of each is uncertain by .
Propagating uncertainties
When measured values are combined in a calculation, their uncertainties combine too, a process called propagation of uncertainties. The rules are printed in the data booklet:
Adding or subtracting: add the absolute uncertainties. If , then .
Multiplying or dividing: add the fractional or percentage uncertainties. If , then .
Raising to a power (HL): multiply the fractional uncertainty by the power. If , then .
Pure numbers, such as the 1000 that converts to , the coefficients in an equation and constants from the data booklet, add no uncertainty. The final absolute uncertainty is usually given to one significant figure, and the value is then rounded to the same decimal place as its uncertainty.
Graphs in data questions
Most Paper 1B questions include a graph, either given or to be completed. Three graph skills appear again and again in chemistry: extrapolating a line back to a moment when no reading could be taken, drawing a tangent to find a rate, and reading a concentration from a calibration line.
Extrapolating a temperature–time graph
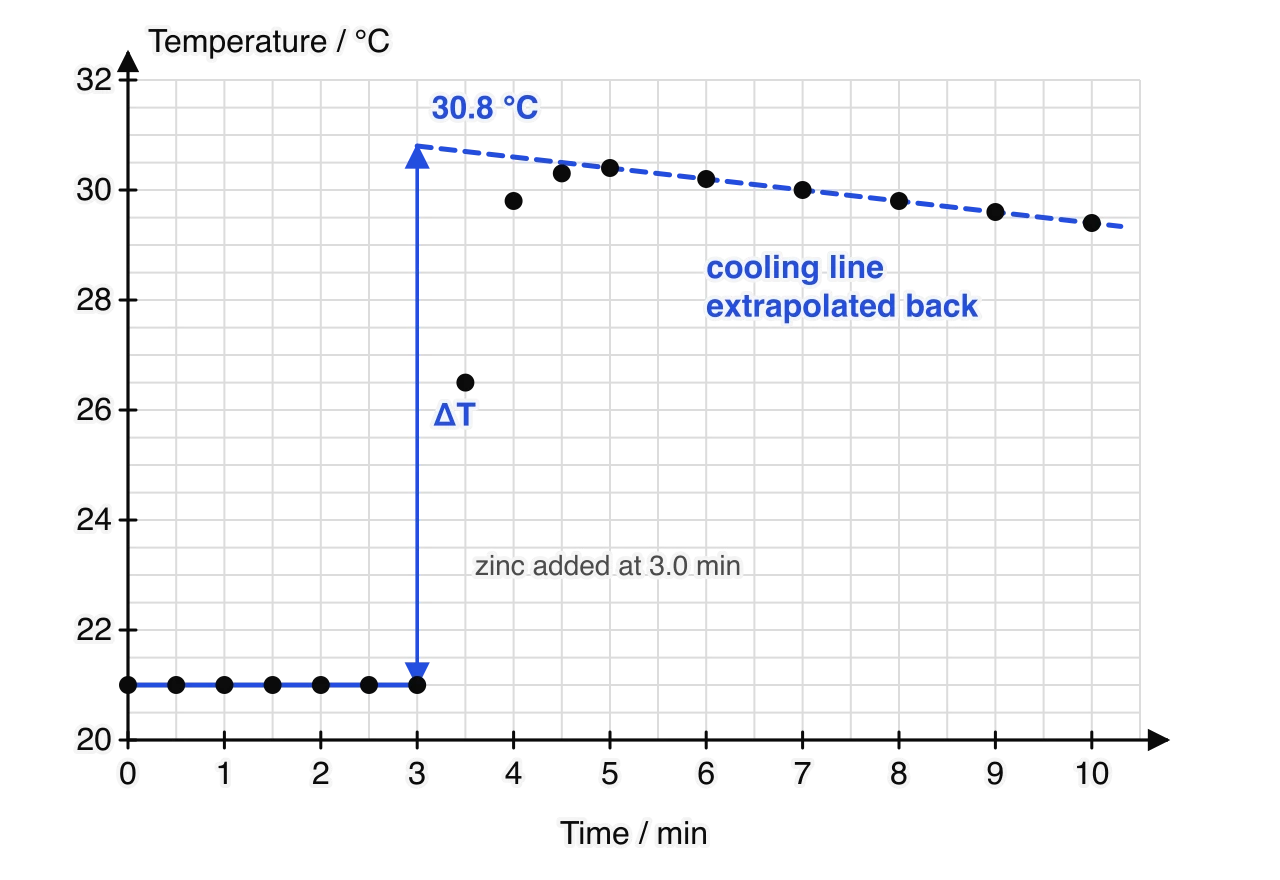
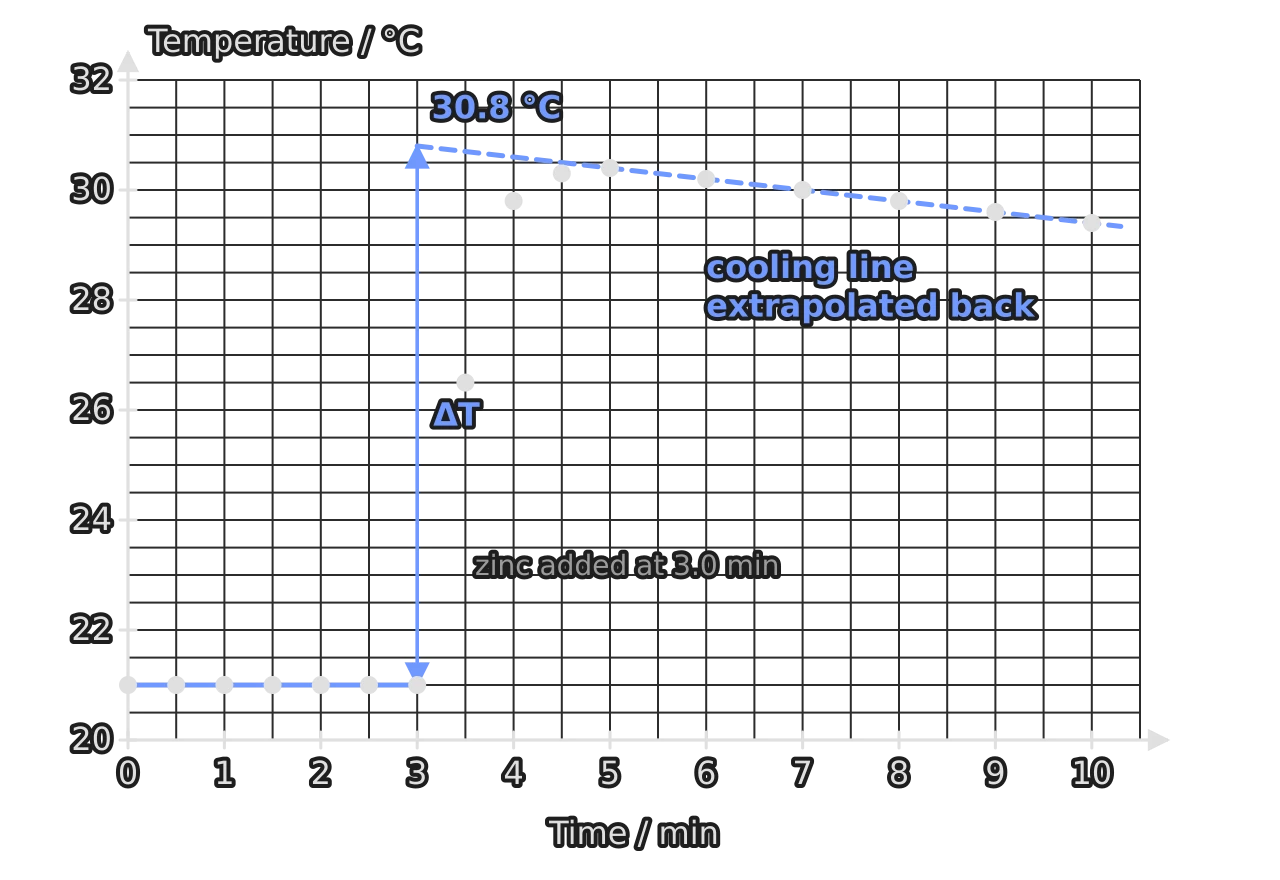
In solution calorimetry, the reacting mixture loses heat to the surroundings while the reaction is still happening, so the highest temperature recorded is lower than the temperature that would have been reached with no heat loss. To correct for this, the temperature is recorded for a few minutes before mixing and for several minutes after the maximum. The cooling line is then extrapolated back to the time of mixing, and the temperature change is read at that time. This extrapolation assumes that heat was lost at the same rate during the reaction as during the cooling.
Tangents and initial rates
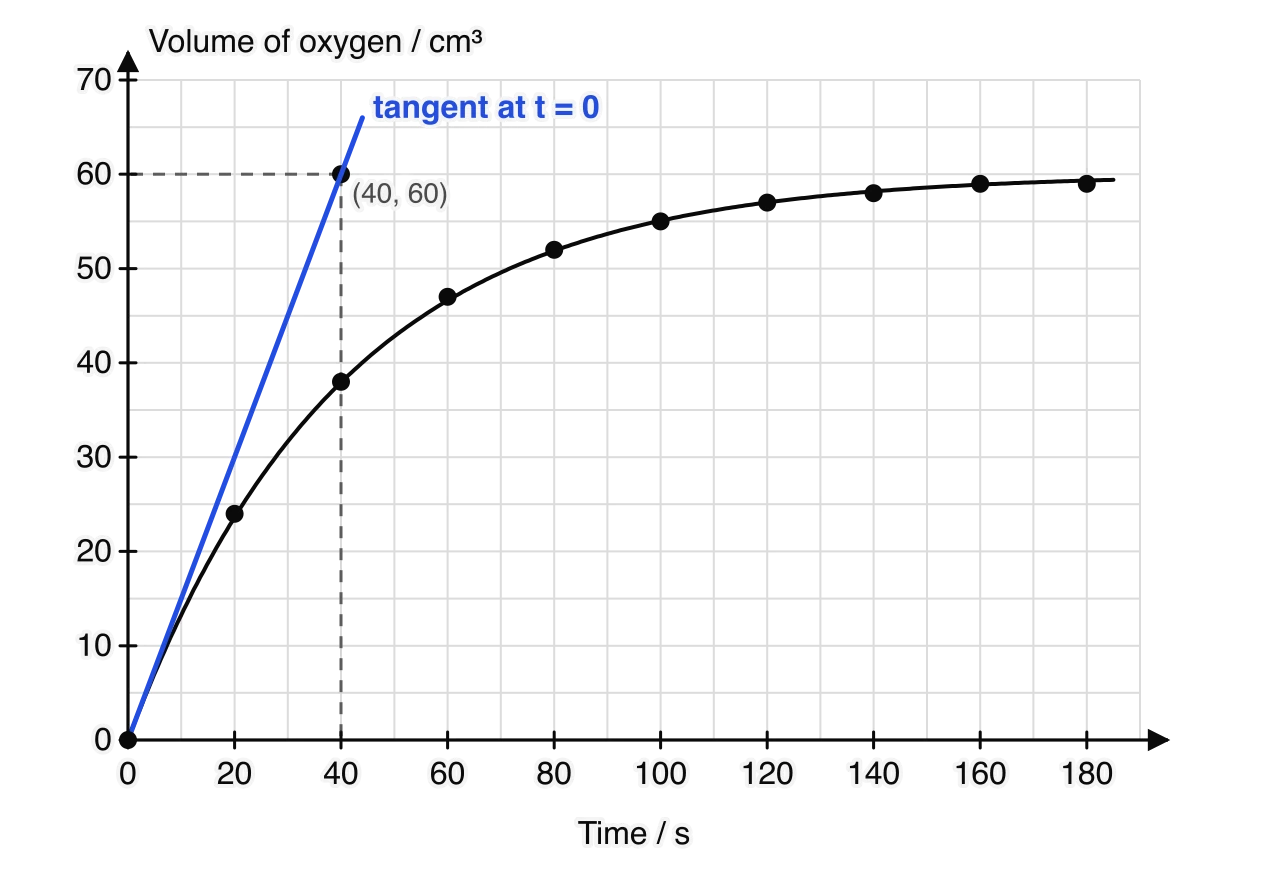
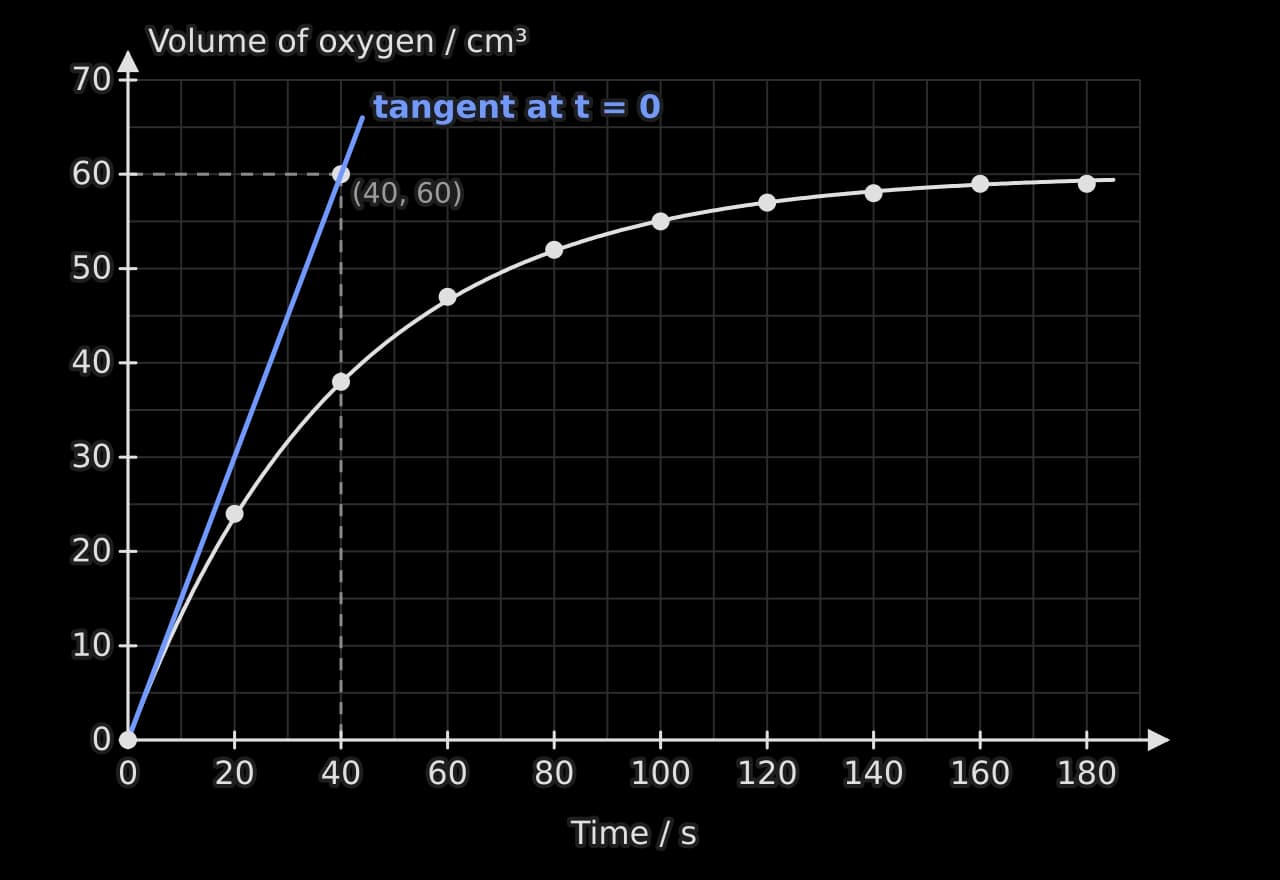
On a graph of the amount of product (or of reactant) against time, the rate at any instant is the gradient of the tangent to the curve at that time. The initial rate is the gradient of the tangent at . Draw the tangent with a ruler so that it touches the curve at that point without cutting it, extend it as far as possible, and calculate its gradient from two points on the tangent that are far apart. The unit of the rate is the unit of the vertical axis divided by the unit of the horizontal axis.
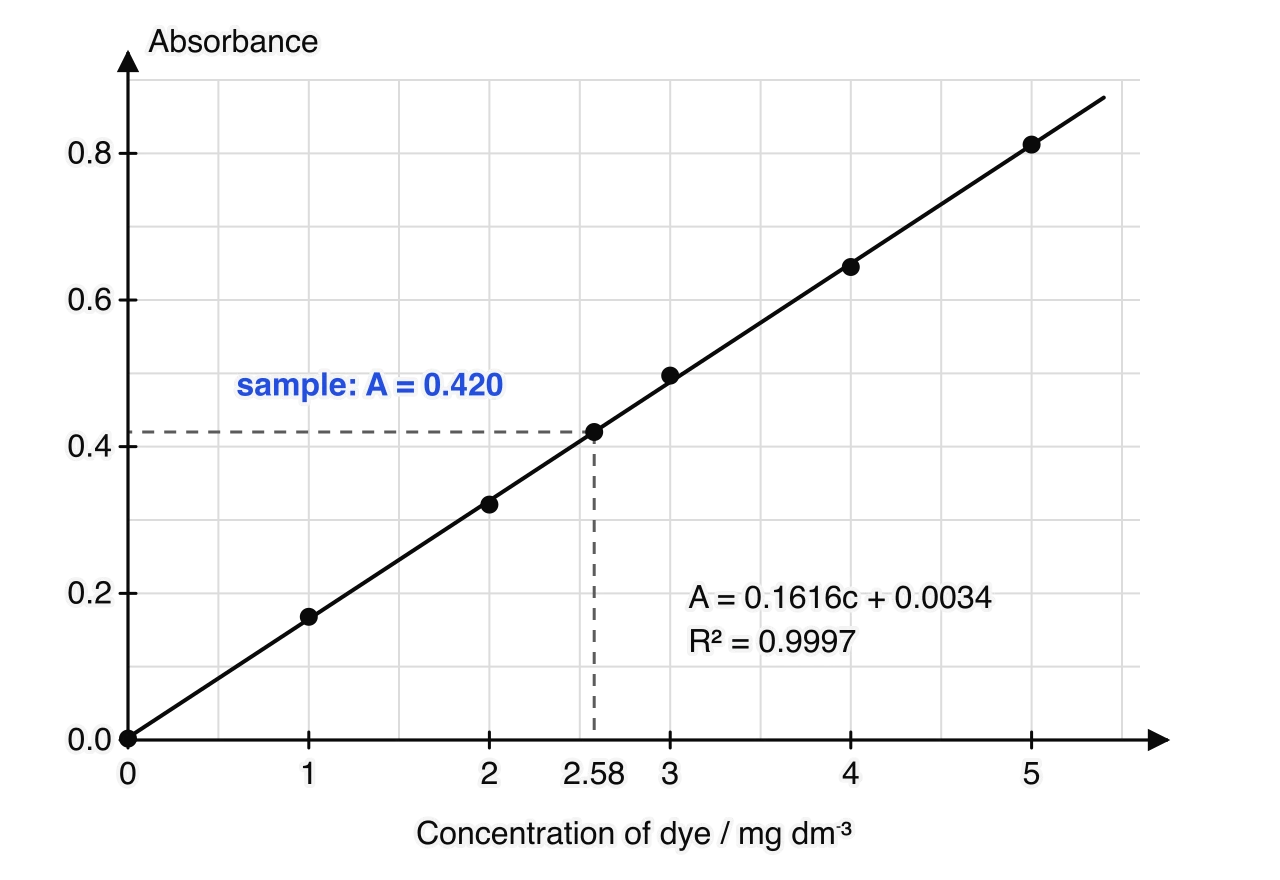
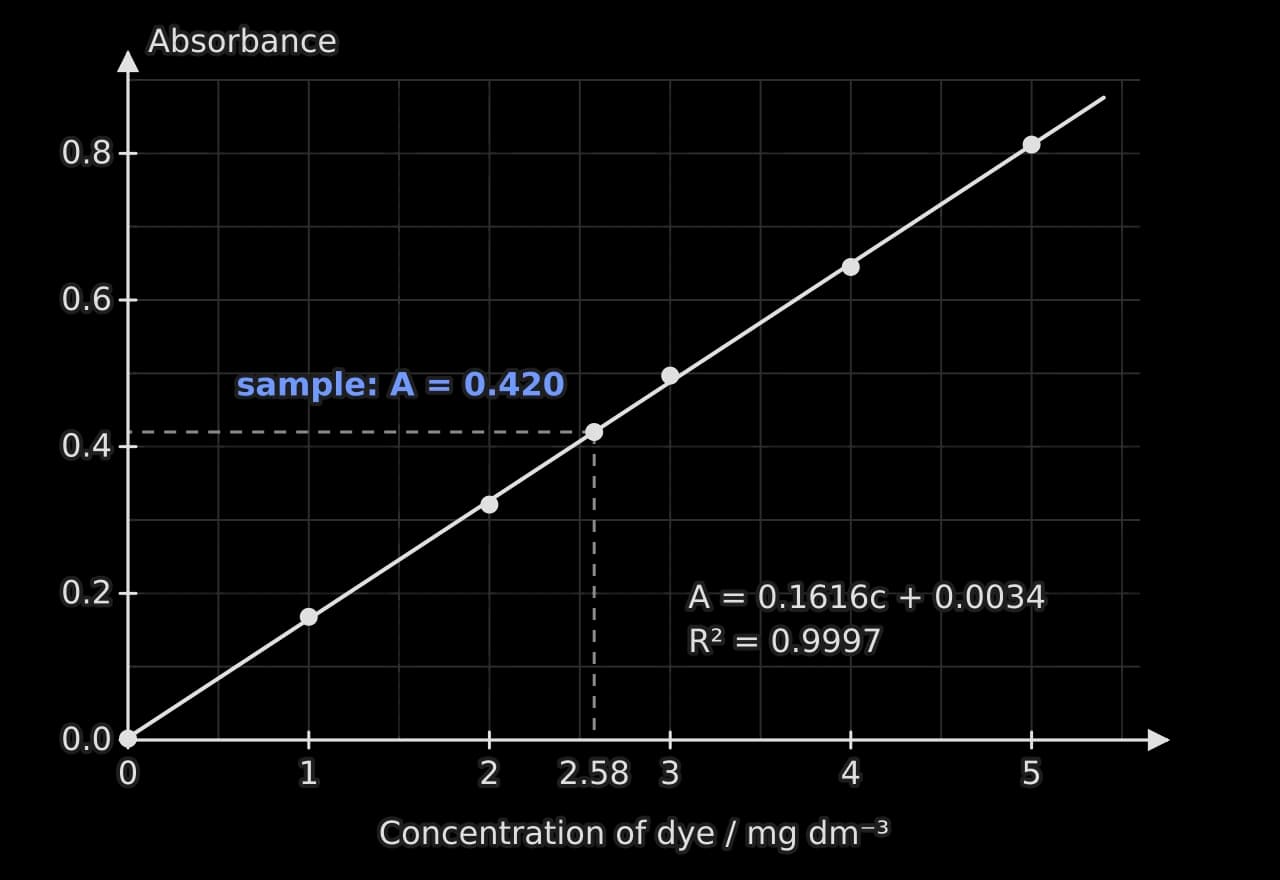
Calibration lines and R²
In colorimetry, the absorbance of a coloured solution is measured at a wavelength that it absorbs strongly, which is the colour complementary to the one it appears (the colour wheel in the data booklet shows the pairs). A blue solution absorbs orange light, so an orange filter, or a wavelength of about 600–640 nm, gives the most sensitive readings. The instrument is first zeroed with a blank: a cuvette of the solvent with everything except the coloured substance.
A set of standard solutions of known concentration is measured, and absorbance is plotted against concentration to give a calibration curve. The concentration of an unknown is then found by reading across from its absorbance, which is interpolation, or by substituting into the equation of the best-fit line. The calculation from the equation uses all the standards and avoids the error of reading a graph by eye.
Percentage error and percentage uncertainty
The two percentages answer different questions. Percentage uncertainty comes from the precision of the apparatus and says how much the result could vary from random effects alone. Percentage error says how far the result actually is from the accepted value. Comparing them is one of the most useful judgements in a data question: if the percentage error is larger than the total percentage uncertainty, random uncertainty cannot explain the difference, and a systematic error must be present.
Random errors, systematic errors and their direction
A random error varies unpredictably from one measurement to the next: judging when a colour changes, reading a scale between divisions, small fluctuations in temperature. Random errors scatter the results on both sides of the true value and limit the precision of the results. Repeating the measurement and taking a mean reduces their effect.
A systematic error shifts every result in the same direction by a similar amount: heat lost to the surroundings in every calorimetry run, a standard solution whose concentration is lower than its label, a balance that reads too high. Systematic errors limit the accuracy of the results, and repeating the measurement does not reduce them, because every repeat is wrong in the same way.
Questions on systematic error almost always ask for a direction: will the error make the final result too high or too low? Work through the chain from the measured quantity to the result one step at a time.
Source of systematic error | Effect on the measurement | Effect on the result |
|---|---|---|
Heat lost to the surroundings in solution calorimetry | Temperature rise too small | less negative (its magnitude too small) |
Fuel evaporating from the wick of a spirit burner | Mass of fuel burned overestimated | Magnitude of too small |
Hydrated salt not heated to constant mass | Mass of water lost too small | Number of waters of crystallization too low |
Carbon dioxide collected over water partly dissolves | Volume of gas too small | Amount of gas, and the rate, too low |
Sodium hydroxide titrant absorbs carbon dioxide from the air, so its concentration is lower than stated | Titre too large | Calculated concentration of the acid too high |
Other reducing agents in a sample also react with the oxidizing titrant | Titre too large | Amount of the analyte overestimated |
Repeats, outliers and significant differences
Repeated trials show how precise a method is. In a titration, trials are repeated until two or more concordant titres agree within , and only those are averaged; the rough trial is never included. In other experiments, an outlier (an anomalous result) is a value that lies well outside the pattern of the others. It may be excluded from the mean, but only with a reason: the value is clearly inconsistent with the repeats, and ideally a cause specific to the method can be suggested.
Two results differ significantly only if the difference between them is larger than their combined uncertainty. If the ranges overlap, the data do not show a real difference. This test answers questions such as "Comment on whether the iron content changed between day 4 and day 5" or "Does the temperature affect the result?"
Evaluating and improving a method
Evaluation questions ask for weaknesses in the method, their effect on the result, and realistic improvements. Each improvement must address a named weakness, use apparatus available in a school laboratory, and say what it changes. A generic answer that could be written about any experiment earns nothing.
Weakness | Why it matters | Realistic improvement |
|---|---|---|
Heat lost from an open polystyrene cup | Temperature rise too small, so the enthalpy change is underestimated | Fit a lid and add insulation; extrapolate the cooling line back to the time of mixing |
End point judged by eye (a cross disappearing, a colour change) | The moment chosen varies between trials: a random error | Use a light sensor or colorimeter and record the time when the transmitted light falls to a fixed value |
Small titre, under about 10 cm³ | Large percentage uncertainty in the titre | Use a more dilute titrant or a larger volume of the analyte |
Gas escapes before the bung is inserted | Volume of gas collected is too small | Keep one reactant in a small tube inside the sealed flask and tip it over to start the reaction |
Only three values of the independent variable | Too few points to establish a trend | Use at least five values over a wider range |
A single trial at each value | Random errors are not reduced | Repeat each measurement at least three times and use the mean |
Calculations from experimental data rest on assumptions, and questions often ask for one. In calorimetry: the solution has the density () and specific heat capacity () of water, no heat is lost, and the cup absorbs no heat. In gas experiments: the gas behaves ideally and none dissolves or escapes. In titrations: the reaction goes to completion and nothing else in the sample reacts with the titrant.
Questions on safety, ethical and environmental issues need a specific hazard and a specific precaution: hydrochloric acid is corrosive, so eye protection is worn; sulfur dioxide is toxic, so the experiment is done in a fume cupboard; copper(II) sulfate solution is harmful to aquatic life, so it is collected for disposal rather than poured down the sink. "Be careful", "it is dangerous" and "wear a lab coat" alone score nothing.
A complete Paper 1B question
The worked question follows one experiment through the skills of the earlier sections. A student investigates the effect of temperature on the rate of the reaction between sodium thiosulfate and hydrochloric acid:
Equal volumes of the two solutions are warmed separately in a water bath to the chosen temperature, mixed in a conical flask standing on a paper marked with a cross, and timed until the precipitate of sulfur hides the cross. The results are recorded in a table.
Temperature / °C ± 0.5 | Time, trial 1 / s ± 1 | Time, trial 2 / s ± 1 | Time, trial 3 / s ± 1 | Mean time / s |
|---|---|---|---|---|
20.0 | 92 | 95 | 90 | 92 |
30.0 | 51 | 49 | 53 | 51 |
40.0 | 29 | 41 | 28 | |
50.0 | 17 | 18 | 16 | 17 |
Self-check
- To do:
I can identify the independent, dependent and control variables of an experiment, naming the measured dependent variable.
- To do:
I can state the uncertainty of a reading and double it for a difference of two readings.
- To do:
I can calculate percentage uncertainties and propagate them through sums, differences, products and quotients.
- To do:
I can extrapolate a temperature–time graph to find the temperature change at the time of mixing.
- To do:
I can draw a tangent and calculate an initial rate with its units.
- To do:
I can use a calibration line and its equation, and explain what R², the blank and the range of the standards mean.
- To do:
I can calculate a percentage error and compare it with the percentage uncertainty to decide whether a systematic error is present.
- To do:
I can distinguish random from systematic errors and give the direction in which a systematic error shifts a result.
- To do:
I can exclude an outlier with a reason and judge whether a difference between results is significant.
- To do:
I can give specific weaknesses, realistic improvements, assumptions and safety precautions for a method.
Carry on with Chemistry in Augment
With a free account, Augment remembers where you stopped in the notes and which questions you have marked.