The scientific investigation
What the IB Biology scientific investigation is, how it is marked, the rules on groups, integrity and ethics, and how to choose a focused research question.
- IB Biology
- Internal assessment
- SL and HL
The scientific investigation is the internal assessment (IA) of IB Biology. It is an open-ended investigation that you plan, carry out and write up yourself, on a research question of your own choosing. It is the only part of the course in which you work as a practising scientist. You decide what to measure, how to measure it, what the data mean and how far they can be trusted.
The same task, with the same four criteria, is set at SL and HL. The report is marked by your teacher and a sample from each school is then moderated by the IB, so the marks reward what is visible in the written report and nothing else.
What the internal assessment is
Weighting, time and length
The scientific investigation counts for 20% of the final IB Biology grade at both SL and HL. About 10 hours of teaching time is set aside for it, which covers choosing a question, planning, preliminary trials, collecting data and writing. The rest of the practical programme (practical work in lessons and the collaborative sciences project) prepares the skills it uses, but only the scientific investigation is marked.
The final product is a written report of no more than 3,000 words. Moderators are not expected to read beyond 3,000 words, so anything after that point earns nothing. A clear report of 2,000–2,500 words often scores better than one that uses every word, because each point is easier to find.
Counts towards the 3,000 words | Does not count towards the 3,000 words |
|---|---|
The research question, background and hypothesis | Charts, graphs and diagrams |
The description of the method, variables, safety and ethics | Data tables (raw and processed) |
Written analysis, interpretation and the conclusion | Equations, formulae and calculations |
The evaluation and improvements | Citations, references and the bibliography |
Annotations written as sentences of explanation | Headers |
A table or graph does not use up the word count, but the sentences that explain it do. This makes tables a sensible place to hold detail such as the list of controlled variables, provided each entry is short and the table is referred to in the text.
The four criteria at a glance
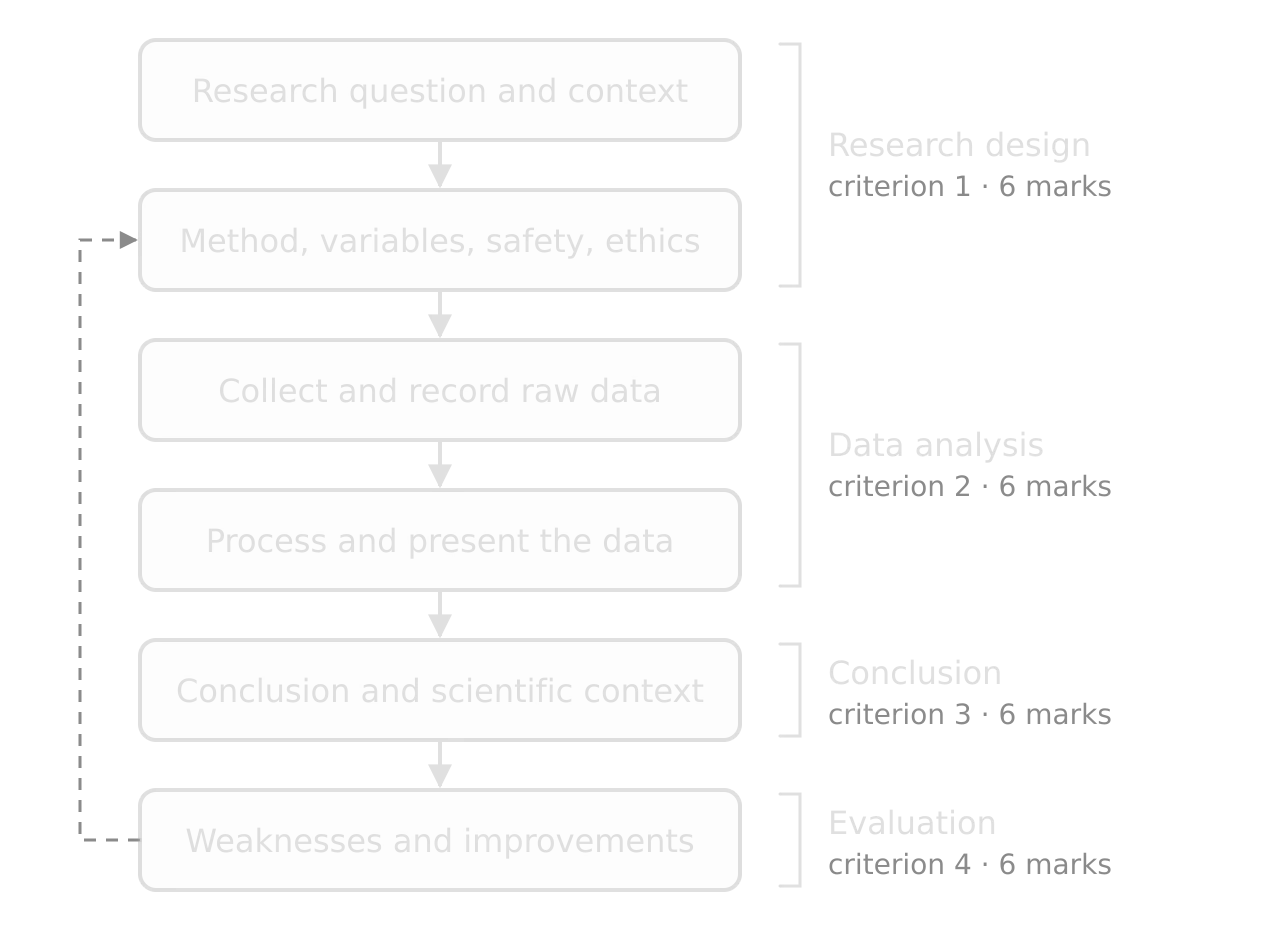
The report is marked against four criteria, each worth 6 marks, for a total of 24. Each criterion has three bands (1–2, 3–4, 5–6), and 0 is given if no descriptor is met. Your teacher reads the whole report and chooses the band that fits it best, then the mark within the band. The flow diagram of an investigation shows how the four criteria follow the stages of the work.
Criterion | Marks | What it assesses | Top band in brief |
|---|---|---|---|
Research design | 6 | The research question, its context and the method | A focused question set in a specific context; methodological choices (controls, data sufficiency, safety, ethics) explained; a method detailed enough for someone else to repeat |
Data analysis | 6 | Recording, processing and presenting data, and handling uncertainty | Clear and precise recording and processing; uncertainties considered properly; processing relevant to the question and carried out accurately |
Conclusion | 6 | Whether the answer to the research question follows from the analysis | A conclusion justified by and fully consistent with the processed data and its uncertainty, and compared with published science |
Evaluation | 6 | Weaknesses and limitations of the method, and improvements | The relative impact of specific weaknesses on the results explained; realistic, relevant improvements explained |
The descriptors use the IB command terms in a ladder. A lower band is reached when something is stated; the middle band when it is outlined or described; the top band when it is explained or justified. Writing "temperature was controlled" states a control. Writing how it was controlled and why an uncontrolled temperature would change the rate of reaction explains it.
Half of the marks (Conclusion and Evaluation) are for thinking that happens after the data are collected. A common pattern is a well-planned investigation that loses marks because the student ran out of time for these two sections, so a realistic timeline leaves time for both.
 YouTube
Working alone or in a group
You may carry out the investigation alone or collaborate in a group of up to three students. Collaboration can make a more ambitious method possible, for example a field study that needs several people to place quadrats, or a laboratory set-up that is slow to prepare.
The rules for group work protect the individual nature of the assessment:
The group may share a general methodology and may collect data together.
Each student must have their own research question. Usually this means a different independent variable or a different dependent variable from the other members.
Each student analyses their own data, relevant to their own question. Two students cannot submit the same raw data set.
Each student writes an individual report. A group report is not allowed.
The report says that the work was collaborative and names what was shared.
The range of approaches
The investigation does not have to be a laboratory experiment. Any approach is acceptable if it produces enough relevant data to answer the research question. Approaches can also be combined, for example a hands-on experiment checked against a published data set.
Approach | Type of data | Biology example | What to watch |
|---|---|---|---|
Hands-on laboratory experiment | Primary | Effect of pH on the rate of starch digestion by amylase, measured with a colorimeter | Control of variables; enough levels and repeats in the time available |
Fieldwork | Primary | Correlation between light intensity and the percentage cover of ivy (Hedera helix) along a woodland transect | Many variables cannot be controlled, so they are monitored; sampling must be random or systematic; minimal disturbance of the site |
Database | Secondary | Relationship between latitude and first flowering date, using a national phenology record | The data must be selected by a clear rule and processed further; copying values is not analysis |
Simulation | Primary (generated) | Effect of initial allele frequency on the time to fixation in a genetic drift simulation | A simulation that gives the same output every time has no variation to analyse; justify the settings |
Modelling | Primary or secondary | A spreadsheet model of logistic population growth compared with counts of yeast cells | The model must be tested against data, not just described |
Databases used for biology investigations include GenBank (DNA sequences, compared with BLAST), the Protein Data Bank, national climate and phenology records and published ecological surveys. A database investigation is marked against the same criteria, so it still needs a focused question, a justified way of selecting the data, processing, uncertainty and an evaluation of the data source.
Academic integrity
The report must be your own work. Your teacher sees the work in progress and authenticates the final report, and both of you confirm that it is your own. Teachers may give you feedback on one draft; after that, the report is your responsibility.
Cite every source you use: textbooks, papers and websites for the background, any published method you adapted, databases, simulations and every image or diagram you did not make yourself. Use one referencing style consistently.
Acknowledge collaboration. Name the group members and what you shared.
Record data honestly. Leaving out results because they do not fit, adjusting values or inventing repeats is malpractice. Anomalous results stay in the raw data table and are discussed.
Declare the use of AI tools. If a generative AI tool was used (for example to suggest a method or to check code for a spreadsheet), it must be acknowledged and cited like any other source. Presenting text, analysis or ideas produced by an AI tool as your own is malpractice.
Ethics and safety
The IB animal experimentation policy
The IB has its own guidelines for the use of animals in IB schools, and they are deliberately stricter than those used in universities, because school investigations train skills rather than produce new research. They apply to every animal, invertebrates as well as vertebrates, and to humans.
No investigation may cause pain, undue stress or harm to an animal, or put its health at risk. Changing an animal's food, environment or behaviour in a way that could harm it is not allowed.
Alternatives come first (replacement): cells, tissues, plants, microorganisms, databases or computer simulations are used instead of animals wherever they can answer the question.
If animals are essential, the method is changed to reduce any distress (refinement) and to use as few animals as possible (reduction).
Fieldwork observes organisms in their own habitat with as little disturbance as possible. Organisms that are moved, for example woodlice placed in a choice chamber, are handled gently and returned where they were found.
Any investigation involving live animals is discussed with your teacher and approved before it starts.
Investigations with human participants
Investigations on people, such as the effect of exercise on heart rate or of practice on reaction time, are allowed only under conditions that protect the participants.
Each participant gives written, informed consent after being told what will happen, and can withdraw at any time without giving a reason. Participants under 16 also need the written consent of a parent or guardian.
There is no risk of physical or psychological harm and no deception. Exercise stays within each participant's normal ability, under a teacher's supervision.
Results are anonymised (participant A, B, C) and kept confidential.
Investigations involving body fluids, such as blood, are not allowed, because of the risk of transmitting blood-borne pathogens. The only exception is an investigator using their own saliva or sweat. No participant is given a drug, supplement or food they would not normally take.
Safety and the environment
A risk assessment is part of the Research design criterion. It names the specific hazards of your method (hydrogen peroxide as an irritant, a water bath at 60 °C, a scalpel, a bacterial culture), the risk each poses and the precaution taken. Microbiology investigations use aseptic technique, sealed plates, incubation at no more than about 25–30 °C so that human pathogens are not favoured, and safe disposal by autoclaving. Environmental impact covers the disposal of chemicals and the effect of fieldwork on the site.
A timeline from topic to submission
Schools set their own internal deadlines, so the timeline in the table is a typical pattern rather than a fixed rule. Most of the 10 hours of class time go on preliminary trials and data collection; reading and writing happen around them.
Stage | What you do | Typical time |
|---|---|---|
1. Choose a topic | List ideas linked to the course; check that the variables can be measured with the apparatus available | Week 1 |
2. Research question and background | Read around the topic; write a focused research question; outline the theory and a hypothesis; get teacher approval | Weeks 1–2 |
3. Preliminary trials | Test the method on a small scale; choose the range, increments and timings; find the problems | Week 3 |
4. Final method and risk assessment | Fix the method, list the controlled variables and how each is controlled, complete the risk assessment | Week 3 |
5. Data collection | Collect all levels and repeats in as few sessions as possible; record raw data and qualitative observations at once | Weeks 4–5 |
6. Processing and analysis | Calculate means, standard deviations and rates; draw graphs; carry out a statistical test | Week 6 |
7. Conclusion and evaluation | Answer the research question with the data; compare with published science; evaluate weaknesses and improvements | Week 7 |
8. First draft and feedback | Submit one complete draft; act on the teacher's feedback | Week 8 |
9. Final report | Check the word count, citations and the pre-submission checklist; submit | Week 9–10 |
How to choose a strong research question
What a research question is
The research question sets the limits of the whole investigation. A focused question makes the method obvious, tells the reader what the graph will show and makes the conclusion easy to write, because the conclusion is the answer to it. A vague question leads to a vague method and a conclusion that cannot be tested against the data.
A strong research question for an experiment usually has this form: What is the effect of [independent variable, with its range] on [dependent variable, with how it is measured] in [organism, by scientific name, or system]? For a correlation study, What is the relationship between [variable 1] and [variable 2] in [population or site]? A hypothesis is not compulsory, but a prediction with a reason based on theory helps to show the context.
Features of a strong question
One independent variable, which can be changed in at least five measured steps (or, in a correlation, measured over a wide range).
A quantitative dependent variable measured with an instrument, not judged by eye. Quantitative data can be processed and tested; qualitative data such as colour support the analysis but rarely answer the question alone.
A specific organism or system, named precisely: "catalase in potato tuber (Solanum tuberosum)", not "enzymes in vegetables".
Real biology behind it: a mechanism (enzyme kinetics, osmosis, limiting factors) that explains why the variables should be related, so the conclusion can be compared with accepted theory.
Feasible: the data can be collected safely, ethically and within the hours available, with enough repeats.
Not trivial: the answer is not already obvious, or the investigation finds something more precise than the obvious answer (such as the position of an optimum or the isotonic point).
Turning weak questions into focused ones
The same process works for any topic. Narrow the system to one organism, choose one variable to change and one to measure, and decide how each will be measured before writing the final wording.
Strong and weak biology investigation ideas
The table compares ideas that usually work well with ideas that usually run into trouble, and the reason in each case.
Strong idea | Why it works | Weak idea | Why it struggles |
|---|---|---|---|
Effect of hydrogen peroxide concentration on the rate of oxygen release by potato catalase | Concentration is easy to vary in five or more steps; gas volume is measured precisely; links to enzyme kinetics in C1.1 | "Which vegetable has the most catalase?" | Categorical independent variable with many hidden differences; no theory predicts a ranking |
Effect of sucrose concentration on the percentage change in mass of sweet potato (Ipomoea batatas) cylinders | Finds the isotonic point by interpolation; links to water potential in D2.3 | Effect of salt on plants watered for six weeks | Too slow to repeat; many uncontrolled variables (light, temperature, pests) |
Effect of light intensity on the rate of photosynthesis in Cabomba caroliniana | Light can be varied by distance or a dimmer; gas production measured; links to limiting factors in C1.3 | Effect of music on plant growth | No plausible mechanism; growth is slow and highly variable |
Effect of temperature on the permeability of beetroot (Beta vulgaris) membranes, measured by colorimetry | Absorbance is an objective measure of pigment released; links to membrane structure in B2.1 | Effect of temperature on beetroot, judging colour by eye | Subjective dependent variable; no numbers to analyse |
Relationship between leaf position and stomatal density in one species | Countable data from nail-varnish impressions; many repeats possible; links to B3.1 | Effect of exercise on stress in pet hamsters | Unethical under the animal experimentation policy |
Divergence of cytochrome c sequences between primates, from NCBI databases | Large free data set; clear processing (percentage difference); links to A3.2 and A4.1 | Copying published heights of species from a website | No processing or analysis beyond copying values |
Before you start: a planning checklist
- To do:
My research question names one independent variable, one dependent variable with how it is measured, and the organism by its scientific name.
- To do:
I can test at least five values of the independent variable, with at least five repeats of each, in the time available.
- To do:
The dependent variable is measured with an instrument and has a known uncertainty.
- To do:
I can explain the biology that links my two variables, and I have at least two reliable sources for it.
- To do:
The investigation is safe, ethical under the animal experimentation policy, and has my teacher's approval.
- To do:
If I am in a group, my research question and data are different from those of the other members.
- To do:
I have planned time for the conclusion and evaluation after the data are collected.
Carry on with Biology in Augment
With a free account, Augment remembers where you stopped in the notes and which questions you have marked.